XAU/USD – GOLD 08/09 | Captain VincentObserving JPY & USD | Buy still holds dominance
🔎 Captain’s Log – News Context
This morning there were no major new updates.
The US session tonight (08/09) will also not release big data.
The latest impact on the market is Japanese PM S. Ishiba’s resignation , which pressured JPY downward and slightly lifted the Dollar.
However, Gold only made a small correction and maintained strong stability.
➡️ Captain’s Summary: Dollar and JPY currently only have indirect influence, not enough to push Gold deeply lower. The main trend is still supported for a bullish rebound.
📈 Captain’s Chart – Technical Analysis
Captain’s Shield (Main Support):
Golden Harbor OB: 3542 – 3549
Main Buy Zone: 3549 – 3551
Liquidity Dock: 3573 – 3575
Storm Breaker (Resistance):
Quick Boarding: 3602 – 3604 (Short-term Sell scalp)
Storm Breaker Peak: 3632 – 3634 (Sell zone – may form a new ATH)
⏩ Price structure remains bullish (continuous BOS). Corrections are mainly liquidity grabs before pushing up to higher resistance zones.
🎯 Captain’s Map – Trade Scenarios
✅ Golden Harbor (BUY – Priority)
Buy Zone: 3549 – 3551 | SL: 3542 | TP: 3553 → 3557 → 3560 → 3563 → 35xx
Liquidity Dock: 3573 – 3575 | SL: 3565 | TP: 3578 → 3581 → 3583 → 35xx
⚡ Quick Boarding (SELL Scalp – Short-term)
Entry: 3602 – 3604
SL: 3610
TP: 3600 → 3597 → 3594 → 3591 → 3588 → 35xx
🌊 Storm Breaker (SELL Zone – New ATH)
Entry: 3632 – 3634
SL: 3640
TP: 3629 → 3625 → 3623 → 3619 → 361x
⚓ Captain’s Note
“The golden ship sails steadily as the seas remain calm this morning, with no big news waves. Golden Harbor 🏝️ (3549 – 3551) together with OB near 3542 is the safe anchorage for sailors riding the bullish trend. Liquidity Dock ⚓ (3573 – 3575) is just a temporary anchor before the bullish winds carry the ship further. Quick Boarding 🚤 (3602 – 3604) is for those who want to ride short-term waves. And if the ship touches Storm Breaker 🌊 (3632 – 3634) , it may be a new wave peak – but the grand journey is still headed North with the bullish sails full of wind.”
Forexsignals

XAUUSD At Critical PRZ: Will Gold Reverse or Break to New Highs?Hello Traders And Investors
XAUUSD At Critical PRZ: Will Gold Reverse or Break to New Highs? 🔥”
The recent price action on Gold (XAUUSD) has reached a very critical level near $3,586 – $3,600, which aligns with a strong resistance zone. This area is marked as a Potential Reversal Zone (PRZ), where sellers may step back into the market.
🔍 Market Structure Breakdown:
Previous Liquidity Sweep
Price collected liquidity below the July lows before forming a Higher Low at the start of August.
This move gave the market strength to push higher, creating a clean bullish structure.
Strong Impulsive Rally
From mid-August onwards, gold showed a strong bullish impulse, breaking through minor resistance levels without much pullback.
However, such parabolic moves often lack sustainability, making them vulnerable to a healthy correction.
Resistance & PRZ Reaction
The current resistance zone has historically acted as a strong rejection level.
Price tapping into this zone suggests exhaustion in bullish momentum, increasing the probability of a short-term pullback.
🎯 Target Zones for Downside Move:
1st Target: $3,480 – $3,500
This area coincides with a previous demand block and will act as the first reaction point.
Final Target: $3,330 – $3,320 (Key Support)
If bearish momentum sustains, price could revisit this major support, completing the correction phase before potentially resuming the broader uptrend.

GBP/USD Rising Wedge Breakdown PotentialThe GBP/USD 30-minute chart shows price moving within an ascending trendline but recently stalling near resistance around 1.3550–1.3560. The Ichimoku cloud suggests weakening bullish momentum, with price struggling to sustain above the support line.
Bearish Setup: A breakdown below the ascending trendline and cloud support around 1.3500 could trigger stronger downside pressure.
Targets: If selling momentum continues, price may test the 1.3420 and 1.3395 support levels.
Stop Loss: A safe invalidation zone lies above 1.3550–1.3560, where further upside would invalidate the bearish scenario.
🔎 Overall, GBP/USD looks vulnerable to a short-term pullback unless it reclaims strong bullish momentum above 1.3550.

High probability 1:7 Gold buy scenario.Gold is developing nice scenario for upside move. Currently it is under consolidation. We are expecting manipulation toward FVG (1 and 15m overlapping) and then upward movement after liquidity sweep. Below is detail
1. Price has created Break of Structure.
2. Displacement happened, which created FVGs in 5 and 15m overlapping.
3. FVGs are formed in Discount and OTE zone.
4. FVGs are overlapping BB on 5m.
5. HTF bias is also upside.
All these combinations are signalling a high probability and high Risk and Reward (1:7) trade scenario.
Note – if you liked this analysis, please boost the idea so that other can also get benefit of it. Also follow me for notification for incoming ideas.
Also Feel free to comment if you have any input to share.
Disclaimer – This analysis is just for education purpose not any trading suggestion. Please take the trade at your own risk and with the discussion with your financial advisor.

Xau USD Bullish Structure Xau USD is making Higher High pattern . From 3325 it's moving upward with Higher High pattern . It's moving up . From here I m seeing again 10 -15 point movement . It's bullish Structure at higher level . We can wait for retracement if you are safe player. Consult your financial advisor before making any position in stock market.

1:7 RnR trade opportunity on GBPCADGBPCAD is forming a great price action and scenario. Which may lead to high risk and reward trade. Below are the signals noticed ...
1. Price has broken 10 days’ consolidation of trend line and nearby resistance as well.
2. Created BOS and FVG on 1-hour time frame in discount area.
3. Price is running above VWAP and 21 EMA. And 21 EMA crossing over VWAP.
4. Now we can expect a pullback till FVG area.
All these combinations are signalling a high probability and high RnR (1:7) trade scenario.
Note – if liked this analysis, please boost the idea so that other can also get benefit of it. Also follow me for notification for incoming ideas.
Disclaimer – This analysis is just for education purpose not any trading suggestion. Please take the trade at your own risk and with the discussion with your financial advisor.

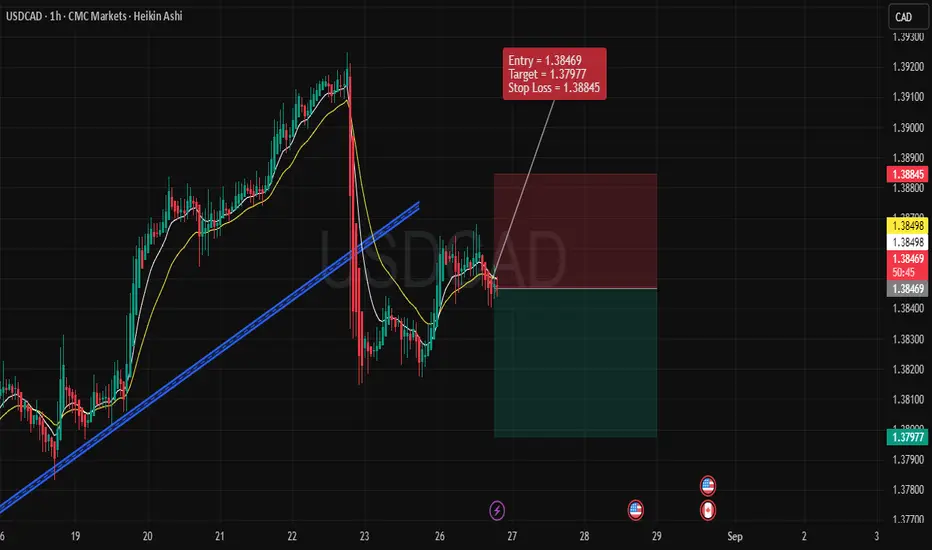
USDCAD – Bearish Trade Setup (1H Timeframe)Trade Details
Entry: 1.38469
Stop Loss: 1.38845
Target: 1.37977
🔹 Technical Reasons for Bearish Bias
Trendline Breakdown
Price recently broke below the rising trendline, indicating that the bullish momentum has weakened.
The failed retest of the broken trendline confirms bearish pressure.
Moving Averages Confirmation
The short-term moving averages (yellow lines) have crossed to the downside, aligning with bearish sentiment.
Price is trading below these moving averages, signaling sellers are in control.
Lower High Formation
After the sharp drop, the latest pullback failed to make a new higher high.
This indicates a shift from bullish structure to a bearish lower-high pattern.
Weak Recovery Attempt
The rebound after the drop is shallow and lacks strong bullish candles.
This suggests the market is unable to regain bullish momentum.
🔹 Risk Management
The Stop Loss is placed above the recent swing high (1.38845), protecting against sudden spikes.
The Target is set at 1.37977, aligning with recent support levels and offering a favorable risk-to-reward ratio.
🔹 Trade Outlook
This setup anticipates continuation of the bearish trend after the trendline break. Unless price reclaims and sustains above 1.3885, sellers remain favored in the short term. A successful breakdown could open the way for deeper downside in USDCAD.
✅ Summary:
Bearish structure confirmed by trendline break, bearish moving average alignment, and weak recovery → Entered short at 1.38469, targeting 1.37977 with stop at 1.38845.
XAU/USD Trading Plan – Gold Eyes 3400! 🚀Gold continues to hold its bullish momentum as the USD weakens, and buyers are stepping in with strong FOMO-driven demand. However, a short-term correction (1–2 days) is still possible before the next big leg higher.
The smart play? ⚡ Wait for clean pullbacks into strong liquidity zones — buy low, hold, and ride the trend.
📊 Short-Term View (M15–H1)
Break below 337x could push Gold quickly down to 335x–334x to fill liquidity gaps.
Bigger picture remains bullish with a potential run to 3400 and beyond.
🔑 Key Levels
Support: 3363 – 3356 – 3349 – 3335
Resistance: 3385 – 3391 – 3402 – 3425
🎯 Trading Plan
✅ Buy Setups
Scalp Buy: 3356 – 3354
SL: 3350
Targets: 3360 → 3365 → 3370 → 3375 → 3380 → 3390 → 3400+
Swing Buy Zone: 3336 – 3334
SL: 3330
Targets: 3340 → 3350 → 3360 → 3380 → 3400+
❌ Sell Setups
Scalp Sell: 3385 – 3387
SL: 3390
Targets: 3380 → 3375 → 3370 → 3365 → 3350
High-Risk Sell Zone: 3401 – 3403
SL: 3407
Targets: 3396 → 3390 → 3380 → 3370
📌 Takeaway
Gold is still bullish overall, but short-term dips are healthy and provide the best entry points. Stay patient, wait for price action to confirm at key support, and let the market pay you.

AUDJPY – High Probability Short Setup (15M)
📊 Market Insight:
AUDJPY has broken intraday structure and is now retracing into the 95.44 – 95.60 supply zone. This level is key for potential downside continuation.
🔑 Setup Details:
Supply Zone: 95.44 – 95.60
Entry Zone: 95.40 – 95.55 (confirmation required)
Targets:
TP1: 95.00
TP2: 94.85 – 94.90
Stop Loss: Above 95.60
🎯 Trading Approach:
I look for rejection or bearish confirmation candles before entering. Strict stop-loss placement and structured exits ensure controlled exposure, a must in fund management.
⚖️ Risk Management Philosophy:
Every trade is positioned with calculated risk allocation to safeguard client capital while compounding returns. Consistency and discipline form the backbone of my strategy.
📩 For Managed Accounts & Professional Trading Guidance
insta@ the_sohailarhaan

EUR/USD Bearish Trade Idea - Detailed Analysis** IF you like my observation, please boost and follow for more content."
Timeframe: 1 Hour
Entry Price: 1.16177
Stop Loss (SL): 1.16521
Take Profit (TP): 1.15763
Market Overview:
Trend Context: The EUR/USD pair is currently in a clear downtrend as indicated by the price action making lower highs and lower lows.
Chart Setup: The chart shows a descending triangle pattern, which typically signals a continuation of the bearish trend, as the price struggles to break through the resistance at the upper boundary while consistently making lower lows.
Trade Rationale:
Descending Triangle Pattern:
The formation of a descending triangle indicates a strong bearish bias, where the sellers have been consistently defending the resistance level.
The price is making lower highs and has found support at the 1.16177 level, a key point where the downtrend has previously gained momentum.
A breakdown from this triangle often leads to a continuation of the downward movement, reinforcing the bearish outlook.
Entry Setup:
The entry point at 1.16177 is set below the support level, confirming that the price is likely to break through and continue downward.
A close below this level would provide confirmation for the short position, as the breakdown indicates further downward potential.
Stop Loss Placement:
The Stop Loss (SL) is set at 1.16521, just above the last significant swing high and the trendline of the triangle. This allows for some room in case of a false breakout while minimizing risk if the price reverses above this level.
Take Profit Target:
The Take Profit (TP) is set at 1.15763, where the previous support has been observed. This level represents a logical exit point, based on the measured move of the triangle pattern and the market's reaction at this support area.
Risk-to-Reward Ratio (RRR):
This setup offers a favorable risk-to-reward ratio, with a stop loss of approximately 45 pips and a take profit target of approximately 114 pips. This results in an RRR of about 1:2.5, which aligns with a solid risk management strategy for a favorable trade.
Technical Indicators:
Exponential Moving Averages (EMA):
The chart indicates the use of EMAs, which are still in a bearish alignment. The price is below both the 9-period and 20-period EMAs, suggesting that the overall trend is downward.
The EMA setup confirms the bearish momentum, reinforcing the rationale for the short position.

Bullish USDJPY (Long Position)Time Frame: 1-Hour
Trade Direction: Bullish
Entry Price: 148.629
Target Price: 149.262
Stop Loss: 148.108
Risk-Reward Ratio: ~2.3:1
1. Chart Analysis:
The price action has been respecting a strong ascending trendline (blue line) indicating a consistent upward momentum over the past several hours.
Price has recently bounced off the trendline and is approaching a resistance zone near 148.6, showing potential for a continuation upward towards 149.262.
Support Level: The price has previously found support at the 148.1 level, confirming a solid demand zone in the market.
2. Indicator Support:
Exponential Moving Averages (EMA): The price is currently trading above both the 9-period and 20-period EMAs, which is a bullish sign indicating upward momentum. The EMAs are also in alignment, further supporting the bullish case.
Volume Trend: There is an increase in volume accompanying the recent bullish price action, confirming strong buying interest and supporting the idea of a potential breakout towards the target.
3. Risk Management:
The stop loss is placed just below the recent low at 148.108 to provide a reasonable buffer against any price retracement, keeping the trade within an acceptable risk range.
The target is set at 149.262, just below the key resistance level, ensuring that we capture the full potential of the current trend while minimizing the risk.
4. Trade Setup Logic:
This setup is based on the continuation of the uptrend, with strong support from both the price action and indicators. The price action has successfully bounced from the trendline, confirming a potential continuation move towards higher prices.
The target lies near a resistance zone, making it a logical point for potential profit-taking.
5. Conclusion:
The overall market structure and indicators are aligned in favor of a bullish position, providing a high-probability setup. With a clear risk-reward ratio, this trade offers a favorable risk profile and a solid chance for profit.

XAU/USD Price Action Zones & Trade Setup (Aug 20, 2025)Analysis:
The market recently made a CHoCH (Change of Character), signaling a possible bearish structure.
First Selling Zone (3340 – 3350): Strong resistance area where sellers may push price down.
Second Selling Zone (3350 – 3360): A deeper liquidity grab area for confirmation shorts.
First Buying Area (3308 – 3320): Demand zone where buyers might step in for a short-term bounce.
Second Buying Area (3270 – 3280): Stronger demand, ideal for swing buy opportunities if price dips further.
Price is currently around 3323, hovering near equilibrium, likely to retest selling zones before dropping to buying areas.
📈 Trade Plan:
Sell Entries
🔹 First Short: Around 3340 – 3350 (First Selling Zone).
🔹 Second Short (confirmation): Around 3350 – 3360 (Second Selling Zone).
🎯 Targets:
TP1: 3320 (First Buying Area)
TP2: 3280 (Second Buying Area)
🛑 Stop Loss: Above 3365
Buy Entries
🔹 First Buy: Around 3310 – 3320 (First Buying Area) for a small bounce.
🔹 Second Buy (stronger): Around 3270 – 3280 (Second Buying Area).
🎯 Targets:
TP1: 3340 (back to resistance)
TP2: 3355 (liquidity above first selling zone)
🛑 Stop Loss: Below 3260

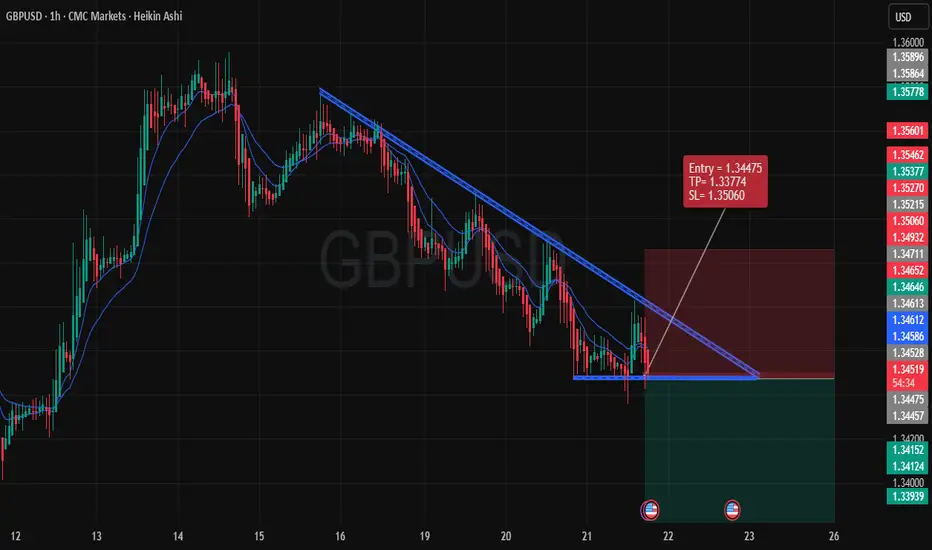
GBP/USD Bearish Trade Idea** IF you like my observation, please boost and follow for more content."
Overview:
The chart displays a clear bearish setup on the 1-hour timeframe for the GBP/USD currency pair. The pair has formed a descending triangle pattern, indicating potential downward price action. The price has been respecting the trendline resistance, which adds confidence to the short trade. Here’s a detailed breakdown of the key elements for this trade:
1. Pattern Formation:
Descending Triangle: A continuation pattern that suggests consolidation and potential breakout to the downside. The price is nearing the apex of the triangle, and we anticipate the breakout to occur below the horizontal support at 1.34495.
2. Entry Point:
The entry is set at 1.34475, just below the critical horizontal support level. This level aligns with the trendline resistance from previous price action, ensuring that we are positioning ourselves at a point where price momentum is likely to shift downward.
3. Stop-Loss (SL):
The stop-loss is placed at 1.35060, just above the trendline resistance. This level is chosen to minimize the risk in case the price fails to break the support and reverses back upward. Keeping the SL tight ensures that the risk is controlled.
4. Take-Profit (TP):
The take-profit level is set at 1.33774, based on the price's potential to reach a key support zone. The target is set at a conservative level, providing a strong risk-to-reward ratio while aligning with previous price action lows.
5. Risk to Reward Ratio:
With a SL of 85 pips and a TP of 705 pips, the trade offers a favorable 1:8.3 Risk to Reward Ratio. This ensures that the reward far outweighs the risk, making it a worthy trade setup for those seeking high probability and high return trades.
6. Technical Indicators:
Trend Indicators: The 9 and 20 EMA lines confirm the bearish trend as the price is trading below these EMAs. The cross of the 9 EMA below the 20 EMA further supports the downside momentum.
Volume: A decrease in volume during the consolidation phase suggests a buildup for a breakout, likely to the downside as indicated by the pattern.
7. Conclusion:
This trade setup provides a logical bearish scenario, supported by strong technical analysis. The entry, SL, and TP are placed strategically based on price action and pattern confirmation. A breakout below the support level at 1.34475 would trigger the short position, aiming for the next significant support at 1.33774.
The risk is well-managed with a tight SL, and the reward is significant, offering an excellent risk-to-reward profile.
Make sure to monitor the breakout closely, as this setup depends on the price respecting the triangle formation.
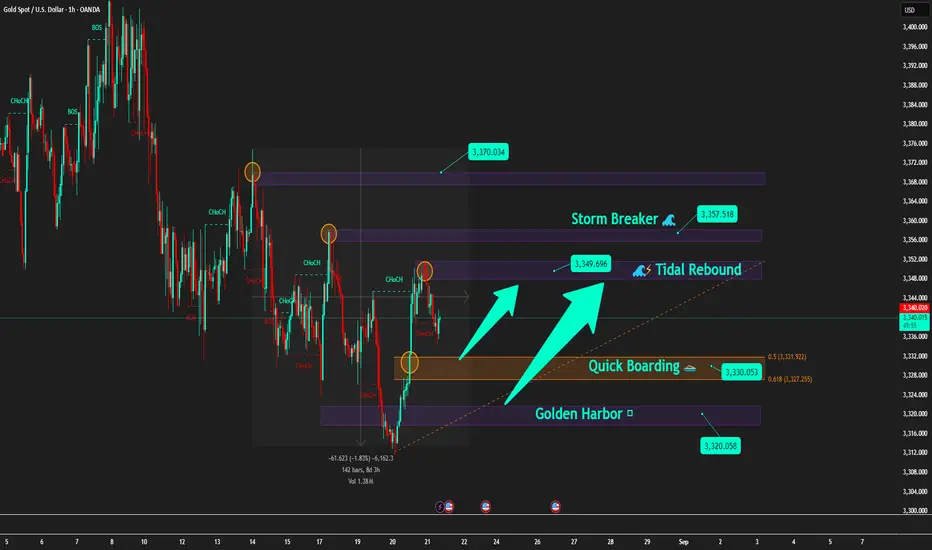
Gold after FOMC: Just a pullback or the start of a new wave?[Background
After the early morning FOMC session , Gold is showing signs of a sell-side pullback to gain momentum.
On higher timeframes (H4–D1), the structure remains bearish with lower highs .
However, consistent buying pressure around 3320 – 3330 keeps this zone as the key battlefield .
🪙 Key Levels Today
🔹 Storm Breaker 🌊 (Sell Zone 3357 – 3355)
SL: 3362
TP: 3350 → 3345 → 3340 → 33xx
🔹 Tidal Rebound 🌊⚡ (Sell Scalp 3349 – 3347)
SL: 3353
TP: 3345 → 3340 → 3335 → 33xx
🔹 Quick Boarding 🚤 (Buy Scalp 3330 – 3328)
SL: 3322
TP: 3335 → 3337 → 3339 → 3341
🔹 Golden Harbor 🏝️ (Buy Zone 3320)
SL: 3313
TP: 3325 → 3330 → extend further
📌 Trading Scenarios
After FOMC, the market may show rebound waves .
During Asia–Europe, price may consolidate between 3345 – 3357 .
If price tests Storm Breaker 🌊 → Prioritise Sell setups in line with the main bearish trend.
If price drops to Quick Boarding 🚤 or Golden Harbor 🏝️ → Short-term Buy scalps on pullback moves.
📰 Market Context
FED remains dovish leaning , with high probability of a rate cut in September (~82%, CME FedWatch) .
Geopolitical variables (Trump–Putin, Ukraine) remain unpredictable and may spark sudden volatility.
⚓ Captain’s Note
"Let Storm Breaker 🌊 test the buyers’ strength. Those who board at Golden Harbor 🏝️ will be lifted by the waves, but those who drift into the storm will soon feel the sea’s fury."
Gold (XAU/USD) Short-Term Bearish Setup1. Well-Defined Resistance Zones
Two horizontal shaded areas labeled Resistance R1 and Resistance R2 mark zones near $3,360–$3,380, where price repeatedly failed to break higher.
Trading ideas from analysts on TradingView reinforce that the immediate resistance lies around $3,364–$3,370. As long as price stays below that, sellers remain in control
TradingView
+1
.
2. Descending Channel & Bearish Momentum
The chart highlights a shift from an earlier ascending channel (green), followed by breakdown and decline — a classic reversal from bullish to bearish.
In line with this, there’s also mention of a bearish flag pattern forming on the 30-minute (M30) timeframe, offering a potential shorting opportunity
TradingView
+1
.
3. Key Support Levels & Targets
Multiple support levels annotated: Support S2 (at two levels) and Support S3, with notable levels around $3,315, $3,301–$3,302, and $3,300.
The annotated price action indicates projected declines toward those levels—especially highlighting $3,314.94, $3,301.55, and $3,300.96 as intermediate and key targets.
Ultimately, the red “High support area” below suggests a broader demand zone, perhaps around $3,280–$3,300, where stronger support may emerge.
4. Trading Plan Illustrated
White arrows depict a descending trajectory: from current levels down to each support, suggesting a sell-on-rally approach.
Blue markers denote possible bounce points for pullbacks before continuation lower.
Broader Market Context
Gold prices have recently been tracking in the $3,330–$3,350 range, facing resistance near $3,350–$3,360 and support near $3,300. Analysts caution that a break below that could push it toward $3,245 or $3,150–$3,120
TradingView
+1
.
Overall momentum has turned cautious or bearish—bearish engulfing patterns, weakening rally strength, and below-average technical indicators emphasize the risk of further declines
FXEmpire
+2
FXEmpire
+2
.
Weak U.S. economic indicators or dovish signals from Fed officials (like Powell) could offer brief relief rallies; but failure to reclaim resistance may extend the slide
FXEmpire
+1
.
Key Levels at a Glance
Level Type Price Range Notes
Resistance ~$3,350–$3,360+ Strong ceiling—decline confirms bearish bias
Support S1 ~$3,315–$3,320 First potential reaction zone
Support S2 ~$3,301 Intermediate target for sellers
Support S3 ~$3,300 Psychological barrier; near high support zone
High Support Area ~$3,280–$3,300 Zone where bullish buyers might regroup
Conclusion
Your chart effectively captures a short-term bearish trend in gold (XAU/USD), showing:
Failed attempts to overcome resistance near $3,360.
A bearish flag breakout signaling potential continuation downward.
Clearly plotted support targets, with bounce zones drawn out.
A visual trade plan suggesting sell-on-rallies targeting declining support levels until reaching a strong demand zone.
To succeed with this setup, traders might wait for a brief rally into one of the identified sell zones (e.g. ~$3,314 or $3,325) before entering shorts, with stop-loss placements above the resistance areas and profit objectives aligned with support levels ($3,301 or near $3,300).

Gold Price Awaits FOMC – Liquidity Levels in PlayGold price continued to slide into liquidity zones during the late US session yesterday and reacted perfectly at the MMFLOW BUY ZONE 3314 – 3316, delivering over +70 pips profit to traders ✅.
At present, on M5–M15, Gold is showing signs of a short-term recovery. However, for a strong upside move, buyers must break through the 3320 – 3322 resistance zone. A confirmed breakout here could trigger momentum towards higher KeyLevels, allowing price to retest important supply zones.
📈 Upside Targets (Intraday): 333x and 334x remain the key areas to watch for take-profits or potential reversal setups.
🔔 Why This Week Matters – The FOMC Decision
The highlight of the week is the FOMC meeting during the US session. Markets are awaiting clarity on the Fed’s next move. Any hint towards a September rate cut could trigger massive bullish momentum, breaking Gold out of its corrective channel.
👉 Asian & European sessions: Focus remains bullish toward 333x – 334x, with potential SELL setups at resistance.
⚠️ US session with FOMC: Expect extreme volatility – risk management is critical.
📉 MMFLOW Technical Trading Plan
🔹 BUY Scalp Setup
Entry: 3311 – 3309
SL: 3305
TP: 3315 → 3320 → 3325 → 3330 → 3340 → 3350 → 3360+
🔹 BUY Zone (FOMC Plan)
Entry: 3290 – 3288
SL: 3282
TP: 3295 → 3330 → 3335 → 3340 → 3350 → 3360 → 3370+
🔸 SELL Scalp Setup
Entry: 3342 – 3344
SL: 3348
TP: 3338 → 3332 → 3328 → 3324 → 3320
🔸 SELL Zone (FOMC Plan)
Entry: 3360 – 3362
SL: 3368
TP: 3355 → 3350 → 3345 → 3340 → 3330
⚠️ Key Notes for Indian Traders
FOMC = high volatility event – manage your exposure carefully.
Stick to strict TP/SL discipline to protect capital.
Smart traders know: KeyLevels = Profits ✅
🔥 Follow MMFLOW TRADING for daily Gold price analysis, liquidity maps, and Smart Money insights – designed for Forex & Gold traders in India.

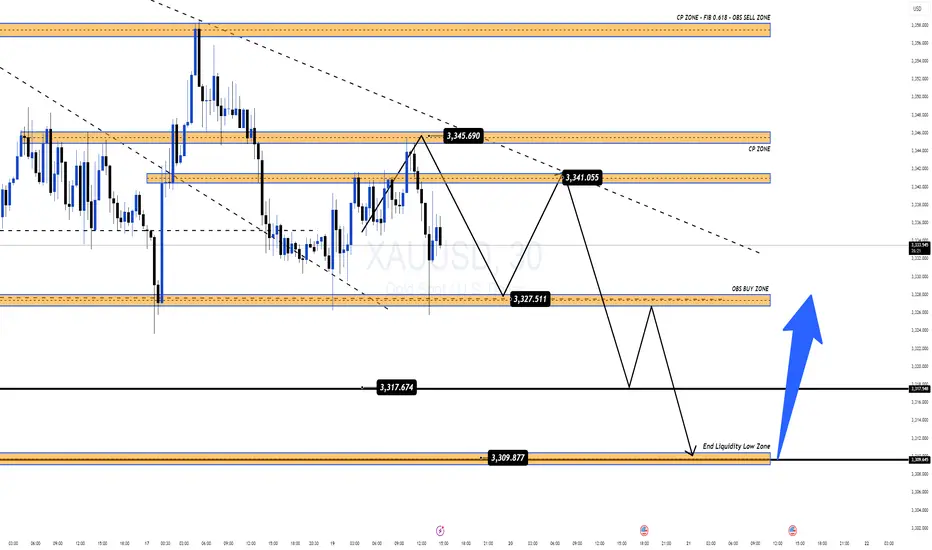
Gold Consolidates Ahead of FOMC Liquidity SweepGold is currently moving within a narrow range, with downside pressure becoming increasingly evident. With just over a day left before the FOMC meeting – an event that could shape the next major trend – the market seems to be preparing for a sharp liquidity sweep.
👉 At first glance, price action looks frustrating and unclear. But for traders following MMFLOW KeyLevels, this is actually the “golden range”, as key zones continue to hold with remarkable precision.
📉 Today’s Outlook
Main Trend: Ongoing corrective downside move.
Potential Scenario: A deep liquidity sweep towards the 331x zone before a strong bullish rebound.
🔑 Key Trading Levels
SELL Zone: 3340 – 3345 | Short SL: 4 – 5$
🎯 Targets: 3325 → 3317 → extended 3310
📌 Note: Manage risk tightly and watch reactions around KeyLevels – a single BreakOut move post-FOMC could unlock the next major opportunity.
✨ Once again: KeyLevels = Profits ✅
👉 Follow MMFLOW TRADING for daily KeyLevel strategies, liquidity maps & smart money insights
GOLD Waiting for the Big BreakOut after FOMC This WeekGold Sideway Compression | Waiting for the Big BreakOut after FOMC This Week
Gold is currently consolidating in a tight range, building up energy for a major BreakOut. After the liquidity sweep at the weekly open, price fluctuated strongly between the 332x – 335x zone, but on the H1 timeframe, the overall trend still remains within a descending channel.
Last week, CPI & PPI data failed to deliver a clear direction. This week, all eyes are on the FOMC meeting, expected to provide stronger signals for gold’s next move.
⏳ Early to mid-week: with limited impactful news, gold may continue to sideway within the narrow range or maintain downside pressure until FOMC is released.
🔑 Key Market Levels
Resistance: 3357 – 3369 – 3383 – 3398
Support: 3335 – 3317 – 3309
📌 Trading Setup
✅ BUY Zone: 3334 – 3332
SL: 3328
TP: 3338 – 3342 – 3346 – 3350 – 3355 – 3360 – 3370 – 3380
👉 If gold breaks the descending channel around 336x, expect a strong move towards 3383 – 3398.
✅ SELL Zone: 3383 – 3385
SL: 3390
TP: 3378 – 3374 – 3370 – 3360 – 3350
👉 If gold fails at higher resistance and reverses, liquidity may be swept back into 333x – 331x, with potential extension down to 329x.
⚠️ Summary
Gold is at a critical decision point: BreakOut or Breakdown.
Before FOMC: sideways / bearish bias within H1 channel.
After FOMC: expect a strong Pump or Dump to define the clear weekly trend.
🔥 Keep a close eye on reactions at KeyLevels (333x – 336x – 338x) to adjust trading strategy accordingly.

EUR/USD 1-Hour Rising Channel – Support Zone & Potential Upside!Chart Breakdown & Technical Insights
Rising Channel Structure
The chart clearly shows EUR/USD trading within a rising channel, marked by higher highs (red arrows) and higher lows (green arrows) forming parallel support and resistance trendlines.
Key Support Zone & Bounce Potential
The price is currently sitting near the ascending trendline support, highlighted by the shaded gray box and emphasized with a circled area. Many analysts note that this lower boundary—around the 1.1690 level—serves as crucial support on a broader time frame
.
Short-Term Momentum Indicators
According to recent technical calls, EUR/USD maintains a short-term bullish bias in the rising channel. However, some momentum indicators, such as RSI, hint at weakening strength—particularly when higher price highs are not matched with higher RSI peaks, suggesting a bearish divergence
.
Potential Upside Trajectory
Should the lower channel support hold, the chart suggests a rebound toward mid-channel or potentially up to the upper boundary. Analysts highlight the 1.1720–1.1750 area as a near-term resistance, with the upper channel boundary closer to 1.1850
.
Alternative Scenario – Breakdown Risk
If EUR/USD breaks below the channel (below ~1.1690), the bullish structure may falter. That could expose the pair to deeper pullbacks, possibly testing lower support levels around 1.1650 or lower
.
** Summary Table**
Scenario Likely Outcome
Bounce off support Move up toward mid-channel (~1.172) or channel top (~1.185)
Breakdown below support Decline toward lower support zones (1.1650 and below)
Conclusion & Strategy Snapshot
The price is positioned at a critical support within a well-defined rising channel.
The bullish favored path: a rebound from the lower trendline toward resistance levels.
The bearish risk: a breakdown would shift momentum, possibly leading to deeper retracements.
Monitor for price action signals (e.g. bounce, candlestick patterns), RSI behavior, and behavior around these key levels.

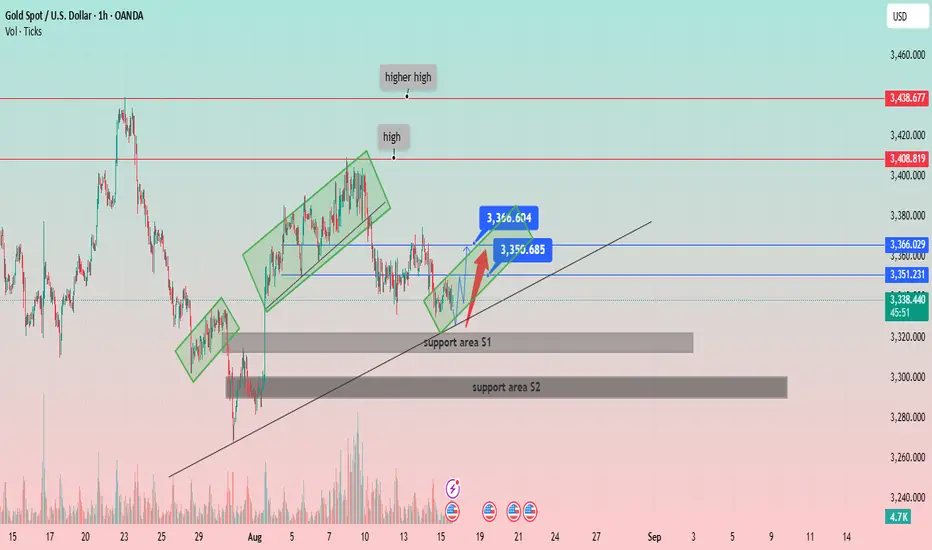
XAU/USD: Navigating the Uptrend and Key Support LevelsPrice Structure: Gold has been forming a series of higher highs and higher lows, indicative of a general uptrend. The chart labels a "high" and a "higher high," confirming this bullish structure.
Support and Resistance:
Two key support areas are identified:
Support area S1: A narrow zone around 3,320 USD. The price recently bounced off this area.
Support area S2: A broader, more significant zone around 3,290 USD, which appears to have been a strong support level in the past.
Several horizontal resistance levels are marked:
Immediate resistance: Around 3,351.231 USD and 3,366.029 USD.
Higher resistance: At 3,408.819 USD and 3,438.677 USD.
Channels and Trendlines:
The price has been moving within a series of ascending channels (highlighted in green rectangles), suggesting a stair-step upward movement.
A primary ascending trendline (black line) serves as a long-term support, with the price currently hovering just above it.
Recent Price Action and Projections:
The price recently broke out of a small downtrend and is showing signs of recovery from the "support area S1."
A potential price path is drawn with a red arrow, indicating a possible move towards the immediate resistance levels around 3,351 USD and 3,366 USD.
The chart highlights two specific price points, 3,360.604 USD and 3,350.685 USD, which likely represent a short-term trading range or target.
Volume: The volume spikes visible at key price points (e.g., at the low on July 30 and during the recent drop) indicate strong market activity.
XAUUSD Bullish Trend Continuation: Potential Move to $3,400!The price action shows a higher high ("high") and a higher low ("low"), which are characteristic of an uptrend. An upward trendline has been established, connecting a series of higher lows, which is acting as a dynamic support level. A significant horizontal support zone has also been identified around the $3,260 - $3,280 price range, where the price previously found support.
Recently, the price experienced a pullback and bounced off the upward trendline. The analysis anticipates a continuation of the upward momentum toward a key resistance zone. This resistance zone is located around the $3,400 - $3,420 level. A specific target price of $3,408.833 is highlighted within this zone, suggesting a potential area where the upward movement might pause or reverse.
The chart includes a potential corrective wave pattern labeled with "C"s, indicating a recent three-wave pullback within the larger trend. The current price is shown at $3,353.520, positioned above both the horizontal support and the upward trendline, reinforcing the bullish sentiment.

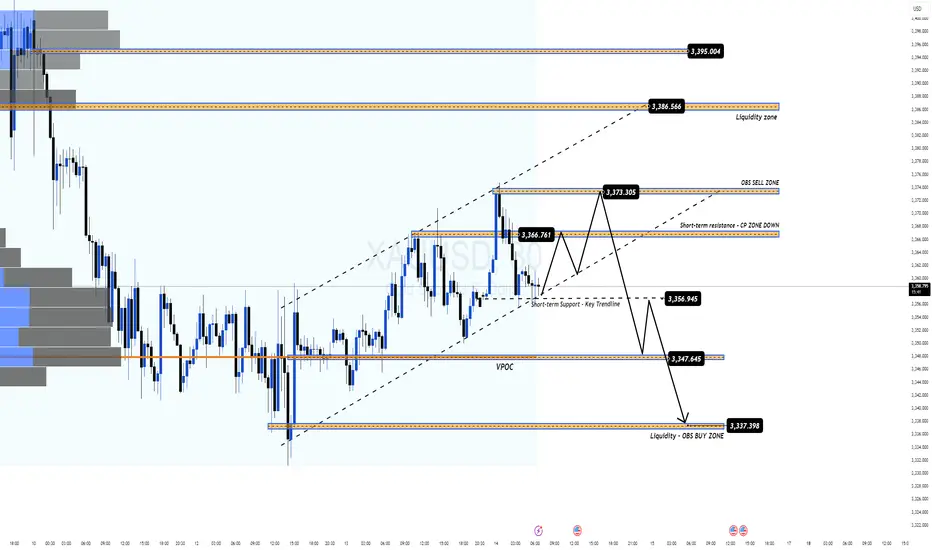
Fed Set to Cut 50bps: Gold Gains as the Bullish Wave Forms Again📌 Macro Overview
US Treasury Secretary Bessent gives the green light for a potential 50-basis-point rate cut by the Fed in September.
July CPI remains soft → USD weakens, bond yields fall, boosting gold’s bullish outlook.
Gold briefly touched $3,370/oz, closing at $3,355.9/oz (+0.24%).
Gains capped as US equities continue to break records and geopolitical tensions ease.
Market focus now shifts to PPI data, jobless claims, and the anticipated Trump–Putin meeting for the next directional cues.
🧐 Technical Outlook – MMFLOW Analysis
The bullish recovery wave is clearly re-emerging after a corrective phase, with price hunting liquidity zones left behind in the recent retracement.
Preferred strategy: Trade around key liquidity levels or continuation zones for SELL opportunities; BUY entries will be taken earlier to catch the recovery wave within the current price channel.
Price Structure & Observation Zones:
Short-term uptrend channel intact, primary support at 3336 – 3334 (Liquidity – OBS BUY Zone).
Major resistance at 3394 – 3396 (Liquidity Grab Zone + H1 Supply).
🎯 MMFLOW Trading Plan
🔹 BUY SCALP – Catch the recovery wave
Entry: 3336 – 3334
SL: 3330
TP: 3340 – 3345 – 3350 – 3355 – 3360 – 3365 – 3370 – 3380 – ???
🔹 SELL SCALP – Counter-trend at resistance
Entry: 3394 – 3396
SL: 3400
TP: 3390 – 3385 – 3380 – 3370 – 3360
📊 Key Levels
Resistance: 3365 – 3370 – 3395
Support: 3340 – 3336 – 3330
💡 MMFLOW Strategy Tip:
Wait for price to retest the 3336 – 3334 BUY ZONE for trend-following BUY positions.
Watch for liquidity absorption signals at 339x – a potential SELL reversal zone.
Gold Price Faces Key Resistance — Can Bulls Break $3,440?The XAU/USD (Gold vs. USD) 1-hour chart shows a strong bullish structure within an upward channel, supported by higher highs and a recent ATH (All-Time High) retest.
Resistance Zone: $3,410 – $3,440 is acting as a significant supply area. Price may face selling pressure here.
Support Levels: First support lies near $3,300 (supply zone), followed by the $3,225–$3,250 demand zone.
Trend: The price is respecting the upward trendline, but a break below could trigger a retest of the green supply zone.
Bullish Scenario: A breakout and close above $3,440 could lead to a continuation toward $3,475+.
Bearish Scenario: Rejection from the resistance zone with a break below $3,300 could push price toward the $3,225 support.
Overall, gold is currently in a bullish trend, but needs to overcome the $3,440 barrier for further upside momentum.
