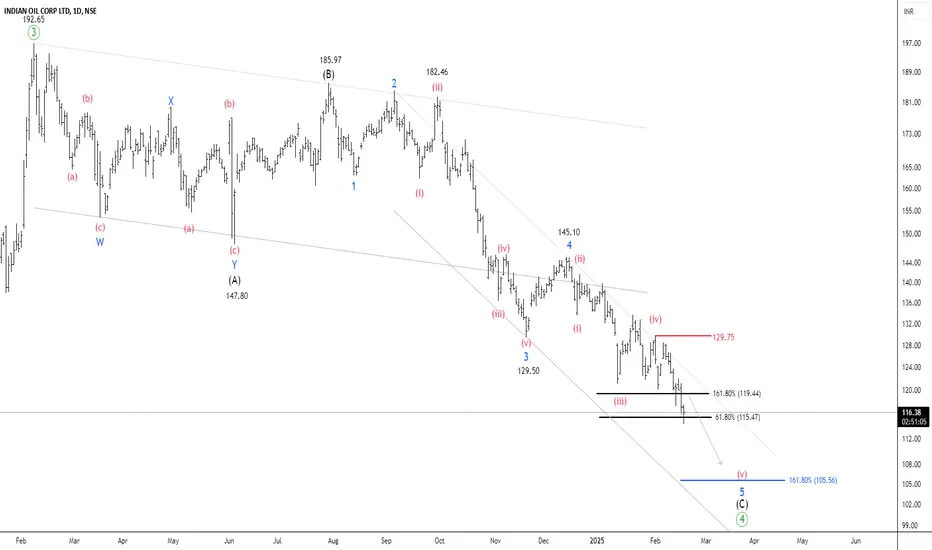
NSE IOC – Approaching a Key Demand ZoneTimeframe: Daily
After reaching a high of 196.8, the price has declined by over 39% in 13 weeks. It is currently trading below the 50/100 EMA band, with ATR at 3.68 and ADX at 26.02 . According to the Elliott Wave projection, the peak of 196.80 can be identified as a wave ((3)). The security is currently undergoing the formation of a corrective wave (4).
Wave (B) formed at 185.97 , while wave 4 of wave (C) was completed at 145.10 . NSE IOC is now setting up for the final wave 5 of wave (C).
Two key Fibonacci relationships help estimate the end of the correction:
1.618 Fibonacci extension of wave (A) at 106.54 (for wave C)
0.618 Fibonacci extension of wave 1 at 115.52 (for wave 5)
The price is expected to settle between 115 and 105 , which serves as a key demand zone for buyers. If the price breaks out and sustains above 129.75, traders can target the following levels: 139 – 156 – 172+.
we will update further information soon.
Forextidings
Can NIFTY Regain Its Balance or Will It Plummet Further?Timeframe: 4h
After reaching a peak of 26,277 , the NSE NIFTY has begun to decline within a downward parallel channel. The Elliott wave structure can be identified as (W) – (X) – (Y) , where wave (X) peaked at 24,867 , followed by a downward movement for the final wave (Y). The price has fallen below the 20 , 50 , 100 , and 200 EMA levels, with an ATR of 166.36 .
The correction has several key levels to consider:
At 100% retracement of wave (W) at 21,962
At 100% retracement of wave (a) at 22,827
At the lower boundary of the corrective channel
Bearish sentiment is currently stronger than buyer demand. A reversal may occur either after a breakout from the parallel channel or at the lower boundary of the channel. This is possible as long as the swing low of 21,283 remains intact.
We will update further information soon.

Is Tata Motors Ready for a Bullish Reversal?Timeframe: Daily
Tata Motors (NSE) has been in an expanded flat correction pattern for the past 11 months. In this pattern, the highest high (HH) was 1179, and the lowest low (LL) was 683.2. Currently, the price is trading below the 200, 100, and 50 EMA levels, indicating a bearish trend.
In this expanded flat correction:
Wave (A) completed at 855.4,
Wave (B) peaked at 1179,
Sub-wave 4 of Wave (C) touched 786.65,
Sub-wave 5 is now unfolding.
Once Wave 5 is completed, traders can look for buying opportunities with target levels at 799 – 951 – 1050+. First, it’s crucial to identify the end of Wave (C) to confirm the correction’s completion and a bullish reversal.
Projecting ending point of wave (C):
Wave (C) may end at 2.618% of Wave (A) around 628.7.
Wave 5 has multiple potential targets/support levels:
0.618 extension of Wave 1 at 526,
0.382 extension of Wave 1 at 628,
1.618 reverse Fibonacci of Wave 4 at 657,
2.618 reverse Fibonacci of Wave 4 at 562.
We will update further information soon.

NSE LINDEINDIA – Elliott Wave ProjectionTimeframe: Daily
NSE LINDEINDIA is currently trading below both the 100 and 200 EMAs, indicating a bearish trend. The ATR stands at 232, reflecting low volatility while supporting the ongoing downward movement. The price action has formed a descending channel, with a clear corrective pattern visible within this structure.
The price has completed wave 5 of wave (C) and begun moving upward. A downward value area is visible near the lower band of the descending channel. The price has reached 100% of wave (A), suggesting it has hit the anticipated Fibonacci ratio, indicating a potential correction. To confirm this assumption, the price must break above wave 4 of wave (C) at 6800 . If this breakout occurs, traders can look for the following targets in a long setup: 7500 – 8198 – 8660+.
We will update further information soon.

Part 1: How to Analyze Events in the Forex Market?
The forex market is one of the most dynamic and volatile financial markets in the world. It is deeply influenced by global events, economic data, and geopolitical developments. Traders who understand how to analyze these events can make informed decisions and capitalize on market movements.
Influence Of the Global Events:
The forex market is directly linked to global economic health. Since currencies represent the economies of their respective countries, any significant event like an interest rate decision, inflation data, or geopolitical conflict. It can cause major fluctuations in currency prices. Here’s global events play important role:
- Central Bank Policies: When the Federal Reserve (Fed) or European Central Bank (ECB) changes interest rates, it impacts global liquidity and investment flows.
- Economic Data Releases: GDP growth, inflation, and employment reports provide insights into economic stability, affecting investor confidence.
- Geopolitical Events: Wars, elections, trade agreements, and diplomatic conflicts impact currency demand and risk sentiment.
What Happens When News Is Published?
When a major economic event or news release occurs, the forex market reacts instantly. Here’s the typical stages of events:
Stage 1: Market Expectations: Before the news release, traders anticipate the outcome based on forecasts. The market often prices in expectations.
Stage 2: Immediate Volatility: If the actual data differs from the forecast, there’s a sharp price movement in the affected currency pairs.
Stage 3: Liquidity Fluctuations: Spreads widen, and liquidity dries up momentarily as traders rush to execute orders.
Stage 4: Short-Term Correction: After the initial reaction, the market stabilizes, and price action follows the broader trend.
Major Events:
Central Bank Meetings – Institutions like the Fed, ECB, BoJ, and BoE set monetary policies. Interest rate hikes strengthen a currency, while rate cuts weaken it. Forward guidance also plays a role in shaping long-term trends.
Inflation Reports (CPI & PPI): These measure inflation levels, influencing central bank decisions. Higher inflation often leads to interest rate hikes, strengthening the currency, while lower inflation may result in monetary easing, weakening it.
Employment Data (NFP & Job Reports) – The US Non-Farm Payrolls (NFP) report is a key indicator. Strong job growth supports a stronger USD, while weak employment data signals economic trouble.
GDP Growth Reports –:A higher-than-expected GDP growth rate boosts investor confidence and strengthens the currency, while economic contraction leads to depreciation.
Political & Geopolitical Events: Elections, government policies, trade wars, and conflicts create uncertainty, often pushing investors toward safe-haven currencies like the USD, JPY, or CHF.
One's Loss, Another's Win:
When the U.S. releases strong economic data, such as higher-than-expected GDP growth, strong job reports (NFP), or an interest rate hike by the Federal Reserve, The demand for the U.S. dollar increases. This leads to USD appreciation against other currencies, including the euro.
For example,
---> EUR/USD falls : USD is gaining strength, it takes fewer dollars to buy 1 euro, causing the EUR/USD exchange rate to drop.
---> USD/EUR rises : USD is now wortth more, the inverse exchange rate (USD/EUR) increases, meaning 1 USD can now buy more euro.
Key strategies for trading events:
•Stay Ahead with an Event Calendar: Keep track of important economic events and central bank meetings to anticipate potential market-moving news.
• Gauge Market Expectations: Understand forecasts and market sentiment before the event to predict how the market might react.
• Implement Stop-Loss Orders: Protect your trades from excessive risk by setting stop-loss orders to cap potential losses during volatile moves.
• Wait for Market Stability: Allow the market to settle after the event to avoid getting caught in the initial volatility and better assess the trend.
• Evaluate the Market’s Response: Assess the immediate market reaction to the event to identify if the initial price move is sustainable or a short-term spike.
Drawbacks of Trading News:
High Volatility & Whipsaws: Prices can spike in both directions before settling on a trend, leading to stop-loss hunting.
Widened Spreads: During news releases, brokers often widen spreads, increasing trading costs.
Slippage: Rapid price movements can lead to orders being executed at unexpected prices.
Emotional Trading: Sudden market swings can trigger impulsive decisions, leading to losses.
Market Manipulation: Big players and institutions often move the market unpredictably before major news releases.
In the next part, we will focus on the specific events and strategies.

MCX Gold: Elliott Wave Insights on Ascending ChannelTimeframe: Daily
MCX Gold has been trading within an ascending parallel channel for over 65 weeks . The value area highlights zones of supply and demand, with the control line exerting a gravitational pull on the current price. Within this structure, there are four zones of no trading activity and two neutral zones.
A triangle pattern is forming around the control price, indicating a potential price movement. If the price closes above the control line, it could potentially reach the following targets: 77660 – 78560 – 79600+ . On the other hand, if the price breaks and closes below the strong support level, we may witness a short decline, possibly reaching the lower band of the parallel channel.
We will update further information soon.

GUARGUM51! - Key Trends and Price PredictionsOn the NCDEX, guar gum has formed an Elliott Wave cycle, with the final Wave E of Wave (4) approaching completion. A confirmation above Wave D could shift the entire outlook in favor of buyers. From a price action perspective, 9830 serves as a strong support level, while 13,650 acts as a supply zone, both of which have remained significant for over four years. Wave D represents a critical midpoint, ensuring a push toward the upper supply zone once the price sustains above this level or Wave D.
If the price has completed Wave (4) and has broken above Wave D, it is likely to reach the upper boundary of the value area, around 13,650 . However, with the ADX (Average Directional Index) at 17, this suggests a weak trend, indicating that the current price movement lacks strength. If the price closes below the demand zone at 9,830 , it could delay the expected bullish move. Traders should wait for confirmation before entering a long position to ensure a stronger trend.

TMCFGRNZM: Breakout Could Fuel Bullish MomentumNCDEX TMCFGRNZM is showing signs of potential growth, but the increase so far hasn't been significant. According to Elliott Wave analysis, the price has formed an impulsive pattern, with wave (c) of wave ((4)) reaching a level of 13,000 .
The price is currently in the final wave ((5)) of the impulsive cycle. For this to confirm the impulsive movement, the price needs to break above the level of wave (B), which is at 16,590.
A strong resistance is expected at wave B, and if the price breaks through this level, it could boost the bullish momentum, leading to a new high. However, without this confirmation, the price may not be suitable for long-term investment and could remain in a corrective phase.
We will update further information soon.

NSE Bajaj Finserv - Can buyers face falling knives? Timeframe: 8h
Price started to form impulsive wave C after Bajaj Finserv completed correction wave B. There is also the possibility of altering the count with W-X-Y.
Wave (b) retraced 50% of wave (a), which signals intense supply pressure. If the price breaks wave (a) at 1621, traders can sell for the following targets: 1594 – 1569 – 1549 . Calculations are based on Fibonacci extensions. Price has completed 100% Fibonacci extension in wave A so that wave C could extend by 161.8% .
Currently, the price has broken down to 50 EMA , and a negative closing will result in further price declines. Parallel channel throw-over is one of Elliott wave principle’s best target measurement tools. Targets will be extended in case of an extension of the trend.
I will update further information soon.

IS NIFTY PREPARING FOR 14800?Nifty is forming in a descending parallel channel. Prices are building corrective pullbacks to manage demand pressure and fall from resistance since the start of the correction. Nifty has created a lower low at 15183 and given an upward move of 15927 .
Nifty has faced supply pressure on the upper band three times. It indicates that bulls are not exceeding supply pressure and upper band. As bulls give up, bears enter and drive prices to lower levels.
16200 is strong resistance for bulls and the supply zone of the parallel channel. If the price sustains below 16200 , traders can expect the following targets: 15740 – 15326 – 14870 . We can expect a fake-out of the parallel channel.

AXIS BANK: Peculiar Reversion Or Trend continuation?Axis bank has been in the consolidation phase for more than 15 months. Prices fall rapidly after the crossover of 50 & 200 EMA . We can draw two control lines which can be helpful for target measurement.
If the price enters into the parallel channel, and after retracement sustains above 680 , traders can trade for the following target of 692 - 714 - 752 . Demand pressure can lead to the price at the upper band of the parallel channel.
Failure of sustainability above 680 may lead to a new low.
Let market earmark first before you commit to the market.

Pokarna Stock Is A Money-Making MachinePokarna has completed its impulsive wave c of the corrective wave ((4)). Wave C has traveled 100% Fibonacci extension of wave A at 548 .
Currently, the price has broken down the A wave at 585. If it sustains below 585 , traders can expect the following targets: 558 - 536 - 505 .
505 is strong support because corrective wave 4 accomplish near the corrective wave 4 of a lower degree. If the bull fails to keep the price above this level, we can see a big downfall.
Otherwise, the price will touch the control line and then the upper band of the descending channel .
I will update further information soon.

Adani Transmission in Final 5th WaveAdani Transmission (Closing Price: 1869.9)
According to Elliott Wave projection, Adani Transmission price will hike and touch 2118 - 2304 - 2364 levels. And the day traders can expect 1920 - 1946 levels.

Elliott wave projection: JSW Steel Trend AnalysisJSW Energy has been forming a downward channel for 22 weeks, and Elliott's projection illustrates the formation of a corrective structure.
Traders can short for the following targets: 289- 278 - 262
The corrective pattern started unfolding after a high of 408. Let's discuss wave formations and the Fibonacci relationship of correction.
Wave ((A)) is an impulse pattern and retraced 78.6% of wave 5.
Wave ((B)) is a double zigzag and retraced 61.8% of wave ((A)).
Wave ((C)) is unfolding its pattern, and it has broken down the descending channel of wave ((B)), which indicates that wave impulsive wave has started.

BANkNIFTY#BANKNIFTY
Inverted h&S pattern visible and ready to explode from this levels too.
Simple and best structure visible targets are.
Neckline Breakout is needed 39500. entry above breakout level.
Targets can reach - 1) 41300 and 2) 43000
STOP LOSS Neckline 39500
Risk reward is very positive.
#long #banknifty @vivek_mashrani @TheBreakOut @Bullandbeartrading @ExtremeVolume @investing @forextidings @vijaythakkar009

AB CAPITAL Has Completed An 8-Month-Old Correction.According to the Elliott wave principle, AB capital has finished the corrective wave ((iv)).
Price carrying on the impulsive wave (v), yet traders shouldn’t take the position without a proper signal.
If the price breaks wave (X) , the price will surely make a new high because it will give evidence of the impulsive move.
Price may take retracement as wave x works as a resistance which can be the best entry for bull traders.
We can see the following targets:
127.70
138.96
151.2
165.9+
Invalidation: breakout of the minor channel.

Nifty Update: The Case Of Initiative And Response Between Bulls Nifty has completed the law of similar action. It has broken the corrective channels and touched the lower band at 16892. Price has faced support on the lower band and responded with demand by touching the upper band.
At this time, the price is out of the downtrend channel.
In my previous idea, I have mentioned that if the price can't break the pivot point, there are high chances of price excess.
Our nearest lower high (LH) is 17403 , which may react as a resistance.
In a nutshell, if nifty breaks the pivot at 17621 , there are higher chances of the trend changing. Before reaching the pivot point, it has to break the resistance line.
Failure will be the cause of excess.

Could Tata motors be the hottest investment for 2021?Price is moving under the consolidation area for 225 days . It has finalized sub-wave (C) of wave ((4)). If price breaks sub-wave 4 of wave (C) of wave ((4)), it is the beginning signal of Wave ((5)).
We can get the following swing trade targets: 340 - 362 - 415
