learn option chain analysis basic to advanceOption chain analysis is a crucial tool for traders, especially in the stock and derivatives markets, to gauge the sentiment of the market, understand price trends, and make informed decisions. Below is a basic to advanced breakdown of option chain analysis:
**Basic Concepts of Option Chain**
An **Option Chain** is a list of all the available options (both calls and puts) for a specific stock or index, usually presented in a table format. It shows the strike prices, expiry dates, open interest, volumes, bid-ask prices, and implied volatility.
#### **Key Components:**
1. **Strike Price**: The price at which the option holder can buy (call) or sell (put) the underlying asset.
2. **Expiry Date**: The date on which the option contract expires. Options can have different expiry dates, typically weekly, monthly, or quarterly.
3. **Open Interest (OI)**: The total number of outstanding contracts (either calls or puts) for a particular strike price. A high OI suggests that there is strong interest in that particular strike price, which can be used to gauge liquidity.
4. **Volume**: The total number of contracts traded during a specific period. Higher volume suggests increased activity and potential price movements.
5. **Bid-Ask Spread**: The difference between the highest price a buyer is willing to pay (bid) and the lowest price a seller is willing to accept (ask). A smaller spread indicates higher liquidity.
6. **Implied Volatility (IV)**: A measure of the market's expectation of future volatility in the stock or index. Higher implied volatility generally leads to higher premiums for options.
---
### **Intermediate Level Analysis**
At this level, we’ll delve into more nuanced indicators that help make sense of how the market is likely to move.
#### **1. Put-Call Open Interest Ratio (PCR)**
- **PCR (Put-Call Ratio)** is a ratio of open interest in put options to that in call options. It is an indicator of market sentiment.
- **PCR > 1**: More puts are being bought, indicating a bearish sentiment.
- **PCR < 1**: More calls are being bought, indicating a bullish sentiment.
- **Neutral Range**: PCR around 0.7 to 1 is considered neutral.
#### **2. Max Pain Theory**
- **Max Pain** refers to the price at which the most number of options (puts and calls combined) will expire worthless, causing the highest amount of pain to option holders. This is a critical level where the option chain suggests a price point that the market may target by expiry.
#### **3. Open Interest and Volume Analysis**
- A **Rising Open Interest** indicates that new positions are being created, either long or short. If the price rises with increasing OI, it suggests that the upward trend may continue.
- **Decreasing Open Interest** with rising prices suggests short covering.
- **Volume Analysis**: If the volume is high on a particular strike price, it suggests that traders are actively taking positions at that strike, which can offer insights into possible support or resistance levels.
#### **4. Implied Volatility Skew**
- The difference in implied volatility across different strike prices or expirations is known as the **IV Skew**. If the implied volatility is higher for out-of-the-money (OTM) calls or puts, it suggests that the market is expecting a potential move in the underlying asset.
---
### **Advanced Level Analysis**
At the advanced level, you would look deeper into the options data and develop a strategy based on more sophisticated patterns and trading signals.
#### **1. Analyzing Unusual Option Activity**
- **Unusual Option Activity** refers to a significant increase in volume and open interest in a specific strike price or expiry date that stands out compared to the historical averages.
- **Bullish Activity**: Large volumes in short-term out-of-the-money calls could indicate a potential breakout.
- **Bearish Activity**: A surge in put options or large purchases of protective puts may indicate an upcoming decline.
#### **2. Options Greeks**
The Greeks are important metrics that help understand the sensitivities of an option’s price relative to changes in market conditions:
- **Delta**: Measures the sensitivity of the option’s price to changes in the underlying asset’s price.
- A **delta of 0.5** means the option price moves 0.5 points for every 1-point change in the stock price.
- **Gamma**: The rate of change of Delta in response to price movements. It measures the acceleration of the option’s price change.
- **Theta**: The rate at which an option’s price decreases as it approaches expiration (time decay). For example, an option with high Theta loses value rapidly as it nears expiry.
- **Vega**: Measures the sensitivity of an option’s price to changes in the volatility of the underlying asset. Higher Vega means the option is more sensitive to volatility changes.
- **Rho**: Measures the sensitivity of an option’s price to changes in interest rates. This is important when market interest rates change or during central bank announcements.
#### **3. Support and Resistance Based on Option Chain Data**
- **Strike Price with High Open Interest**: Strike prices with significant OI often act as **support** (for puts) or **resistance** (for calls). For example, if a lot of open interest is at a certain strike price, the market may try to stay above or below that level by expiry.
- **Max Pain and Pinning**: The stock price may "pin" around a specific strike price (close to max pain) as market makers hedge their positions leading into expiration.
#### **4. Advanced Option Chain Patterns**
- **Bearish/Bullish Divergence**: If the underlying asset is trending higher, but open interest in put options rises significantly, it may indicate an impending reversal or bearish divergence.
- **Long Straddle/Strangle Setup**: This strategy involves buying both a call and put option at the same strike price (straddle) or different strike prices (strangle) when expecting high volatility but unsure of the direction. Option chain analysis helps you find strike prices where this strategy might be profitable.
#### **5. Implied vs. Historical Volatility**
- Comparing **Implied Volatility** (IV) with **Historical Volatility (HV)** can provide insights into whether options are expensive or cheap. If IV is higher than HV, options are overpriced, and if IV is lower than HV, options may be underpriced, signaling potential buying opportunities.
---
### **Putting It All Together**
**Example**: If you're analyzing an option chain for a stock and notice:
- **High OI** in calls at a specific strike price, with the stock trading near that price.
- **PCR (Put-Call Ratio)** is low, indicating bullish sentiment.
- The stock's price is near a **Max Pain point**, and the price has been "pinning" there for a while.
- **Rising Implied Volatility** and increasing **volume** in short-term out-of-the-money calls.
This could suggest the market is expecting a short-term rally or breakout, and you might consider strategies like buying calls or participating in the trend. Conversely, if the PCR is high and unusual activity is happening in puts, you might be prepared for a bearish move.
Conclusion
Option chain analysis is a mix of understanding basic concepts, reading market sentiment, and diving deep into advanced tools. By combining **open interest, volume, implied volatility, options Greeks**, and market sentiment indicators like the **put-call ratio**, you can form a comprehensive view of market dynamics and trade more effective.
Fundamental-analysis

What is adx and how to use it in trading ?The **Average Directional Index (ADX)** is a technical analysis indicator used to measure the strength of a trend in the market, regardless of whether it is an uptrend or a downtrend. It was developed by J. Welles Wilder, who also created other indicators like the Relative Strength Index (RSI). The ADX is part of a system that includes the **+DI (Positive Directional Indicator)** and **-DI (Negative Directional Indicator)**.
### Components of ADX:
1. **ADX Line (main line):** This line measures the strength of the trend, not its direction. ADX values range from 0 to 100:
- **0-25**: Weak trend (trend is not strong or volatile).
- **25-50**: Moderate trend (trend is strong enough to be useful).
- **50-75**: Strong trend (market is trending powerfully).
- **75-100**: Very strong trend (a very strong trending market).
2. **+DI (Positive Directional Indicator):** This measures the strength of the upward price movement.
3. **-DI (Negative Directional Indicator):** This measures the strength of the downward price movement.
### How to Use ADX in Trading:
1. **Trend Strength:**
- **ADX above 25** suggests a strong trend (whether up or down), so traders might look for opportunities to trade with the prevailing trend.
- **ADX below 25** suggests a weak or no trend, meaning the market is choppy and might not be ideal for trend-following strategies.
2. **Trend Direction (using +DI and -DI):**
- When **+DI is above -DI**, it signals a potential **uptrend**, and traders may look to go long (buy).
- When **-DI is above +DI**, it signals a potential **downtrend**, and traders may look to go short (sell).
3. **ADX Crossovers:**
- A common strategy involves watching for crossovers of the **+DI and -DI** lines:
- **+DI crossing above -DI** can signal a buy signal (uptrend).
- **-DI crossing above +DI** can signal a sell signal (downtrend).
4. **ADX Increasing or Decreasing:**
- **Rising ADX** suggests increasing trend strength. This could be a confirmation of a continuing trend.
- **Falling ADX** suggests weakening trend strength. Traders may expect a reversal or consolidation.
### Example Strategy:
- **Strong Trend Strategy:**
1. Look for an ADX reading above 25 (suggesting a strong trend).
2. Check if **+DI is above -DI** (bullish uptrend) or **-DI is above +DI** (bearish downtrend).
3. Trade in the direction of the trend.
- **Trend Reversal Strategy:**
1. ADX reading below 25 (weak trend) suggests potential for range-bound or sideways movement.
2. Wait for the **+DI and -DI lines to cross** and signal a new trend direction.
### Limitations:
- **Late signal**: The ADX does not predict trend reversals or market tops and bottoms. It only identifies the strength of a trend.
- **Lagging indicator**: Since ADX is based on past price action, it tends to lag in signaling the beginning or end of a trend.
### Summary:
- Use **ADX above 25** to confirm strong trends.
- Use **+DI** and **-DI** to identify the direction of the trend.
- Look for crossovers of **+DI and -DI** to signal potential entries or exits.
Do you currently trade with any indicators or systems like ADX?

What is database trading and how it is been done ?**Database trading** refers to the process of buying and selling databases or data-related products, often for financial or commercial purposes. This could involve trading large datasets, data assets, or even the rights to access and use specific data. In financial contexts, it could also refer to trading information or algorithms derived from data for making investment decisions. Here's a breakdown of how database trading works and its typical applications:
### 1. **Types of Database Trading**:
- **Market Data Trading**: Traders can buy and sell real-time or historical market data, which includes stock prices, market indexes, commodity data, etc. This data is used for algorithmic trading, backtesting, and prediction purposes.
- **Data as a Service (DaaS)**: Companies often sell access to databases as a subscription or pay-per-use model. For example, accessing consumer behavior data, demographic information, and financial data.
- **Financial Data**: Financial institutions can trade proprietary datasets, like trading algorithms or high-frequency trading systems. Firms often buy or sell these datasets to improve their trading strategies or decision-making processes.
- **Alternative Data**: Beyond traditional financial data, alternative data (e.g., satellite imagery, social media sentiment, web scraping data) is increasingly used for market analysis and trading. These datasets can be sold or traded among companies that are looking for an edge in their investment strategies.
### 2. **How Database Trading is Done**:
- **Data Acquisition**: Traders or firms acquire valuable datasets from various sources. This can include public data, proprietary data, or data bought from third-party providers.
- **Data Integration & Cleansing**: Before trading data, it’s often cleaned, structured, and integrated into usable formats, especially for algorithmic or quantitative analysis. This step ensures the data is accurate, reliable, and ready for trading.
- **Trading Strategies**: Many trading firms rely on databases to identify patterns or to train machine learning models. For example, a hedge fund might use historical trading data, macroeconomic data, or even social media trends to predict stock price movements. These strategies are often automated using algorithms.
- **Platforms for Data Trading**: There are marketplaces and platforms where traders or businesses can buy or sell data. Examples include Quandl, Xignite, or even specialized marketplaces for alternative data (like Data & Sons, or Snowflake). These platforms allow users to trade data in a secure, streamlined manner.
- **Pricing**: The value of a dataset is based on its uniqueness, accuracy, and potential for generating insights. Some data can be very costly, especially real-time financial data, while others might be more affordable but provide valuable insights for specific use cases.
### 3. **Tools and Technologies**:
- **Big Data Analytics**: Trading systems often leverage big data technologies, such as Hadoop, Spark, or cloud-based solutions like AWS and Google Cloud, to analyze massive datasets and derive insights that inform trading decisions.
- **Machine Learning**: Machine learning algorithms are commonly applied to data sets to find patterns, forecast trends, or make predictions that drive trading strategies.
- **Blockchain**: In some cases, data transactions are executed on blockchain networks, ensuring transparency, security, and traceability in how data is traded.
- **Cloud Computing**: Data storage and processing are often conducted through cloud platforms, allowing for real-time access to large datasets and reducing the need for physical infrastructure.
### 4. **Risks and Challenges**:
- **Data Privacy & Security**: Trading datasets that contain sensitive or personal information might pose security and legal risks. For instance, selling consumer data without proper consent can violate privacy laws (e.g., GDPR, CCPA).
- **Data Quality**: Poor-quality or incomplete data can lead to inaccurate insights or wrong trading decisions. Ensuring the integrity of the data is crucial.
- **Market Oversaturation**: In some cases, large datasets can become commoditized, reducing their value. This can happen when data sources become widely available, or when traders misuse or flood the market with too much data.
In summary, **database trading** is a practice where data, whether it’s financial, market, or alternative data, is bought, sold, or used for trading strategies. It often involves sophisticated technologies and platforms, but it also comes with various risks that need careful management.

what is option chain pcr ?The Put-Call Ratio (PCR) is a popular technical indicator used by investors to assess market sentiment. It is calculated by dividing the volume or open interest of put options by call options over a specific time period. A higher PCR suggests bearish sentiment, while a lower PCR indicates bullish sentiment.
bearish
The Put-Call Ratio (PCR) is a useful indicator to understand the market sentiment at any given time. A high PCR suggests a bearish market, while a low PCR signals bullish tendencies. It helps investors assess whether the market is leaning towards optimism or pessimism, which can shape investment strategies.
A good PCR ratio depends on the market context, but generally, a PCR below 0.7 indicates bullish sentiment (potential market rise), while a PCR above 1.2 suggests bearish sentiment (potential market decline)

what is RSI and how it is useful in technical analysis ?### What is RSI (Relative Strength Index)?
The **Relative Strength Index (RSI)** is a **momentum oscillator** used in technical analysis to measure the **speed and change** of price movements. It was developed by **J. Welles Wilder** and is used to identify overbought and oversold conditions in the market. RSI helps traders assess the strength of a trend, spot potential reversals, and make better trading decisions.
#### **RSI Formula**:
The RSI is calculated using the following formula:
Where:
- **RS (Relative Strength)** = \(\frac{\text{Average Gain}}{\text{Average Loss}}\)
- **Average Gain** is the average of all the gains over a specific period (typically 14 periods).
- **Average Loss** is the average of all the losses over the same period.
The RSI value ranges from 0 to 100 and is plotted as a line that fluctuates between these values.
---
### RSI Values and Interpretation
- **RSI > 70**: **Overbought** condition — This suggests that the asset may be overbought, and the price might be due for a pullback or reversal to the downside.
- **RSI < 30**: **Oversold** condition — This suggests that the asset may be oversold, and the price might be due for a rebound or reversal to the upside.
- **RSI between 30 and 70**: The market is considered to be in a **neutral** or **healthy** trend, with no extreme overbought or oversold conditions.
- **RSI = 50**: This is considered a neutral level, indicating neither overbought nor oversold conditions.
---
### How RSI is Used in Technical Analysis
#### 1. **Spotting Overbought and Oversold Conditions**:
- **Overbought Conditions (RSI > 70)**: When RSI is above 70, it suggests that the asset has been experiencing strong buying pressure. It could be a sign that the price is rising too quickly and might be due for a correction. Traders look for a potential **price reversal** or pullback when RSI is above 70.
- **Example**: If a stock's RSI reaches 80, it may be considered **overbought**, and traders might consider selling or taking profits, anticipating a reversal or correction.
- **Oversold Conditions (RSI < 30)**: When RSI is below 30, it indicates that the asset is under heavy selling pressure. The market could be oversold, and a **rebound** or **reversal to the upside** might be likely.
- **Example**: If a stock’s RSI drops to 20, it suggests that the asset may be **oversold**, and traders may look for potential buying opportunities as the price may be due for a bounce back.
#### 2. **Identifying Divergence**:
RSI is often used to spot **divergence** between the price action and the RSI itself. Divergence can signal potential **trend reversals**.
- **Bullish Divergence**: When the price makes a **lower low**, but the RSI forms a **higher low**, it suggests that the selling momentum is weakening, and the price may be ready to reverse upwards.
- **Bearish Divergence**: When the price makes a **higher high**, but the RSI makes a **lower high**, it suggests that the buying momentum is weakening, and the price may be due for a reversal down.
#### Example of Divergence:
- **Bullish Divergence**: The price of an asset is falling to new lows, but the RSI is showing higher lows. This indicates that although the price is falling, the downward momentum is weakening, signaling a potential upward reversal.
- **Bearish Divergence**: The price is making higher highs, but the RSI is forming lower highs. This indicates that the upward momentum is weakening, suggesting the potential for a price decline.
#### 3. **Trend Confirmation**:
The RSI can also help confirm the strength of a trend. A rising RSI indicates that the asset is in an uptrend, and a falling RSI indicates that the asset is in a downtrend.
- **Strong Uptrend**: If the RSI stays above 40-50 and consistently pushes towards 70 or higher, it confirms that the uptrend is strong.
- **Strong Downtrend**: If the RSI stays below 60 and consistently drops towards 30 or lower, it confirms that the downtrend is strong.
#### 4. **RSI and Trend Reversals**:
RSI can indicate potential **trend reversals** based on its level:
- **Overbought (RSI > 70)**: After the RSI moves into overbought territory, a reversal to the downside is more likely.
- **Oversold (RSI < 30)**: After the RSI moves into oversold territory, a reversal to the upside is more likely.
### Combining RSI with Other Indicators
RSI works well when combined with other technical indicators to confirm signals and improve the reliability of trade setups.
- **RSI + Moving Averages**: A common combination is using RSI with moving averages (e.g., 50-day or 200-day). If the price is above the moving average and the RSI is showing bullish conditions (above 50 or rising), it indicates a strong uptrend.
- **RSI + Support/Resistance Levels**: Combining RSI with key **support and resistance** levels can increase the accuracy of predicting price reversals. For example, if the price is approaching a support level while the RSI is showing oversold conditions, it increases the likelihood of a price bounce.
---
### RSI Trading Strategies
#### 1. **Overbought/Oversold Reversals**
- **Buy Signal**: When RSI drops below 30 (oversold) and then rises back above 30, this can signal a buying opportunity.
- **Sell Signal**: When RSI rises above 70 (overbought) and then falls back below 70, it can signal a selling opportunity.
#### 2. **Divergence Reversals**
- **Bullish Divergence**: If the price makes lower lows but the RSI makes higher lows, this is a bullish reversal signal.
- **Bearish Divergence**: If the price makes higher highs but the RSI makes lower highs, this is a bearish reversal signal.
#### 3. **RSI Trend Strategy**
- If the RSI remains consistently above 50 or 60 during an uptrend, it can indicate that the trend is strong, and buying is favored.
- If the RSI remains consistently below 50 during a downtrend, it indicates that the trend is strong, and selling or shorting is favored.
---
### Example of RSI in Action
Let’s say you are analyzing a stock, XYZ:
- The current price is **$100**, and the **RSI** is at **80**. The RSI value indicates that the stock is **overbought**, suggesting that it might experience a pullback.
- You wait for the RSI to fall below **70**, signaling that the price has cooled off a bit. If it drops to **60** and starts showing signs of strength, you might enter a **long position** as a potential **buy signal**.
Alternatively:
- If XYZ is trading at **$80**, and the RSI is at **20**, it signals that the stock might be **oversold**. If the RSI starts moving back above **30**, this can be considered a **buy signal** in anticipation of a price reversal.
---
### Pros and Cons of RSI
#### **Pros**:
1. **Simple and Effective**: RSI is easy to understand and use, making it a valuable tool for both beginners and experienced traders.
2. **Helps Identify Trend Reversals**: It can give early warnings of overbought and oversold conditions, helping you spot potential trend reversals.
3. **Works Across Time Frames**: RSI can be used on any time frame, making it versatile for different trading styles (day trading, swing trading, long-term investing).
4. **Widely Available**: RSI is available on almost all trading platforms and charting tools.
#### **Cons**:
1. **False Signals in Strong Trends**: RSI can remain overbought or oversold for long periods during strong trends, which might lead to premature reversal signals.
2. **Lagging Indicator**: Like most indicators, RSI is not predictive and often confirms price movements after they occur.
3. **Not Effective Alone**: RSI is best used in conjunction with other indicators (like trend lines, moving averages, or support/resistance levels) for better accuracy.
---
### Conclusion
The **RSI (Relative Strength Index)** is an essential momentum oscillator that helps traders identify overbought and oversold conditions, trend strength, and potential trend reversals. By analyzing RSI levels (e.g., above 70 for overbought and below 30 for oversold), divergence patterns, and trend confirmation, traders can improve their decision-making process.
While RSI is a powerful tool, it is important to use it alongside other technical indicators to enhance trading accuracy and minimize the risk of false signals.

what is divergence based trading ?### What is Divergence-Based Trading?
**Divergence-based trading** is a trading strategy used to identify potential reversals in the market by analyzing the relationship between the price of an asset and a technical indicator, such as the **Relative Strength Index (RSI)**, **Moving Average Convergence Divergence (MACD)**, or **Stochastic Oscillator**.
Divergence occurs when the price of an asset and the indicator show opposing signals. This can indicate a weakening trend or potential reversal, signaling to traders that the market may soon change direction. Divergence can help traders spot trend exhaustion and new entry points for trades.
### Types of Divergence
1. **Regular Divergence** (also called **Classic Divergence**): This is typically used to identify potential trend reversals.
- **Bullish Divergence**: Occurs when the price makes a **lower low**, but the indicator forms a **higher low**. This suggests that while the price is falling, the momentum is weakening, and a reversal to the upside may occur.
- **Bearish Divergence**: Occurs when the price makes a **higher high**, but the indicator forms a **lower high**. This suggests that while the price is rising, the momentum is weakening, and a reversal to the downside may occur.
2. **Hidden Divergence**: This is often used to spot potential trend continuation.
- **Bullish Hidden Divergence**: Occurs when the price forms a **higher low**, but the indicator forms a **lower low**. This signals that the trend is likely to continue upwards despite a brief pullback.
- **Bearish Hidden Divergence**: Occurs when the price forms a **lower high**, but the indicator forms a **higher high**. This signals that the trend is likely to continue downwards despite a brief rally.
---
### How Divergence-Based Trading Works
To trade using divergence, traders typically follow these steps:
1. **Identify the Trend**: First, identify the prevailing trend of the market (whether it’s up, down, or neutral).
2. **Use a Technical Indicator**: Choose a momentum-based indicator like **RSI**, **MACD**, or **Stochastic Oscillator** to compare against the price.
3. **Look for Divergence**: Analyze the price action and the indicator:
- If the price makes a new high or low but the indicator does not confirm the same, it signals divergence.
4. **Confirm the Divergence**: Once divergence is spotted, look for additional signals or confirmations, such as:
- **Candlestick patterns** (e.g., reversal patterns like engulfing candles or doji)
- **Volume patterns** (e.g., declining volume on a price move could suggest weakening momentum)
- **Breakout levels** (e.g., a break of trendline or support/resistance)
5. **Execute the Trade**: Once you have confirmation, you can enter the trade in the direction of the reversal (for regular divergence) or in the direction of the trend continuation (for hidden divergence).
---
### How to Use Divergence-Based Trading with Popular Indicators
#### 1. **RSI (Relative Strength Index) Divergence**:
The RSI is a momentum oscillator that ranges from 0 to 100, measuring whether an asset is overbought or oversold.
- **Bullish Divergence**: When the price makes a lower low but the RSI forms a higher low, it suggests that selling pressure is weakening and a reversal to the upside might occur.
- **Bearish Divergence**: When the price makes a higher high but the RSI forms a lower high, it suggests that buying pressure is weakening and a reversal to the downside might occur.
#### Example of RSI Divergence:
- **Price Action**: The price of stock XYZ makes a lower low.
- **RSI Action**: The RSI forms a higher low.
- **Interpretation**: This is a **bullish divergence**, indicating that despite the price continuing to fall, momentum is weakening, and a price reversal could occur.
#### 2. **MACD (Moving Average Convergence Divergence) Divergence**:
MACD is a trend-following momentum indicator that shows the relationship between two moving averages of an asset's price.
- **Bullish Divergence**: When the price makes a lower low, but the MACD forms a higher low, it signals weakening downward momentum and suggests a potential upward reversal.
- **Bearish Divergence**: When the price makes a higher high, but the MACD forms a lower high, it signals weakening upward momentum and suggests a potential downward reversal.
#### Example of MACD Divergence:
- **Price Action**: The price of stock ABC makes a higher high.
- **MACD Action**: The MACD makes a lower high.
- **Interpretation**: This is a **bearish divergence**, indicating that despite the price rising, the momentum is weakening, and a price reversal to the downside could happen.
#### 3. **Stochastic Oscillator Divergence**:
The Stochastic Oscillator is another momentum indicator that compares a particular closing price to a range of prices over a certain period of time.
- **Bullish Divergence**: When the price makes a lower low, but the Stochastic Oscillator forms a higher low, it indicates weakening bearish momentum and suggests a reversal to the upside.
- **Bearish Divergence**: When the price makes a higher high, but the Stochastic Oscillator forms a lower high, it indicates weakening bullish momentum and suggests a reversal to the downside.
---
### Examples of Divergence in Action
#### Example 1: **Bullish Divergence (Price makes lower lows, but the RSI makes higher lows)**
- **Scenario**: The stock price of XYZ drops to a new low, but the RSI forms a higher low. This suggests that selling momentum is losing steam, and the price may soon reverse to the upside. A trader could then consider entering a long position.
#### Example 2: **Bearish Divergence (Price makes higher highs, but the MACD makes lower highs)**
- **Scenario**: Stock ABC rises to a new high, but the MACD is showing a lower high. This suggests weakening bullish momentum, and a reversal to the downside is more likely. A trader could look for a short entry.
#### Example 3: **Hidden Bullish Divergence (Price forms higher lows, but RSI forms lower lows)**
- **Scenario**: Stock XYZ forms higher lows in price, but the RSI shows a lower low. This suggests that the uptrend will likely continue despite a minor pullback. A trader may enter a long position in the direction of the trend.
#### Example 4: **Hidden Bearish Divergence (Price forms lower highs, but MACD forms higher highs)**
- **Scenario**: Stock ABC forms lower highs in price, but the MACD shows higher highs. This suggests that the downtrend will likely continue despite a minor rally. A trader may enter a short position in the direction of the trend.
---
### Pros and Cons of Divergence-Based Trading
#### **Pros**:
1. **Trend Reversal Indicators**: Divergence is a powerful tool for spotting trend reversals before they happen.
2. **Helps Find Entry/Exit Points**: It can help identify optimal points to enter or exit a position, especially when combined with other indicators or chart patterns.
3. **Versatile**: Can be used across various time frames (day trading, swing trading, long-term investing).
#### **Cons**:
1. **False Signals**: Divergence can sometimes give false signals, especially in volatile markets, leading to a reversal that doesn’t occur.
2. **Requires Confirmation**: Divergence is more reliable when confirmed by other indicators or chart patterns. It is not always enough to act on divergence alone.
3. **Lagging Indicator**: Divergence often comes after a price move, so the reversal may not happen immediately.
---
### Conclusion
**Divergence-based trading** is a valuable strategy for identifying potential trend reversals. By comparing price action to technical indicators like **RSI**, **MACD**, and **Stochastic Oscillator**, traders can identify situations where the momentum behind a trend is weakening and prepare for a possible reversal.
To use divergence effectively:
- Understand the difference between **regular** and **hidden** divergence.
- Combine divergence signals with other technical analysis tools (e.g., candlestick patterns, trendlines) to increase reliability.
- Always manage risk through proper stop-loss and position sizing, as divergence-based signals can sometimes give false signals.

WHat is option chain and how to use it ?What is an Option Chain?
An **Option Chain** is a list of all the available **options contracts** (both calls and puts) for a specific underlying asset, like a stock, index, or commodity. It provides detailed information about the various strike prices, expiration dates, and other vital data that traders use to make informed decisions.
The **Option Chain** helps you track options for a particular asset (e.g., a stock) and provides data such as:
- **Strike Price**: The price at which the underlying asset can be bought or sold when the option is exercised.
- **Call Options**: Options that give the buyer the right to **buy** the underlying asset at the strike price.
- **Put Options**: Options that give the buyer the right to **sell** the underlying asset at the strike price.
- **Expiration Date**: The date on which the option expires.
- **Open Interest (OI)**: The total number of outstanding contracts that have not been exercised or closed.
- **Volume**: The number of contracts traded on that day.
- **Implied Volatility (IV)**: The expected volatility of the underlying asset.
- **Bid and Ask Price**: The buying and selling prices for the options contracts.
- **Premium**: The price you pay to buy an option.
---
### How to Read an Option Chain
Here’s an example of an Option Chain:
| Strike Price | Call Bid | Call Ask | Call Volume | Put Bid | Put Ask | Put Volume | OI (Open Interest) | IV (Implied Volatility) |
|--------------|----------|----------|-------------|---------|---------|------------|--------------------|-------------------------|
| 100 | 2.50 | 2.80 | 500 | 1.20 | 1.50 | 300 | 10,000 | 20% |
| 110 | 1.10 | 1.30 | 400 | 3.00 | 3.30 | 350 | 8,000 | 18% |
| 120 | 0.60 | 0.80 | 250 | 5.10 | 5.30 | 200 | 6,500 | 22% |
#### Key Columns:
- **Strike Price**: The price at which the underlying asset can be bought or sold.
- **Call/Put Bid/Ask**: The prices at which traders are willing to buy (bid) or sell (ask) the options.
- **Call/Put Volume**: The number of contracts traded for that specific strike price.
- **Open Interest (OI)**: Total open contracts that are currently active, indicating market interest in those strike prices.
- **Implied Volatility (IV)**: A measure of the expected future volatility of the underlying asset, which affects option pricing.
---
### How to Use an Option Chain in Trading
An Option Chain is a valuable tool for traders because it provides a comprehensive view of the options market and can help you make more informed decisions. Here's how to use it effectively:
---
#### 1. **Identifying Support and Resistance**
- **Open Interest**: Look for strike prices with the highest open interest (OI) in both calls and puts. High OI levels often represent key support and resistance levels. If a stock is trending upward and you see large open interest at a particular strike price on calls, that could act as **resistance**. Conversely, large OI on put options can act as **support** if the price is trending down.
- **Volume**: High volume near certain strike prices shows where market participants are most active and might be important levels for price movement.
#### 2. **Market Sentiment Analysis (PCR)**
- Use the **Put-Call Ratio (PCR)** derived from the option chain to understand market sentiment. A high PCR (more puts than calls) suggests bearish sentiment, while a low PCR indicates bullish sentiment.
- A **high PCR** can sometimes indicate an **overbought or oversold** market, especially when the ratio is unusually high, suggesting a potential reversal.
#### 3. **Price Prediction with Implied Volatility (IV)**
- **Implied Volatility (IV)** is a critical metric found in the Option Chain. If the IV is high, it means traders are expecting high price movements (volatility) in the underlying asset. Conversely, low IV suggests low expected movement. If you expect a big move, you might want to buy options. If IV is high and you expect little movement, you might want to sell options to take advantage of the higher premium.
#### 4. **Assessing Liquidity**
- **Bid-Ask Spread**: Look at the difference between the **bid** and **ask** price of the options. A narrow spread means there’s good liquidity, making it easier to enter and exit positions. A wide bid-ask spread may indicate low liquidity, which could make trading more expensive.
#### 5. **Choosing the Right Strike Price**
- Use the option chain to choose a **strike price** that fits your trading strategy:
- If you're expecting a **small move**, you might prefer an option with a **strike price close to the current price** (ATM – At the Money).
- For a **larger move**, you might choose **out-of-the-money (OTM)** options (with strike prices further away from the current price) for cheaper premiums and larger potential profits.
- **In-the-money (ITM)** options will have intrinsic value and are typically more expensive, but they are safer if you expect the asset to move in the desired direction.
#### 6. **Volume and Open Interest**
- **Volume** indicates the number of contracts traded in a given time period (usually a day), helping you gauge the level of interest in a specific option contract.
- **Open Interest** refers to the number of contracts that have not been closed or exercised. High OI means more contracts are open, which can indicate a stronger trend or sentiment toward that strike price.
---
### Practical Example of Using the Option Chain
Let’s say you’re looking at a stock, XYZ, which is currently trading at $100. You open its Option Chain and see the following:
| Strike Price | Call Bid | Call Ask | Call Volume | Put Bid | Put Ask | Put Volume | OI (Open Interest) | IV (Implied Volatility) |
|--------------|----------|----------|-------------|---------|---------|------------|--------------------|-------------------------|
| 95 | 5.00 | 5.20 | 1,500 | 1.10 | 1.30 | 1,000 | 10,000 | 20% |
| 100 | 3.50 | 3.70 | 2,000 | 2.00 | 2.20 | 1,500 | 15,000 | 22% |
| 105 | 1.80 | 2.00 | 1,200 | 4.00 | 4.20 | 1,200 | 12,000 | 25% |
- **Strike Price 100 (ATM)**: Both the call and put options at this strike price have high volume and open interest. The implied volatility (IV) is also moderate at 22%, suggesting moderate price movement expectations. Traders may expect XYZ to stay around this level.
- **Strike Price 95 (ITM)**: The call option at 95 is priced higher due to the stock being close to or above this price. It has high open interest, suggesting it could act as a strong **support** level for the stock.
- **Strike Price 105 (OTM)**: The put options here have higher IV (25%) and a significant price difference from the underlying asset. This could indicate expectations of a potential downturn if the price falls, but the probability of profit is lower due to it being out-of-the-money.
Conclusion
An **Option Chain** is an invaluable tool for options traders, as it helps assess various factors, such as liquidity, market sentiment, volatility, and potential price movements. By studying the option chain carefully, you can:
- Identify key levels of support and resistance
- Analyze the market sentiment through the put-call ratio (PCR)
- Make better decisions regarding which strike prices and expiration dates to choose
- Gauge the liquidity and volatility expectations for options contracts

what is pcr and how to use it in trading ?### What is PCR (Put-Call Ratio)?
The **Put-Call Ratio (PCR)** is a popular market sentiment indicator used in options trading. It is calculated by dividing the total open interest (OI) of **puts** by the total open interest of **calls**. It helps traders understand whether the market sentiment is bullish, bearish, or neutral, based on the relative buying activity in put and call options.
#### **Formula**:
\
- **Put options**: Give the right to sell an asset at a specified price within a set time frame.
- **Call options**: Give the right to buy an asset at a specified price within a set time frame.
### How to Interpret PCR?
1. **PCR > 1**: This suggests there are more puts than calls. It generally indicates **bearish** sentiment, meaning traders expect the market to go down. A high PCR can signal that traders are hedging against a market decline or speculating that the market will drop.
2. **PCR < 1**: This suggests there are more calls than puts, which typically indicates **bullish** sentiment. Traders are expecting the market to rise, as there is more demand for buying options (calls) than for selling options (puts).
3. **PCR = 1**: This suggests a neutral market sentiment, where the number of put and call options is the same. The market could be in a balanced state with no strong bias in either direction.
4. **Extremely High PCR**: If the PCR value is very high (e.g., 1.5 or above), it could indicate that the market is **overly bearish**, and a market reversal might be imminent. This can signal a potential buying opportunity.
5. **Extremely Low PCR**: If the PCR is very low (e.g., below 0.5), it could indicate that the market is **overly bullish**, and there may be a correction or pullback ahead.
---
### How to Use PCR in Trading
#### 1. **Sentiment Indicator**:
- **Bullish Signal**: If the PCR is low (e.g., below 0.5), it indicates that more traders are betting on a market rise (via calls). It’s often used as a signal that the market might be in an overbought condition and could correct soon.
- **Bearish Signal**: If the PCR is high (e.g., above 1), it suggests that more traders are betting on a market decline (via puts). This could indicate an oversold market and a potential for a rebound or upward movement in the market.
#### 2. **Contrarian Indicator**:
- **Extremely High PCR**: When the PCR rises too much (indicating too many put options), it could mean the market is too bearish, and a **contrarian approach** might be useful. Traders might interpret this as a signal that the market is oversold and due for a reversal.
- **Extremely Low PCR**: When the PCR falls too low (indicating too many call options), it may signal over-optimism in the market, which could be a warning that a **correction** is coming soon.
#### 3. **Confirmation Tool**:
- **Use with other indicators**: PCR alone should not be relied upon for making trading decisions. It works best when combined with other technical or fundamental analysis indicators (e.g., moving averages, RSI, MACD). For instance, if you see a high PCR and the market is oversold according to technical indicators, it could confirm that a reversal is likely.
#### 4. **Market Extremes**:
- **Overbought/Oversold Conditions**: A **very low PCR** (more call buying than put buying) suggests market optimism and can be seen as overbought. A **very high PCR** suggests market pessimism and can be seen as oversold. In these cases, a reversal or a price correction could be expected.
#### Example of Trading Strategy Using PCR:
- **Bullish Setup**: PCR rises significantly, signaling excessive bearish sentiment. Technical indicators show oversold conditions (e.g., RSI below 30). You could consider buying calls or entering long positions with a higher probability of a market reversal.
- **Bearish Setup**: PCR is low, indicating excessive bullish sentiment, while technical indicators like RSI suggest the market is overbought. You could consider selling calls, buying puts, or entering short positions in anticipation of a market correction.
### Example of PCR Calculation:
Let’s say you are analyzing a stock option market:
- Total Open Interest in Puts = 200,000 contracts
- Total Open Interest in Calls = 500,000 contracts
PCR would be:
\
This low PCR (below 1) indicates a **bullish** sentiment in the market, with more traders expecting the market to rise.
---
### Key Points to Remember:
- **PCR is a sentiment tool**, not a direct price predictor.
- A **PCR above 1** typically indicates **bearish** sentiment, while **below 1** indicates **bullish** sentiment.
- An **extremely high or low PCR** might suggest market **extremes**, potentially indicating an upcoming reversal.
- **Use PCR in combination** with other technical and fundamental indicators to enhance decision-making.
In short, PCR provides a snapshot of market sentiment, and when used correctly, it can help traders make better-informed decisions, especially for understanding broader market trends or finding contrarian trading opportunities.

learn fundamental analysis basic to advancelearn Fundamental Analysis from **basic to advanced**:
---
### **1. Basic Concepts of Fundamental Analysis**
#### a. **What is Fundamental Analysis?**
Fundamental analysis is the process of evaluating a company's financial health, industry position, and the overall economy to determine the true value of a stock or other financial asset.
#### b. **Key Areas of FA:**
- **Macroeconomic Factors**: Interest rates, inflation, GDP growth, unemployment, and fiscal policies.
- **Industry Analysis**: Understanding the sector in which the company operates and how it affects the company’s performance.
- **Company Analysis**: Evaluating a company’s financial health through its financial statements, management, competitive position, and future prospects.
#### c. **Key Financial Statements:**
- **Income Statement**: Shows profitability over a period (Revenue, Costs, Profit).
- **Balance Sheet**: Provides a snapshot of a company’s assets, liabilities, and equity.
- **Cash Flow Statement**: Details the inflows and outflows of cash, indicating the company’s liquidity.
---
### **2. Intermediate Level: Ratios & Metrics**
#### a. **Earnings Metrics:**
- **Earnings Per Share (EPS)**: Measures a company’s profitability on a per-share basis.
\
- **Price to Earnings Ratio (P/E)**: Compares the stock price to the company's earnings. A higher P/E might indicate overvaluation or growth prospects.
\
#### b. **Profitability Ratios:**
- **Return on Equity (ROE)**: Measures a company’s ability to generate profit from its shareholders’ equity.
\
- **Return on Assets (ROA)**: Indicates how efficiently a company uses its assets to generate profit.
\
#### c. **Liquidity Ratios:**
- **Current Ratio**: Measures a company’s ability to pay short-term liabilities with its short-term assets.
\
- **Quick Ratio**: A more stringent test of liquidity (excludes inventory).
\
#### d. **Debt Ratios:**
- **Debt to Equity Ratio**: Measures a company's financial leverage.
\
- **Interest Coverage Ratio**: Indicates how easily a company can pay interest on its debt.
\
---
### **3. Advanced Level: In-depth Analysis Techniques**
#### a. **Discounted Cash Flow (DCF) Analysis**
DCF is a valuation method used to estimate the value of an investment based on its future cash flows, adjusted for time value.
- **Formula**:
\
where:
- \( \text{CF}_t \) = Cash Flow in year t
- \( r \) = Discount rate (often WACC)
- \( t \) = Time period
#### b. **Economic Indicators**:
- **GDP Growth**: Indicates the health of the economy and consumer spending power.
- **Inflation**: Impacts purchasing power and can affect interest rates.
- **Unemployment Rate**: High unemployment can indicate economic weakness, affecting company performance.
#### c. **Dividend Discount Model (DDM)**:
Used to value companies based on the present value of their future dividend payments.
- **Formula**:
\
where:
- \( D_1 \) = Dividend in the next period
- \( r \) = Required rate of return
- \( g \) = Dividend growth rate
#### d. **Economic Moats**:
A company’s competitive advantage that protects it from competition and allows it to maintain profits over time. Common moats include:
- **Brand Recognition**: Brands like Apple and Coca-Cola.
- **Cost Advantages**: Efficient production methods or economies of scale.
- **Network Effects**: Platforms like Facebook or eBay where more users make the service more valuable.
---
### **4. Sector-Specific Analysis**
#### a. **Tech Sector**: Look for growth potential, intellectual property, R&D, and scalability.
#### b. **Consumer Goods**: Focus on brand strength, market share, and economic cycles.
#### c. **Financial Sector**: Analyze loan growth, interest rate sensitivity, and regulatory environment.
---
### **5. Risk Analysis and Management**
#### a. **Beta**: Measures the volatility of a stock in comparison to the market. A beta of 1 means it moves in line with the market.
#### b. **Country Risk**: Political and economic stability of the country in which the company operates.
---
### **6. Real-World Applications of Fundamental Analysis**
#### a. **Stock Selection**: Using financial ratios and valuation models (like DCF) to choose stocks that are undervalued.
#### b. **Portfolio Diversification**: Combining assets from different sectors and industries to reduce risk.
#### c. **Long-term Investing**: Based on solid fundamentals like growth prospects, stable cash flow, and profitability.
---
### **Books and Resources to Learn FA**
- **“The Intelligent Investor” by Benjamin Graham** – The classic on value investing.
- **“Common Stocks and Uncommon Profits” by Philip Fisher** – A great book for understanding qualitative analysis.
- **“Financial Statement Analysis and Security Valuation” by Stephen Penman** – A detailed guide to company analysis.
- **Online Courses**: Coursera, Udemy, or edX have comprehensive courses on financial analysis.
---
### Conclusion
Mastering Fundamental Analysis requires a blend of theoretical knowledge, practical experience, and continuous learning. Start by learning the key ratios and financial statements, and then progress to advanced valuation techniques like DCF and economic moats. Always stay updated on the macroeconomic environment, as it plays a crucial role in shaping the performance of individual companies.

what is option chain pcr ?The **Option Chain PCR (Put-Call Ratio)** is a ratio used by traders and analysts to gauge market sentiment and potential price direction. It is calculated by dividing the total open interest (OI) of **puts** by the total open interest of **calls** in a particular market or stock.
### Formula for PCR:
\
### What does PCR indicate?
- **PCR > 1**: This suggests that there are more open interest in puts than calls, which is generally considered a **bearish** signal, indicating that traders expect the price to decline.
- **PCR < 1**: This suggests that there are more open interest in calls than puts, which is generally considered a **bullish** signal, indicating that traders expect the price to rise.
- **PCR = 1**: This indicates an **equilibrium** where the market is neutral, with an equal amount of calls and puts.
### How it's used:
- **Sentiment Indicator**: Traders use the PCR to determine the overall sentiment of the market. A rising PCR might suggest that there is growing bearish sentiment, while a declining PCR might suggest increasing bullish sentiment.
- **Market Extremes**: When the PCR becomes too extreme (either very high or very low), it could signal a reversal, indicating that the market might be overbought or oversold.
### Example:
If the open interest for put options in a stock is 100,000 contracts and for call options is 200,000 contracts, the PCR would be:
\
This would typically indicate a **bullish sentiment**, as more traders are interested in calls than puts.

what is price action and how to use it ?Price action in option trading refers to the analysis of recent price movements and historical data to identify patterns and trends that can inform trading decisions. This analysis can involve various technical indicators such as charts, trend lines, price bands, support and resistance levels, and more.
Price action traders can follow the sequence of highs and lows strategy to map out emerging trends in their market. For example, if a price is trading at higher highs and higher lows, this indicates that it's on an upward trend. If it's trading at lower highs and lows, it's trending downwards.
Trendlines: Used to identify and confirm directional trends in the charted price movement of financial markets / assets. ...
Support and resistance lines: ...
Chart patterns: ...
Candlestick and bar chart patterns: ...
Fibonacci retracements and extensions: ...
Elliot Wave theory:

what is support and resistance and how to use it ?The support and resistance (S&R) are specific price points on a chart expected to attract the maximum amount of either buying or selling. The support price is a price at which one can expect more buyers than sellers. Likewise, the resistance price is a price at which one can expect more sellers than buyers.
Using Support and Resistance After a Breakout
Old Resistance Becomes New Support – If the price breaks above resistance, that resistance level may now act as support.
Old Support Becomes New Resistance – If the price breaks below support, that support level may now act as resistance
Support is a price point which is below the current market price and indicates buying interest. Resistance is the price point which is above the current market price and indicates selling interest. Support and resistance are used to identify the targets for the trade
Support and resistance levels are important points in time where the forces of supply and demand meet. These support and resistance levels are seen by technical analysts as crucial when determining market psychology and supply and demand.

Banswara Syntex Ltd.Banswara Syntex Ltd. (NSE: BANSWRAS) is currently exhibiting a **Neutral** technical outlook on the monthly timeframe.
**Technical Indicators:**
- **Relative Strength Index (RSI):** The 14-day RSI stands at 53.81, indicating a neutral market sentiment. citeturn0search5
- **Moving Averages:** The stock is trading below its 50-day simple moving average (SMA) of ₹144.23 and above its 50-day exponential moving average (EMA) of ₹139.63, suggesting a mixed trend. citeturn0search5
- **MACD (Moving Average Convergence Divergence):** The MACD value is -2.43, which is below the signal line, indicating a bearish momentum. citeturn0search5
- **Stochastic Oscillator:** The Stochastic Oscillator is at 68.59, suggesting a neutral market condition. citeturn0search5
**Support and Resistance Levels:**
- **Support:** The stock has support at ₹127.62. citeturn0search5
- **Resistance:** The resistance level is at ₹137.67. citeturn0search5
**Conclusion:**
Banswara Syntex Ltd. is currently in a neutral technical position on the monthly timeframe, with indicators suggesting neither strong bullish nor bearish momentum. Investors should monitor these indicators closely, as a breakout above resistance levels could signal a bullish trend, while a drop below support levels might indicate a bearish move. It's advisable to consider these technical factors alongside fundamental analysis and broader market conditions when making investment decisions.

#bls international #BLS PERFECT REVERSAL CANDIDATE
BLS International Services Ltd. (NSE: BLS) is currently exhibiting a **Neutral** technical outlook, with indicators suggesting neither strong bullish nor bearish momentum.
**Technical Indicators:**
- **Relative Strength Index (RSI):** The 14-day RSI stands at 35.13, indicating a neutral market sentiment. citeturn0search4
- **Moving Averages:** The stock is trading below its 5-day, 10-day, 20-day, and 50-day simple and exponential moving averages, suggesting a bearish trend. citeturn0search4
- **MACD (Moving Average Convergence Divergence):** The MACD value is -10.94, which is below the signal line, indicating a bearish momentum. citeturn0search4
- **Stochastic Oscillator:** The Stochastic Oscillator is at 16.70, suggesting a buy signal. citeturn0search4
**Support and Resistance Levels:**
- **Support:** The stock has support at ₹389.87. citeturn0search4
- **Resistance:** The resistance level is at ₹448.87. citeturn0search4
**Conclusion:**
BLS International Services Ltd. is currently in a neutral technical position, with indicators suggesting neither strong bullish nor bearish momentum. Investors should monitor these indicators closely, as a breakout above resistance levels could signal a bullish trend, while a drop below support levels might indicate a bearish move. It's advisable to consider these technical factors alongside fundamental analysis and broader market conditions when making investment decisions.

Crisil Ltd.CRISIL Ltd. (NSE: CRISIL) is currently exhibiting a **Neutral** technical outlook, as indicated by various technical analysis indicators.
**Technical Indicators:**
- **Relative Strength Index (RSI):** The 14-day RSI stands at 38.43, suggesting a neutral market sentiment. citeturn0search3
- **Moving Averages:** The stock is trading below its 5-day, 10-day, 20-day, and 50-day simple and exponential moving averages, indicating a bearish trend. citeturn0search3
- **MACD (Moving Average Convergence Divergence):** The MACD value is -124.85, which is below the signal line, suggesting a bearish momentum. citeturn0search3
- **Stochastic Oscillator:** The Stochastic Oscillator is at 38.63, indicating a neutral market condition. citeturn0search3
**Support and Resistance Levels:**
- **Support:** The stock has support at ₹4,996.55. citeturn0search3
- **Resistance:** The resistance level is at ₹5,455.40. citeturn0search3
**Conclusion:**
CRISIL Ltd. is currently in a neutral technical position, with indicators suggesting neither strong bullish nor bearish momentum. Investors should monitor these indicators closely, as a breakout above resistance levels could signal a bullish trend, while a drop below support levels might indicate a bearish move. It's advisable to consider these technical factors alongside fundamental analysis and broader market conditions when making investment decisions.

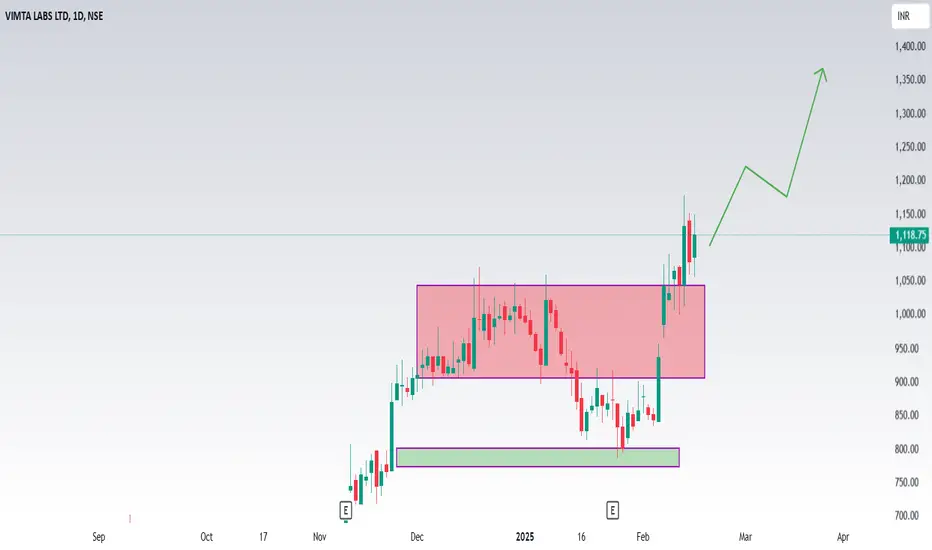
Vimta labs ltdShould I buy VIMTA LABS LTD stock? Our technical rating for VIMTA LABS LTD is buy today. Note that market conditions change all the time — according to our 1 week rating the strong buy trend is prevailing, and 1 month rating shows the strong buy signal.
Vimta Labs Ltd. (NSE: VIMTALABS) is currently exhibiting a strong bullish trend, as indicated by various technical analysis indicators.
**Technical Indicators:**
- **Moving Averages:** All moving averages (5, 10, 20, 50, 100, and 200 periods) are signaling a 'Buy' or 'Strong Buy' position, suggesting sustained upward momentum. citeturn0search2
- **Relative Strength Index (RSI):** The 14-day RSI stands at 89.33, indicating that the stock is in the overbought territory. While this suggests strong momentum, it also implies a potential for price correction. citeturn0search2
- **MACD (Moving Average Convergence Divergence):** The MACD is above the signal line, reinforcing the bullish trend. citeturn0search2
- **Stochastic Oscillator:** The Stochastic Oscillator is in the overbought zone, which may indicate a potential for price pullback. citeturn0search2
**Support and Resistance Levels:**
- **Support:** The stock has support at ₹560. citeturn0search3
- **Resistance:** The resistance level is at ₹1,020. citeturn0search3
**Volume Analysis:**
The stock has experienced high trading volumes at price peaks and lower volumes at price troughs, indicating that price movements are supported by significant trading activity. citeturn0search3
**Conclusion:**
While Vimta Labs Ltd. is currently in a strong bullish phase, the overbought conditions suggested by the RSI and Stochastic Oscillator warrant caution. Investors should monitor these indicators closely, as a price correction could occur if the stock remains in the overbought zone. It's advisable to consider these technical factors alongside fundamental analysis and broader market conditions when making investment decisions.
#Kpittech#KPITTECH DOJI CANDLE FORMED, READY TO BLAST
TARGET - 1440
ENTRY - 1340;
STOP LOSS 1310
TIME FRAME - MONTHLY
TECHNICALS - BULLISH
THIS IS NOT ANY FINANCIAL ADVISE
Is KPITTECH a good stock to buy?
From a risk-reward perspective, KPIT Technologies presents an attractive buying opportunity at current levels. The stock has the potential to move toward the Rs 1,580–Rs 1,620 range in the short term. However, a decisive break below the Rs 1,300 support level would negate this view."

basic to advanced technical analysis ?What is Advanced Technical Analysis? Advanced technical analysis usually involves using either multiple technical indicators or a rather sophisticated (i.e., complex) indicator. “Sophisticated” does not necessarily mean “better” – it just means more difficult to calculate than, say, an arithmetic average.
Technical analysis seeks to predict price movements by examining historical data, mainly price and volume. It helps traders and investors navigate the gap between intrinsic value and market price by leveraging techniques like statistical analysis and behavioral economics
What are the four 4 basic principles of technical analysis?
The core principles of technical analysis in relation to the stock market are that prices discount all known information, reflect the psychology of market participants in the form of fluctuating prices, move in trends, and tend to repeat in historically identifiable patterns

What is adx use in technical analysis ?The ADX quantifies trend strength by measuring directional movement over a given time frame. It provides traders with specific numbers (from 0 to 100) that represent strong or weak price trends. Traders can simply refer to the numbers to quickly assess the strength of a trend.
Traders could utilise the ADX to help them determine entry or exit points for a trade. The ADX could be used to identify potential overbought or oversold levels in the market.
Key takeaways. Average directional index (ADX) is a short-term chart indicator. It can be used to help you evaluate the market or an investment's strength. ADX currently suggests the short-term momentum behind stocks may be strong, with a caveat.

What is swing trading and how to do it ?Swing trading is a stock investment strategy where profits are made over several days or weeks. Swing traders analyze stock price patterns to anticipate when prices will rise, allowing them to buy low, and when prices will fall, enabling them to sell high.
The simplest and most effective way to protect your equity through risk management is to establish strict loss parameters and abide by them. One popular method is the 2% Rule, which means you never put more than 2% of your account equity at risk
The 3 5 7 rule is a risk management strategy in trading that emphasizes limiting risk on each individual trade to 3% of the trading capital, keeping overall exposure to 5% across all trades, and ensuring that winning trades yield at least 7% more profit than losing trades.

what is breakout and retest ?The break and retest strategy involves identifying a breakout of a key support or resistance level and then waiting for the price to return to that level. Traders use this retest as a confirmation to enter the market, aiming to follow the new trend with reduced risk
The break and retest strategy involves identifying key levels, waiting for a breakout, and then strategically entering the market during the retest phase.
On the flip side, “trading the retest” means waiting for a broken level to be retested as new support or new resistance before entering the market. The diagram below illustrates the difference. A quick glance at the illustration above may have you wondering why anyone would enter before the retest

What is option chain pcr ?The Put-Call Ratio (PCR) is a popular technical indicator used by investors to assess market sentiment. It is calculated by dividing the volume or open interest of put options by call options over a specific time period. A higher PCR suggests bearish sentiment, while a lower PCR indicates bullish sentiment.
The Put-Call Ratio (PCR) is a useful indicator to understand the market sentiment at any given time. A high PCR suggests a bearish market, while a low PCR signals bullish tendencies. It helps investors assess whether the market is leaning towards optimism or pessimism, which can shape investment strategies.
A good PCR ratio depends on the market context, but generally, a PCR below 0.7 indicates bullish sentiment (potential market rise), while a PCR above 1.2 suggests bearish sentiment (potential market decline)

advanced option trading stratergies Some common advanced options trading strategies. are: Long Straddle and Strangle: Buying a call and put with the same expiration date and different strike prices. Iron Condor and Iron Butterfly: Combining a bear call spread and a bull put spread.
Which strategy is best for option trading?
The long straddle is the best strategy for option trading that consists of purchasing an In-The-Money call and putting options with the same underlying asset, strike price, and expiration date. Profit potential is infinite in this method, while loss potential is limited.
Also called the 1-3-2 butterfly spread, it is a common variation if the butterfly spread involving buying one option at a lower strike, selling three at a middle strike, and buying two at a higher strike. This advanced options trading strategy offers more flexibility.
