Gold at Crucial 325x Support – What's Next for the Yellow Metal?XAUUSD D1 Forecast: Gold at Crucial 325x Support – What's Next for the Yellow Metal?
Namaste, fellow traders!
Today, let's zoom out and look at the bigger picture for Gold (XAUUSD) on the Daily (D1) timeframe. Our analysis indicates that Gold has hit a very strong, hard support level around the 325x region. This is a pivotal point that could dictate Gold's medium to long-term direction!
🌍 Macroeconomic Context: The Forces at Play for Gold
While we've seen some USD weakness due to speculations surrounding the Fed (like the rumors about replacing Powell) and expectations of rate cuts, these factors haven't completely prevented Gold's recent decline on the daily chart. Also, the sustained ceasefire between Israel and Iran is reducing Gold's safe-haven appeal.
However, the current price action at the robust 325x support level is a significant technical signal. The influence of upcoming US macroeconomic data (especially the PCE Index on Friday) and speeches from FOMC members will be crucial in confirming or negating Gold's next moves. If positive news for Gold aligns with this support holding, it could act as a strong catalyst.
📊 XAUUSD Technical Analysis (D1): Predicting Gold's Next Move
Based on the fact that Gold has encountered strong support at 325x, we can anticipate the following scenarios:
Bounce from 325x (Potential Upside Phase):
If the 325x area (which reinforces the 3264.400 support from image_e9d325.png) holds firm, we expect a strong reaction and an upward move for Gold.
The initial target for this bounce would be the 332x region, which aligns with resistance levels 3313.737 - 3330.483 from our previous analysis. On a broader timeframe (as shown in image_83845c.png), this corresponds to the resistance zone around 3326.022. This 332x area could represent a continuation pattern, meaning it might be a corrective rise before the resumption of the larger trend.
Resumption of Downtrend (After Reaching 332x):
Once Gold reaches and tests the 332x zone (3313.737 - 3330.483 / 3326.022) and shows bearish confirmation signals (e.g., a strong bearish engulfing candle, a pin bar, or a clear top formation), we anticipate a resumption of the downward movement.
The next major target for this fall would be the 317x area, which correlates well with the strong support at 3173.052 on the larger timeframe (as depicted in image_83845c.png).
🎯 XAUUSD D1 Trading Plan: Your Long-Term Strategy Ahead!
Considering the current D1 analysis, here's our actionable plan:
1. BUY PHASE (Bounce from Support):
Entry: Observe price reaction in the 325x - 326x zone (especially 3264.400). Only buy if there are clear bullish confirmations (e.g., a confirmed bullish pattern on the daily or 4-hour candle, a strong bounce from the zone with volume).
SL: Just below the 325x support zone (e.g., 3245-3240, depending on confirmation).
TP: 3280 - 3290 - 3300 - 3313.737 - 3326.022 (key 332x zone). This will be our primary target for the bounce.
2. SELL PHASE (Downtrend Resumption):
Entry: After the price reaches the 332x zone (3313.737 - 3330.483 / 3326.022) and shows bearish confirmation signals (e.g., strong bearish engulfing, pin bar, or top formation).
SL: Slightly above the 332x zone (e.g., 3335-3340).
TP: 3300 - 3290 - 3280 - 3270 - 3260 - 3250 - 3200 - 3173.052 (final 317x target).
Fundamental-analysis

ISLAMIC NEW YEAR OR RATHYATRA PICKTechnical View
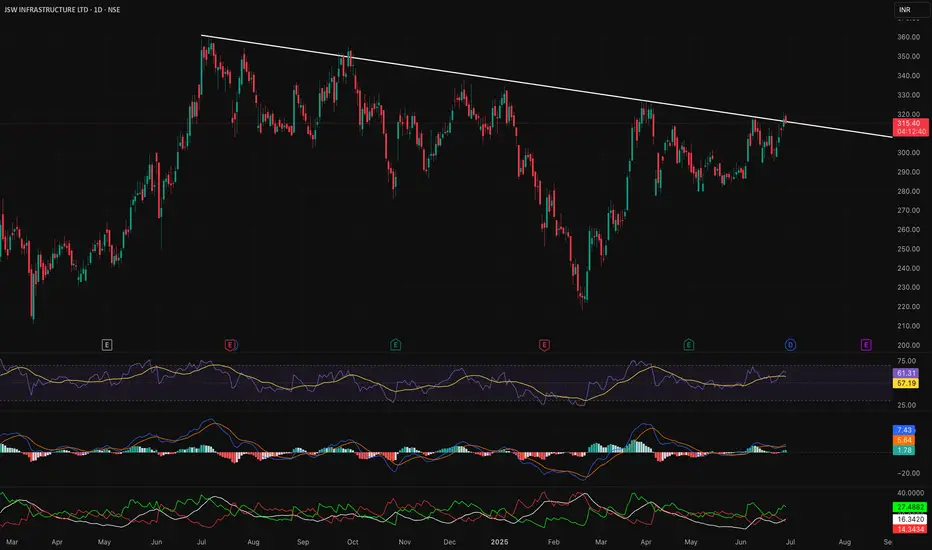
Stock is clearly formed Cup&Handle pattern. Privious major SR Line break. Pattern made near major SR line. complete reversal formation.
RESPONIND
CMP 219
TARGET 250/275/300+++
BUY ON DIPS NEAR 200-204
SL 190( DAILY CLOSING BASIS)
Fundamental View
ROE and ROE BOTH ARE GOOD. Quaterly and Yearly boh Revenue and PAT are Highest Ever. positive cashflow..
I Am Not SEBI Registered Research Analyst. It Is Giving Only Educational Purpose. Buying in RESPONIND After Discussing With Your Financial Advisor.

JSW Infra - MULTIPLE PATTERN BREAKOUTJSW Infra Fundamentally is going strong business !!
Y-on-Y strong growth and super Margins.
Fii is slowly increasing Stake as well!!
Indicators are supporting in a strong way as well!
Buy @ 315
SL 286
Target - 360 ++
A good bet for short Term !!
XAUUSD: Gold's Golden Glow Fades Below $3350 XAUUSD: Gold's Golden Glow Fades Below $3350 – Navigating Key Levels Amidst USD Weakness!
Let's dive into the fascinating world of Gold (XAUUSD) today. The yellow metal is showing subtle positive movement, primarily influenced by a weaker US Dollar, but a convincing bullish breakout above the $3350 mark remains elusive.
🌍 Macroeconomic Snapshot: USD's Woes & Gold's Mild Support
Gold has seen a slight positive bias for the second consecutive day, yet it's struggling to find significant follow-through, staying below the $3350 level in early European trading.
USD Under Pressure: Reports indicating that US President Donald Trump is considering replacing Fed Governor Jerome Powell have sparked concerns regarding the future independence of the US central bank.
Cautious Outlook: This mixed bag of news calls for caution before confirming a definitive bottom for Gold or positioning for a substantial recovery from levels below $3300 (or Tuesday's two-week low). Traders are currently focused on upcoming US macroeconomic data and speeches from FOMC members, which could influence XAU/USD ahead of Friday's crucial US Personal Consumption Expenditures (PCE) Price Index release.
📊 XAUUSD Technical Analysis & Intraday Trading Plan:
Current Trend: Gold has recently experienced a sharp decline and is now in a consolidation phase, trading around the $329X mark. Price is currently below shorter-term moving averages, indicating lingering bearish pressure or an accumulation phase.
Key Levels Identified:
Strong Support Zones (Potential BUY Areas): Levels around 3294.414, 3276.122, and particularly 3264.400 are crucial demand areas.
Key Resistance Zones (Potential SELL Areas): Levels at 3313.737, 3321.466, 3330.483, and 3341.947 are identified as significant supply zones.
🎯 XAUUSD Trading Plan (Based on your specified levels):
BUY ZONE (Strong Support - Long-Term Bias):
Entry: 3266 - 3264
SL: 3270
TP: 3280 - 3284 - 3290 - 3295 - 3300 - 3305 - 3310 - 3320
BUY SCALP (Quick Buy at Intermediate Support):
Entry: 3284 - 3282
SL: 3278
TP: 3288 - 3292 - 3296 - 3300 - 3305 - 3310 - 3320 - 3330
SELL ZONE (Key Resistance):
Entry: 3331 - 3333
SL: 3337
TP: 3326 - 3320 - 3316 - 3310 - 3305 - 3300
SELL SCALP (Quick Sell at Near Resistance):
Entry: 3313 - 3315
SL: 3320
TP: 3310 - 3305 - 3300 - 3295 - 3290 - 3280
⚠️ Key Factors to Monitor Closely:
US Macro Data: The upcoming US Personal Consumption Expenditures (PCE) Price Index on Friday is critical.
FOMC Member Speeches: Any comments on monetary policy or inflation outlook will directly impact USD and Gold.
Geopolitical Stability: Developments regarding the Israel-Iran ceasefire can influence safe-haven demand.

Institutional Option Trading Part -3Institutional Investment Process
Setting Objectives: Determining risk tolerance, return targets, and time horizons.
Asset Allocation: Dividing the portfolio among different asset classes.
Security Selection: Choosing individual investments.
Portfolio Monitoring: Continuously reviewing performance and risk.
Institutional Trading
Institutional trading refers to the buying and selling of securities in large volumes by institutions.
Types of Institutional Traders
Proprietary Traders: Trade with the institution's own money.
Agency Traders: Execute trades on behalf of clients.
Program Traders: Use algorithms to trade baskets of stocks.
Trading Venues
Exchanges: NYSE, NASDAQ, etc.
Dark Pools: Private exchanges for large orders.
Over-the-Counter (OTC): Direct trading without an exchange.

Institutional Option Trading Part -10Investment Strategies
Active Management: Constantly buying and selling assets to outperform benchmarks.
Passive Management: Tracking indices like the S&P 500 to match market performance.
Value Investing: Identifying undervalued stocks.
Growth Investing: Focusing on companies with high growth potential.
Quantitative Investing: Using mathematical models to guide investment decisions.
Risk Management
Diversification: Spreading investments across various sectors and assets.
Hedging: Using derivatives to offset risks.
Liquidity Management: Ensuring enough cash to meet obligations.
Regulatory Compliance: Adhering to financial regulations.

Institutional Option Trading Part -4Common Institutional Option Strategies
Covered Call Writing: Selling call options against stock holdings to generate income.
Protective Puts: Buying puts to insure portfolios against downside risk.
Spreads (Vertical, Horizontal, Diagonal): Limiting risk while aiming for a defined profit range.
Straddles and Strangles: Betting on volatility, regardless of market direction.
Iron Condors: Selling out-of-the-money calls and puts to profit from low volatility.
Tools and Platforms
Order Management Systems (OMS): To handle complex orders efficiently.
Execution Management Systems (EMS): For rapid and algorithmic order execution.
Advanced Analytical Software: For options pricing, risk assessment, and scenario analysis.
Advantages of Institutional Option Trading
Ability to execute large trades without significant slippage.
Access to lower fees due to trade volume.
Enhanced risk management capabilities.

Institutional Option Trading Part -5Institutional Option Trading
Institutional option trading involves using options as part of sophisticated strategies to hedge risk, enhance returns, or speculate.
Objectives of Institutional Option Trading
Hedging: Protecting large portfolios against market downturns.
Income Generation: Selling options to collect premiums.
Speculation: Taking directional bets with options.
Arbitrage: Exploiting price inefficiencies across markets.

Institutional Option Trading Part -6Institutional trading and investing significantly differ from retail activities. Institutions trade in large volumes, use complex strategies, and have access to exclusive information and tools. This guide will provide a comprehensive overview of institutional option trading, investing, and general trading practices, detailing their methodologies, tools, and market impacts.
Understanding Institutional Investors
Institutional investors include mutual funds, hedge funds, pension funds, insurance companies, and large banks. These entities manage vast sums of money, often on behalf of others, and possess substantial market influence.
Key Characteristics:
Large Capital Base: Institutions trade in millions or billions.
Market Influence: Their trades can impact prices significantly.
Professional Resources: Access to cutting-edge research, proprietary algorithms, and high-speed trading platforms.

Gold's Price Action Amidst Fed's Inflationary Warnings XAUUSD: Gold's Price Action Amidst Fed's Inflationary Warnings – Key Levels to Watch!
Hello TradingView Community!
Gold (XAUUSD) continues to be a focal point amidst the Federal Reserve's (Fed) cautious stance on inflation and interest rates. Recent statements from Fed Chair Jerome Powell highlight concerns that large-scale tariffs could trigger persistent inflation, moving beyond conventional economic models. Despite recent inflation cooling, Powell emphasized the need for more data from June and July before considering any rate cuts, warning of the risk that "price shocks turn into persistent inflation".
This creates a nuanced market sentiment, torn between hopes for rate cuts and the emerging inflation risk from tariffs. In this environment, Gold remains a crucial psychological anchor, especially if the Fed delays its reaction to new inflationary pressures.
📊 XAUUSD Technical Outlook (H4/M30 Chart Analysis):
Based on our recent chart analysis (e.g., image_008403.png): Gold is currently in a corrective or consolidating phase after a notable pullback. Price action indicates that key support and resistance levels are being tested.
Resistance Levels (Potential Sell Zones): We see significant resistance around 3352.383 - 3353.860 and higher up at 3371.205, with a major resistance area near the top at 3391.750 - 3395.000.
Support Levels (Potential Buy Zones): Key support is identified around 3317.738 - 3311.214, with a stronger demand zone at 3302.939 - 3302.857. A critical lower support lies at 3286.257.
🎯 XAUUSD Intraday Trading Plan:
Here are the key zones and targets for today, based on current market dynamics:
BUY SCALP:
Entry: 3316 - 3314
SL: 3310
TP: 3320 - 3324 - 3328 - 3332 - 3336 - 3340
BUY ZONE:
Entry: 3304 - 3302
SL: 3298
TP: 3308 - 3312 - 3316 - 3320 - 3330 - 3340 - 3350
SELL SCALP:
Entry: 3353 - 3355
SL: 3360
TP: 3350 - 3345 - 3340 - 3335 - 3330
SELL ZONE:
Entry: 3390 - 3392
SL: 3396
TP: 3386 - 3382 - 3378 - 3374 - 3370 - 3360
⚠️ Key Factors to Monitor:
Fed Speeches: Any further comments from Fed officials on inflation or policy outlook.
US Economic Data: Upcoming inflation (CPI, PCE) and employment reports (NFP) will heavily influence Fed policy expectations.
Geopolitical Developments: Ongoing global tensions can always boost Gold's safe-haven appeal.

Put Call Ratio (PCR) Explained in Simple TermsWhat is PCR?
The Put-Call Ratio (PCR) is a popular market sentiment indicator used in option trading. It helps traders understand whether more people are buying put options (bearish bets) or call options (bullish bets) at a given time.
Put Options: Contracts betting the price will go down.
Call Options: Contracts betting the price will go up.
How to Read PCR?
PCR < 1: More call options → Bullish sentiment.
PCR > 1: More put options → Bearish sentiment.
PCR = 1: Neutral sentiment.
But extreme values often suggest the opposite:
Very High PCR: Possible market reversal upwards (too many bearish bets).
Very Low PCR: Possible market reversal downwards (too many bullish bets).
Example:
Put OI: 5,00,000 contracts
Call OI: 10,00,000 contracts
PCR = 5,00,000 / 10,00,000 = 0.5 → This indicates bullish sentiment.
Why PCR Matters?
Helps identify market mood (bullish or bearish).
Gives contrarian signals (overcrowded trades can reverse).
Used in option trading strategies for timing entry and exit.

Learn Institutional Trading Part-10What is Divergence?
Divergence occurs when the price of a stock and an indicator (like RSI, MACD, or momentum indicators) move in opposite directions. It is often considered a warning that the current trend may be losing strength.
Types of Divergence
Regular Divergence:
Indicates potential trend reversal.
Example: Price makes a new high, but RSI makes a lower high.
Hidden Divergence:
Indicates trend continuation.
Example: Price makes a higher low, but RSI makes a lower low.
How to Use Divergence
Combine with support and resistance levels.
Confirm with volume and candlestick patte

Why People Trade OptionsKey Components of Options
Strike Price: The pre-agreed price at which the option can be exercised.
Premium: The price you pay to buy the option contract.
Expiration Date: The date until which the option is valid.
Why People Trade Options
Leverage: Small investment, potential for large returns.
Hedging: Protects portfolio from losses.
Speculation: Betting on price movements.
Example
If a stock is currently priced at ₹500, you can buy a call option with a strike price of ₹550, expiring in one month, by paying a premium of ₹5. If the stock price rises to ₹600, you can buy at ₹550 and immediately sell at ₹600, making a profit.

Learn Institutional Trading Part-4Technical Trading
Technical trading uses charts, patterns, and indicators to make decisions.
Traders study past price movements, volume, and signals to predict future trends instead of focusing on company financials.
Stock Market
The stock market is a place where shares of companies are bought and sold.
It’s like a big online shopping mall for stocks (e.g., NSE, BSE, NYSE). Prices go up and down based on demand, news, earnings, and investor emotions.

Learn Institutional TradingInvesting
Investing means putting your money into assets (like stocks, real estate, gold, or mutual funds) to grow your wealth over time.
It’s usually long-term, focused on building value and achieving goals like retirement or buying a house.
Divergence Trading
Divergence trading is when you compare the price of a stock with an indicator (like RSI or MACD).
If the stock is going up, but the indicator is going down (or vice versa), it shows divergence—a possible signal that the price might reverse soon.

Ready for a Fresh Rally Ahead of July FOMC Buzz?XAUUSD: Powell's "Soft Tone" Ignites Gold – Ready for a Fresh Rally Ahead of July FOMC Buzz?
🌍 Macro Landscape: Gold Reacts to Fed's Cues – Easing Rate Pressures?
The gold market (XAUUSD) is witnessing a resurgence of positive momentum, driven by recent "dovish-leaning" signals from Federal Reserve Chair Jerome Powell during his congressional testimony. Powell's acknowledgment of lower-than-expected inflation from tariffs, coupled with hints of a potential earlier interest rate cut (possibly as early as July), is creating a fresh wave of market anticipation.
While Powell cautiously noted "no need to rush," market participants are interpreting his remarks as an indication that current monetary policy might be "somewhat restrictive." Should inflation continue its sustainable deceleration, the Fed would be poised to ease policy sooner. This directly impacts gold: as rate cut expectations rise, the opportunity cost of holding gold (a non-yielding asset) diminishes, making it significantly more appealing to investors.
🏦 Central Bank Policy: Fed's Evolving Stance & Market Re-calibration
Federal Reserve (Fed): Chair Powell's nuanced message suggests a more adaptable Fed, ready to align its policy with actual inflation data. His emphasis on the Fed's independence from political influence further solidifies confidence in data-driven decisions.
Market Re-calibration: While the broader market still leans towards a September rate cut, the probability of a July cut is subtly increasing, according to the CME FedWatch Tool (with 70.1% anticipating a cut to 4.00 - 4.25% by September). This re-pricing of policy risk is a crucial supportive factor, helping gold maintain stability around the $3,300–$3,320/oz mark, indicating smart money accumulation.
This evolving Fed perspective, even a slight shift, is powerful enough to influence capital flows and investor sentiment globally, setting the stage for significant gold movements.
🌐 Capital Flows: Gold & USD – The Shifting Safe-Haven Dynamics
Global capital flows are highly sensitive to interest rate expectations and perceived risks. Historically, both gold and the U.S. dollar serve as primary safe havens during periods of uncertainty.
If Powell's "dovish tilt" gains further traction and leads to earlier rate cuts, we could anticipate a notable rotation in capital:
Outflows from USD: Lower U.S. yields would diminish the attractiveness of the USD as a yielding asset.
Inflows into Gold: The reduced opportunity cost of holding gold, combined with its intrinsic store-of-value appeal, could trigger substantial capital flows into the precious metal, especially amidst persistent global geopolitical tensions.
The market's re-evaluation of Fed policy risk is already contributing to gold's resilience, suggesting that strategic positioning for an upside move might be underway.
📊 Technical Structure (H4/M30 Chart Analysis): Gold Breaking Bearish Bias, Targeting Higher Levels
Based on the provided XAUUSD chart (H4/M30 timeframe):
Channel Breakout: Gold has visibly broken out of a prior descending channel, signaling a clear weakening of selling pressure and a potential trend reversal. The price is currently consolidating and appears to be forming a new accumulation pattern or a smaller ascending channel.
Key Price Levels:
Potential Sell Zone (Resistance): Around 3,352.383 - 3,371.205. This zone aligns with significant Fibonacci retracement levels (0.5 and 0.618 from the last major swing down) and represents a strong historical resistance cluster. If the price attempts to breach this zone and fails, selling pressure could emerge.
Higher Resistance: 3,391.750 - 3,395.000. This is a formidable resistance area. A decisive break above this level would confirm a more robust long-term bullish trend.
Current Buy Zone (Support): Around 3,302.939 - 3,311.214. This is a critical demand zone, where strong buying interest is likely to surface, coinciding with recent swing lows.
Next Key Support: 3,286.257. Should the 3,302.939 - 3,311.214 zone be breached, this level would be the next significant support to watch.
Moving Averages (EMA 13-34-89-200):
The price is currently trading above the shorter-term EMAs (13 & 34), indicating positive short-term momentum.
The longer-term EMAs (89 & 200) are likely transitioning from resistance to dynamic support, or showing signs of convergence, suggesting a potential shift in market structure. A 'Golden Cross' formation among these EMAs would be a powerful bullish signal.
Projected Price Action: The chart depicts a scenario where the price might retrace slightly towards the 3,317.738 support or even deeper to 3,302.939 before embarking on a strong upward rally, targeting resistance zones like 3,352.383 and further to 3,371.205.
🎯 Trade Strategy Recommendations (Based on Provided Zones):
BUY ZONE: 3286 - 3284
SL: 3280
TP: 3290 - 3294 - 3298 - 3302 - 3306 - 3310 - 3315 - 3320
BUY SCALP: 3302 - 3300
SL: 3295
TP: 3306 - 3310 - 3314 - 3318 - 3322 - 3326 - 3330
SELL ZONE: 3353 - 3355
SL: 3360
TP: 3350 - 3346 - 3340 - 3335 - 3330 - 3320
SELL ZONE: 3372 - 3374
SL: 3378
TP: 3370 - 3366 - 3362 - 3358 - 3354 - 3350
⚠️ Key Events to Watch:
Further Speeches by Fed Officials: Any new comments on inflation, economic data, or the rate path will heavily influence market dynamics.
Global Geopolitical Developments: Ongoing tensions or new uncertainties can always bolster gold's safe-haven appeal.
Macro Pressure or Opportunity to Accumulate?XAUUSD 24–28 June: Gold Slides to Buy Zone – Macro Pressure or Opportunity to Accumulate?
🔍 Macro Outlook – A Volatile Week for Gold Traders
Gold is navigating through a complex macroeconomic landscape this week, with multiple factors weighing in:
✅ Middle East Tensions Resurface
Israel has declared plans to retaliate against Iran following a ceasefire violation, increasing geopolitical risk. This situation historically supports safe-haven demand for gold when it escalates.
✅ US Economic Data May Soften Fed’s Tone
The U.S. economy is showing early signs of cooling:
Housing market data fell short of expectations.
PMI data indicates manufacturing and services are slowing.
If the Core PCE Index (set to release this week) confirms soft inflation, expectations for a Fed rate cut in September may solidify, putting pressure on the USD and boosting gold.
✅ China & India Are Stocking Up on Gold
India’s jewelry and central bank demand is on the rise ahead of budget season. Meanwhile, China continues to increase its gold reserves for the 19th consecutive month, offering underlying support to the price.
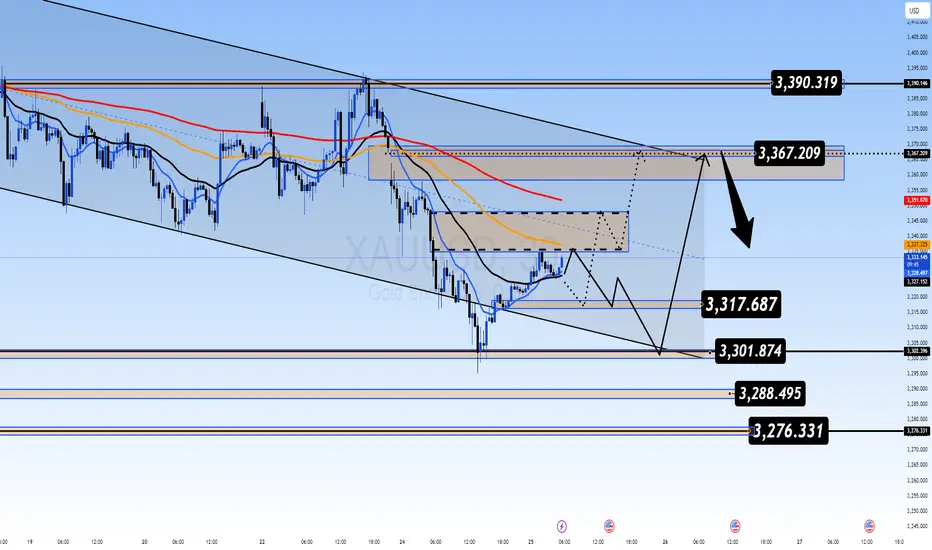
📉 Technical Analysis – Is the Correction Bottoming Out?
XAUUSD remains in a downward-sloping channel on the H1/H4 chart, but prices are approaching key support zones with strong historical demand.
EMA 34 – 89 – 200 still show downward momentum.
However, RSI divergence is forming on the lower timeframes, signaling potential bullish pressure.
A clear FVG (Fair Value Gap) around the $3367–$3369 zone presents a strong liquidity zone for reversal.
✅ Trading Plan for XAUUSD
🔵 BUY ZONE: $3278 – $3276
Stop Loss: $3270
Take Profits:
TP1: $3282
TP2: $3286
TP3: $3290
TP4: $3294
TP5: $3298
TP6: $3302
TP7: $3305
TP8: $3310
📌 Reason to Buy: Price is approaching the bottom of the descending channel with visible demand zone, enhanced by RSI divergence and macro geopolitical pressure favoring safe-haven flows.
🔴 SELL ZONE: $3367 – $3369
Stop Loss: $3375
Take Profits:
TP1: $3364
TP2: $3360
TP3: $3356
TP4: $3352
TP5: $3348
TP6: $3344
TP7: $3340
TP8: $3330
TP9: $3320
📌 Reason to Sell: This is a key FVG resistance area where sellers have previously stepped in aggressively. If price retests without momentum, it's likely to reject back toward support.
📎 Summary for Indian Traders
This week’s gold strategy is a balance between short-term technical plays and long-term macro shifts. Keep your eyes on PCE data, USD movement, and any flare-up in Middle East tensions. Each of these could serve as catalysts for either a bounce or continuation.

Learn Institutional Option Trading Part-6Mutual Funds in India:
Mutual funds pool money from multiple investors and invest in a diversified portfolio.
Types:
Equity Mutual Funds
Debt Mutual Funds
Hybrid Funds
Index Funds & ETFs
Systematic Investment Plan (SIP) is a popular method to invest monthly with discipline.
Government Schemes:
PPF (Public Provident Fund)
NSC (National Savings Certificate)
EPF (Employees Provident Fund)
These are safe, tax-efficient, and suitable for conservative investors.

Learn Institutional Option Trading Part-10Popular Option Strategies in India:
Buying Call Options: Profit when the market rises.
Buying Put Options: Profit when the market falls.
Covered Call: Holding a stock and selling a call option to earn premiums.
Protective Put: Buying a put option to safeguard stock holdings.
Iron Condor: Earning from a range-bound market using multiple options.
Straddle and Strangle: Benefiting from high volatility.

Learn Advanced Institutional TradingOption trading is a part of the derivatives market where investors buy and sell contracts known as options. These contracts derive their value from an underlying asset, which can be a stock, index, commodity, or currency.
In India, the most commonly traded options are based on Nifty 50, Bank Nifty, and stocks like Reliance, TCS, Infosys, etc.
Options give traders the right, but not the obligation, to buy or sell the underlying asset at a predetermined price (strike price) before or on the expiry date.
Types of Options:
Call Option: Gives the buyer the right to buy the underlying asset.
Put Option: Gives the buyer the right to sell the underlying asset.

Option TradingIndia’s financial markets are rapidly evolving, and the participation of retail investors, institutions, and foreign players has significantly increased over the past two decades. Among various investment avenues, option trading, equity investing, and gold trading have become the most prominent ways of wealth creation and hedging against risks. Each of these segments has its unique importance, strategies, and regulatory frameworks in India.
This guide will help you understand the core concepts, market structure, strategies, and risks associated with Indian Option Trading, Equity Investing, and Gold Trading in a simple and practical manner.

XAUUSD 23/06 – Bears Losing Steam as FVG Zone Returns to PlayXAUUSD – Gold Sets Up for a Strategic Bounce Amid Fed Dovish Shift and Yield Retreat
📊 MACRO & FUNDAMENTAL INSIGHTS – WEEK AHEAD
Gold enters the final week of June with renewed investor focus amid softening Fed rhetoric and weakening US Treasury yields. Here's what Indian traders need to watch:
🔻 Fed Signals & Rate Cut Bets Rising
Jerome Powell’s upcoming speech and comments from FOMC members will shape the tone. Market now prices in a 65% probability of a rate cut in September, according to CME FedWatch.
If Powell leans dovish, expect renewed demand for non-yielding assets like gold. Conversely, hawkish surprises may pressure prices downward.
📉 US Dollar and Bond Yields Losing Momentum
The US Dollar Index (DXY) is retreating after peaking, while 10-year yields hover near 4.23% but fail to break higher.
Weakening yields and profit-taking on the dollar strengthen the safe-haven narrative for gold, particularly attractive to Indian investors during times of global volatility.
🌍 Geopolitical Tensions & Capital Flow Rotation
Ongoing concerns in the Middle East, Ukraine, and Indo-Pacific increase gold’s appeal as a hedge.
Institutions have started rotating capital from equities to safe-haven assets. ETF inflows and central bank reserves—particularly from China and India—underline long-term accumulation.
🧠 TECHNICAL ANALYSIS – STRUCTURE & SENTIMENT
On the H1 chart, XAUUSD remains within a broader descending channel but has printed a potential reversal setup from the BUY ZONE (3327–3325).
The recent drop filled a Fair Value Gap (FVG), offering strong confluence support.
Price action shows early signs of accumulation with bullish divergence on RSI and price holding above the trendline support.
Immediate resistance is seen at 3355–3360, with stronger supply anticipated near the SELL ZONE (3398–3400), aligning with a high-timeframe trendline.
🎯 TRADING PLAN – UPDATED FOR SHORT/MEDIUM TERM
🔵 BUY ZONE: 3327 – 3325
SL: 3320
TP: 3330 → 3335 → 3340 → 3345 → 3350 → 3355 → 3360 → ???
This zone aligns with key structural support and the base of FVG. A break above 3360 may trigger acceleration toward 3375–3390.
🔴 SELL ZONE: 3398 – 3400
SL: 3405
TP: 3395 → 3390 → 3386 → 3380 → 3375 → 3370 → 3360
Ideal area to fade potential spikes driven by news or sentiment. Look for rejection wicks or RSI divergence before entering.
⚖️ STRATEGY OUTLOOK
With central banks tilting toward easing, gold may reclaim dominance as a macro hedge. India’s gold imports are expected to increase if prices consolidate below 3350. Patience and discipline around key zones are critical—let price validate direction.

Compression Before Expansion: Market Awaits Its Next MoveBTCUSD – Compression Before Expansion: Market Awaits Its Next Move
Bitcoin is trading within a compressed structure after rejecting key resistance and retesting support. While the overall sentiment remains cautious, the technical setup is beginning to show signs of strength — if buyers can reclaim control.
🧭 Macro Check-In: Calm Before the Crypto Storm?
No rate cut from the Fed yet, but markets are starting to price in the possibility of a pause in Q3 or Q4.
ETF inflows slowing, but institutional positions are not closing — suggesting long-term conviction remains.
Political momentum in the US is shifting towards crypto adoption, with Bitcoin emerging as a talking point in election debates.
Dollar index (DXY) continues to chop, giving crypto room to breathe if inflation data remains mild.
In short: liquidity is building, but the trigger hasn’t fired — yet.
📊 Chart Structure (H1–H4): Levels That Matter
BTC is holding just above 103,100, a key level where previous demand stepped in.
The mid-range resistance lies at 104,184 — this needs to break for bulls to gain short-term control.
Above that, eyes are on 106,047, then 107,586 (top of the descending channel).
EMA alignment is still bearish → wait for structure shift, not FOMO.
📌 Trade Map
🔵 Buy Setup
Zone: 103,100 – 103,300
Condition: Bullish reaction + rejection wick / engulfing
SL: 102,600
TP: 104,184 → 106,047 → 107,586
🔴 Sell Setup (Only if trap triggers)
Zone: 107,500 – 107,800
Condition: Rejection + volume fade
SL: 108,200
TP: 106,000 → 104,500
🧠 Trader Insight
“When the chart compresses, smart money positions early.”
Bitcoin is not trending — it's accumulating or distributing. Retail is waiting for breakout. Smart traders are preparing for both scenarios.
Watch the reaction, not the prediction.
Stay objective. Let levels lead the logic.
