Institution Option Trading Part-2.0Institutional Order Flow – Market Impact
Option Flow as Signal: Large trades in options market may indicate upcoming moves in underlying assets.
Unusual Options Activity (UOA): Tracked by smart money traders to anticipate institutional moves.
Dark Pools: Institutions often use off-exchange mechanisms to avoid price impact.
Tools & Analytics Used by Institutions
Volatility Surface Analysis
Greeks Sensitivity Scans (Delta, Gamma, Vega, Theta)
Skew Charts & Term Structure
Trade Cost Analysis (TCA)
Liquidity Heatmaps
Algo Execution Strategies (TWAP, VWAP)
Fundamental-analysis

Institution Option Trading Part-6Introduction to Institutional Option Trading
Institutional option trading refers to the use of options by large financial institutions such as hedge funds, pension funds, insurance companies, mutual funds, and proprietary trading desks to manage risk, enhance returns, or speculate on price movements. Unlike retail traders, institutions bring scale, research, and complex strategies to the options market.
Slide 2: Key Characteristics of Institutional Traders
Large Capital Base: Institutions trade in bulk with millions or billions of dollars.
Data Advantage: Access to premium data, analytics, and predictive algorithms.
Advanced Infrastructure: High-frequency execution systems, smart order routing.
Risk Management Focus: Use options for hedging equity, credit, FX, or commodity exposure.
Regulatory Boundaries: Subject to risk limits, compliance, and disclosures

Gold Surges Amid Middle East TensionsXAUUSD – Gold Surges Amid Middle East Tensions | What’s Next After 3430 Break?
🌍 Macro & Geopolitical Overview
Gold prices accelerated sharply in the Asian session on June 13 after Israel launched a large-scale airstrike campaign against Iran, targeting nuclear facilities including the Natanz uranium enrichment site.
Israeli Prime Minister Netanyahu declared the mission would continue until the Iranian nuclear threat is “completely neutralized.”
Iran suffered major losses and scrambled its air force to prepare for retaliation.
WTI oil jumped over 8%, gold spiked to $3,430/oz, and US equities dropped sharply.
While the US claimed it would not participate directly in the attack, it vowed to defend its forces in the region if threatened.
This rapidly escalating geopolitical conflict has triggered a renewed flight into safe-haven assets, with gold leading the pack.
📉 Technical Outlook – M30 / H1 Chart
🔹 Trend Structure
Gold has broken out decisively above 3,392, forming a strong bullish leg and carving new short-term support around 3,412 – 3,426.
Price action is forming a Higher High – Higher Low structure within a rising channel.
🔹 Fair Value Gap (FVG)
A visible FVG between 3,405 – 3,412 has formed. As long as price holds above this zone, bullish continuation is favored.
🔹 EMA Structure
Price is well above all key EMAs (13, 34, 89, 200), confirming a strong bullish environment. EMA13 continues to guide intraday momentum.
🔹 Key Resistance Zone
Watch for potential distribution or profit-taking around 3,441 – 3,456 – a major resistance area if no further escalation occurs.
🧠 Market Sentiment & Behavior
Investor sentiment has shifted firmly into risk-off mode.
Funds are flowing heavily into gold, oil, CHF, and JPY.
Price volatility is likely to spike further, as headlines continue to drive intraday sentiment.
🎯 Updated Trade Setup – 13 June
🔵 BUY ZONE: 3384 – 3382
Stop-Loss: 3378
Take-Profit: 3388 → 3392 → 3396 → 3400 → 3405 → 3410
🔴 SELL ZONE: 3454 – 3456
Stop-Loss: 3460
Take-Profit: 3450 → 3446 → 3442 → 3438 → 3434 → 3430
✅ Conclusion
The renewed conflict between Israel and Iran is fueling gold’s rise as global risk appetite collapses. Technically, the trend remains bullish, but volatility is extremely elevated. Traders should watch key price zones closely and avoid emotional trades during event-driven spikes.
⚠️ Trade the reaction, not the prediction. Let key levels confirm bias before entering.

Institution Option Trading Part-3How Option Database Trading Works (Step-by-Step)
Step 1: Data Collection
Real-time data from NSE, BSE, CBOE, or broker APIs (Zerodha, Interactive Brokers, etc.).
Store tick-level or EOD snapshots into SQL/NoSQL databases.
Step 2: Data Cleaning & Normalization
Remove missing values, align timestamps, convert formats.
Normalize values like IV to make models consistent.
Step 3: Exploratory Data Analysis (EDA)
Use Python (Pandas, Matplotlib) or R to analyze:
Option volume spikes
Volatility contraction/expansion
Unusual OI build-ups
Step 4: Backtesting Trading Strategies
Strategies like Straddle, Strangle, Iron Condor, or IV Crush are tested.
Entry/exit logic coded, and trades simulated on historical data.
Step 5: Deploying Models
Successful strategies get automated using APIs or Trading Bots.
Regular performance metrics tracked and refined.

Option Trading with Professionals Why is Option Data Important?
Pattern Recognition: Historical data helps spot repeatable patterns across expiry dates, strikes, or underlyings.
Volatility Analysis: IV and HV trends assist in detecting overpriced or underpriced options.
Liquidity Study: OI and Volume data help identify where smart money is moving.
Strategy Development: Backtesting using past data validates the strength of a strategy before real capital is deployed.
Market Sentiment Gauge: Changes in IV, OI, and skew can reflect trader sentiment and possible direction.
🧰 Core Components of an Option Database
A fully functional options database setup typically includes:
1. Options Chain Data
Captures details like Strike Price, Expiry Date, LTP, IV, Bid/Ask Spread, Greeks.
Should be stored with timestamps and unique IDs for reference.
2. Open Interest & Volume History
Time-series data showing how OI and volume evolved intraday and over time.
3. Volatility Surfaces
3D models showing how IV changes with strike and time to maturity.
4. Underlying Asset Data
Historical prices, volume, dividends, splits, news events, and earnings.
5. Event Tags
Earnings announcements, economic reports, corporate actions tagged for context during backtesting.

Institution Option Trading Part-1In today’s fast-paced financial world, where milliseconds can make a difference, Option Database Trading has become an essential tool for serious traders, quantitative analysts, and institutional investors. This strategy revolves around using structured historical and real-time data from the options market to make informed, data-driven trading decisions.
This guide will help you understand what Option Database Trading is, how it works, what tools are required, and how it can significantly improve your edge in the options market.
📊 What is Option Database Trading?
Option database trading involves the systematic storage, analysis, and utilization of large datasets from the options market to find patterns, identify opportunities, and execute trades. It typically includes:
Historical Option Prices
Implied Volatility (IV) & Historical Volatility (HV)
Open Interest (OI) & Volume
Greeks (Delta, Theta, Vega, Gamma, Rho)
Option Chain Snapshots
Corporate Actions, Earnings, News Impact
By creating or accessing an options data warehouse, traders can backtest strategies, run simulations, and refine their models using real market data.

XAUUSD – CPI Data Pushes Gold HigherXAUUSD – CPI Data Pushes Gold Higher | Should You Follow the Trend or Sell the Top?
Gold prices surged strongly after the US CPI report came in lower than expected. This triggered a sharp drop in the US Dollar and yields, while boosting demand for safe-haven assets. The question now: Is this the beginning of a new leg higher, or a setup for a short-term correction?
🌐 MACRO & MARKET SENTIMENT
📰 US CPI (May): Increased only 0.1% MoM and 2.4% YoY vs. forecast of 2.5%.
➤ This softer inflation reading reignited expectations that the Fed may cut rates as early as September.
📉 USD Weakness: The Dollar Index (DXY) dropped ~0.4%, making gold cheaper and more attractive for global investors.
📉 Bond Yields Falling: US 10Y yields declined, further increasing the appeal of gold as a non-yielding safe asset.
💡 Market Psychology: Traders are rotating capital back into gold ahead of FOMC and geopolitical uncertainties (China, Middle East).
📈 TECHNICAL OUTLOOK – H1 & H4 STRUCTURE
🔹 Trend Structure
Gold remains in a Higher High – Higher Low formation since the 3,312 level. Price recently broke above the 3,360–3,374 resistance and is now consolidating around 3,375 — a possible accumulation before breakout.
🔹 Price Channel
Gold is respecting an ascending channel with the lower bound aligning with the key support area at 3,339 – 3,345. As long as this zone holds, bulls are in control.
🔹 EMA Indicators
EMA13 / EMA34: Price is comfortably above both — indicating strong short-term momentum.
EMA89 / EMA200: Both EMAs are well below price action, confirming a medium-term bullish trend.
🔹 Caution Zone
Resistance at 3,392 – 3,395 is a key area to watch for reversal patterns (Pin Bars, Bearish Engulfing, etc.)
If price pulls back to 3,339 – 3,345 and holds, it can offer high-probability long entries with trend continuation.
🎯 TRADE SETUPS
🔵 BUY ZONE: 3324 – 3322
Stop-Loss: 3318
Take-Profit Targets: 3330, 3334, 3338, 3342, 3346, 3350
🔵 BUY SCALP: 3337 – 3335
Stop-Loss: 3330
Take-Profit Targets: 3341, 3345, 3350, 3354, 3360, 3370, 3380
🔴 SELL ZONE: 3392 – 3394
Stop-Loss: 3398
Take-Profit Targets: 3388, 3384, 3380, 3375, 3370, 3360, 3350
🧠 CONCLUSION
The lower-than-expected CPI has given gold a short-term macro boost, and technically, bulls remain in control. However, caution is needed near the 3,392 zone — where price could face strong supply and trigger a pullback.
✅ Trade with confirmation, not assumptions. Let the price action guide your next move.

Power of India VixWhy India VIX Matters?
✅ Predicts Market Sentiment: Spikes in VIX often precede sharp market moves.
✅ Option Pricing Insight: High VIX = Expensive Options; Low VIX = Cheaper Options.
✅ Helps Strategy Selection:
High VIX: Favor credit strategies (Iron Condor, Strangle Sell).
Low VIX: Favor debit strategies (Buy Call/Put, Spread Buy).
✅ Risk Management Tool: Helps gauge when to reduce exposure or go aggressive.
Option trading is a financial strategy where traders buy and sell options contracts — financial instruments that derive value from underlying assets like stocks or indices. Each option gives the buyer the right (not obligation) to buy (Call) or sell (Put) at a specified price before expiry.

Trading Road Map 1. Foundation Stage (Beginner Level)
Understand Markets: Equity, Commodity, Forex, Derivatives
Basic Concepts: What is a stock, index, option, futures
Learn Platforms: TradingView, Zerodha, Upstox
Risk Awareness: Avoid FOMO, control emotions, capital safety
🔹 2. Skill Building Stage (Intermediate Level)
Technical Analysis: Charts, Patterns, Indicators (MACD, RSI, Moving Averages)
Fundamental Analysis: Earnings, Balance Sheets, PE ratio
Paper Trading: Practice without risking money
Journaling: Track trades, wins/losses, and learn from mistakes
🔹 3. Strategy Development (Advanced Level)
Create Systems: Scalping, Swing, Positional
Options Mastery: Strategies like Iron Condor, Straddle, Spread
Risk Management: Position sizing, SL rules, R:R ratio
Backtesting: Validate your strategy on historical data
🔹 4. Execution & Scaling (Pro Level)
Discipline & Psychology: Stick to plans, stay unemotional
Automation & Tools: Algo Trading, Screeners
Capital Scaling: From ₹10K to ₹10L+ systematically
Diversification: Trade across assets, build passive income

Trading with Experts What is Option Trading?
Option trading is a financial strategy where traders buy and sell options contracts — financial instruments that derive value from underlying assets like stocks or indices. Each option gives the buyer the right (not obligation) to buy (Call) or sell (Put) at a specified price before expiry.
🔹 Types of Options:
Call Option – Right to Buy
Put Option – Right to Sell
Index Options – Based on Nifty, Bank Nifty, etc.
Stock Options – Based on individual stocks (e.g., Reliance, HDFCBANK)
🔹 Key Components:
Strike Price – Agreed price to buy/sell
Premium – Price paid for the option
Expiry Date – Validity of the contract
Lot Size – Fixed quantity of shares per contract
ITM, ATM, OTM – In-the-money, At-the-money, Out-of-the-money
🔹 Why Trade Options?
✅ Leverage with less capital
✅ Hedging portfolio risk
✅ Strategic plays (Bullish, Bearish, Neutral)
✅ Income generation via selling options

Gold Holds Breath for CPI – Decisive Catalyst or Price Trap?XAUUSD: Gold Holds Breath for CPI – Decisive Catalyst or Price Trap?
🌍 Macro Landscape: Gold Awaits CPI, Real Interest Rate Pressure
The Gold market (XAUUSD) is in a highly sensitive phase as investors hold their breath for the upcoming U.S. Consumer Price Index (CPI) report during the U.S. session. CPI is the most crucial inflation gauge, and any deviation from expectations can trigger significant market shocks, especially for safe-haven assets like gold.
In this context, real interest rates are playing a pivotal role. If inflation cools faster than anticipated (lower CPI), pressure on the Federal Reserve (Fed) to cut interest rates will increase, leading to a drop in bond yields and making gold more attractive. Conversely, if inflation remains "sticky" (higher CPI), the Fed may maintain a "higher-for-longer" policy stance, pushing bond yields up and putting downward pressure on gold due to the increased opportunity cost of holding the non-yielding asset.
🏦 Central Bank Policy Divergence: Fed's Caution, BoJ's Waiting Game
Federal Reserve (Fed): FOMC members continue to signal patience with rate cuts. Recent inflation data shows persistent price pressures, particularly in the services sector, reinforcing the Fed's hawkish bias. This creates pressure on gold if the USD continues to strengthen due to higher interest rates.
Bank of Japan (BoJ): (While not directly related to XAUUSD, global policy divergence still impacts capital flows and sentiment. For Gold, our focus is primarily on the Fed and other major central banks.)
The divergence in global monetary policies, especially between the Fed and other major central banks, is creating a volatile environment for the gold market.
🌐 Capital Flows: Gold & USD – The Safe-Haven Race Amid Instability
Global capital flow models suggest that the USD and Gold are currently the two most sought-after safe-haven assets amidst geopolitical tensions (such as US-China tensions) and EU fiscal risks.
If the upcoming CPI data surprises the market, it could trigger significant capital flows between the USD (a yielding asset) and gold (a non-yielding asset). A lower-than-expected CPI could boost inflows into gold, while a higher CPI could reinforce USD strength and push gold prices lower.
📊 Technical Structure (M30 Chart): Gold in Decision Zone
On the M30 chart for XAUUSD:
Primary Trend: Gold prices are currently in a consolidation or slight correction phase, accumulating before the CPI news. The EMA 13 - 34 - 89 - 200 indicators present a mixed picture, with the price oscillating around the short-term MAs, while the longer-term MA (EMA 200) still acts as dynamic support/resistance. A "fan-out formation" or MA crossovers will be crucial signals confirming the next trend direction.
Crucial Resistance Zone (SELL Zone): Around 3374 - 3376. This is a strong resistance area where the price has reacted or has the potential to reverse. If the price rallies and approaches this zone before or after the CPI news without breaking through, it presents a potential selling opportunity.
Crucial Support Zone (BUY ZONE): Around 3314 - 3312. This is a strong support area where the price may find significant buying pressure to bounce. If the price corrects to this zone and shows bullish reversal signals (e.g., hammer candle, bullish engulfing), it presents a potential buying opportunity.
🎯 Trade Strategy Recommendations
Scenario 1 – BUY (Await reaction at support):
Entry: 3314 - 3312 (Wait for bullish reversal candle confirmation or strong buying pressure in this zone).
Stop-Loss: 3308 (Just below the support zone for capital protection).
Take-Profit:
TP1: 3318
TP2: 3322
TP3: 3326
TP4: 3330
TP5: 3335
TP6: 3340
Scenario 2 – SELL (Await reaction at resistance):
Entry: 3374 - 3376 (Wait for bearish reversal candle confirmation or strong selling pressure in this zone).
Stop-Loss: 3380 (Just above the resistance zone for capital protection).
Take-Profit:
TP1: 3370
TP2: 3366
TP3: 3362
TP4: 3358
TP5: 3352
TP6: 3348
TP7: 3340
⚠️ Key Events to Watch:
U.S. CPI Report (U.S. session): This is the most critical event, which will dictate gold's primary direction in the short term. Be prepared for strong volatility upon its release.
Any statements from Fed members: Comments on inflation or monetary policy can impact market sentiment.

Advanced Technical Trading Advanced Technical Trading: A Deep Dive
Introduction
Advanced technical trading goes beyond basic chart patterns and indicators. It blends quantitative analysis, risk management, algorithmic methods, and behavioral insights to make data-driven trading decisions. The goal is to create a structured trading framework that adapts to market dynamics with precision.
This guide covers advanced tools, methods, and strategies used by professional traders and hedge funds to navigate complex market conditions.
1. Market Structure Analysis
Understanding market structure is critical for timing entries and exits.
Market Phases: Accumulation → Mark-Up → Distribution → Mark-Down
Order Blocks: Institutional price levels where smart money enters (used in ICT and SMC).
Liquidity Pools: Zones of stop-loss clustering (above highs or below lows).
Break of Structure (BOS): A key signal that trend direction is shifting.
Change of Character (CHOCH): A microstructure shift that signals potential reversals.
Tools:
Volume Profile
VWAP (Volume-Weighted Average Price)
Footprint Charts (for order flow)
2. Multi-Timeframe Analysis (MTFA)
Advanced traders always align multiple timeframes:
HTF (High Time Frame): Weekly/Daily → Defines macro trend
MTF (Mid Time Frame): 4H/1H → Confirms setups
LTF (Low Time Frame): 15min/5min → Execution
Example: Look for a daily demand zone + 4H BOS + 5min bullish CHoCH to confirm long entry.
3. Advanced Indicators & Tools
A. ATR-Based Strategies
Average True Range (ATR): Measures volatility.
Use ATR to set dynamic stop losses and targets.
ATR Channels can be used to gauge overbought/oversold conditions.
B. Ichimoku Cloud
Gives a complete picture: trend, momentum, support/resistance.
Cloud twist (Kumo twist) indicates potential trend reversals.
C. RSI Advanced Usage
RSI Divergence: Price making new highs, RSI not confirming.
RSI Levels: Beyond 80/20—watch for failure swings.
D. Fibonacci Extensions
Combine with Elliott Wave for confluence in target projections.
4. Price Action + Liquidity Concepts
Price action trading at an advanced level involves understanding:
Fair Value Gaps (FVG): Imbalances where price moves aggressively without filling orders.
Liquidity Grabs: Price sweeping a high/low to trigger stop hunts, then reversing.
Mitigation Blocks: Areas where the market re-tests a previous imbalance before continuing.
Use in:
ICT (Inner Circle Trader) methodology
Smart Money Concepts (SMC)
5. Algorithmic & Quantitative Techniques
A. Statistical Edge
Backtest strategies using Python or Excel.
Metrics: Win rate, profit factor, Sharpe ratio, max drawdown.
B. Monte Carlo Simulations
Assess risk and variability in performance.
C. Correlation Analysis
Use tools like rolling correlation between assets (e.g., Nifty 50 vs. Bank Nifty).
6. Volume and Order Flow Trading
Volume tells the story behind price movement:
Footprint Charts: Show actual volume at each price level.
Delta Divergence: Difference between aggressive buyers and sellers.
Volume Clusters: Zones where high volume transactions occurred—often act as support/resistance.
Tools:
Bookmap
Sierra Chart
TradingView + Volume Profile plugins
7. Risk and Trade Management
Advanced trading isn't about always being right—it's about managing risk:
Kelly Criterion: Used to size trades based on edge.
R-Multiple Tracking: Risk-to-reward measurement on every trade.
Position Sizing Models:
Volatility-based sizing (using ATR)
Equity curve-based sizing
8. Strategy Building & Optimization
Build a Rules-Based Strategy
Setup (Entry Criteria): Structure + Indicator confluence
Trigger: Candlestick or microstructure confirmation
Risk Management: Fixed % or volatility-based
Exit Plan: Partial profit-taking, trailing stop, or time-based exit
Optimize Your Edge
Forward test in live but small positions
Maintain a trading journal
9. Psychological Edge
Advanced trading requires emotional discipline:
Avoid Overtrading: High-quality setups only.
Process Over Outcome: Focus on execution, not money.
Meditation and Mindfulness: Helps manage stress and improve decision-making.
Pre/Post-Market Routines: Review trades, plan ahead.
Books like "Trading in the Zone" by Mark Douglas are highly recommended.
10. Specialized Strategies
A. Options Flow Analysis
Track institutional options activity.

Advanced Institutions Level Trading || Part- 8Option Trading with India VIX and Nifty 50 in India
Introduction
Option trading in India has gained significant popularity in recent years, particularly among retail traders and institutional investors. Among the various instruments available, the Nifty 50 index options are the most traded due to their high liquidity and volatility. However, one key tool that helps traders make informed decisions in the options market is the India VIX (Volatility Index). Understanding the relationship between India VIX and Nifty 50 can give traders a strategic edge.
What Is Nifty 50?
The Nifty 50 is the benchmark index of the National Stock Exchange (NSE) of India. It comprises 50 of the largest and most liquid Indian stocks across sectors. The index represents the broader market and is widely used for benchmarking mutual funds, index funds, ETFs, and derivatives like futures and options.
Nifty 50 options are contracts that derive their value from the index itself. These contracts can be used to speculate on market direction, hedge positions, or generate income through strategies like writing options.
What Is India VIX?
The India VIX (Volatility Index) measures the market’s expectation of volatility over the next 30 calendar days. It is calculated based on the order book of Nifty 50 options. The index represents the degree of fear or complacency among market participants.
High India VIX: Indicates high expected volatility; usually occurs in uncertain or bearish market conditions.
Low India VIX: Indicates low expected volatility; typically seen in stable or bullish markets.
India VIX is also called the "fear gauge" of the Indian stock market, similar to the CBOE VIX in the U.S. markets.
Why India VIX Matters in Option Trading
Option prices are driven by several factors, primarily the underlying price, time to expiry, interest rates, dividends, and implied volatility (IV). India VIX is a real-time proxy for implied volatility in the Indian market, especially for Nifty 50 options.
Higher IV = Higher Option Premiums: When India VIX rises, option prices go up due to higher expected volatility.
Lower IV = Lower Premiums: When VIX drops, options become cheaper as volatility expectations fall.
Understanding India VIX helps traders anticipate how option premiums may behave and adjust their strategies accordingly.

Option Trading with Option chain part -3Example of an Option. Suppose that Microsoft (MFST) shares trade at $108 per share and you believe they will increase in value. You decide to buy a call option to benefit from an increase in the stock's price. You purchase one call option with a strike price of $115 for one month in the future for 37 cents per contract ...
Ans: Options contracts are of two types; Call options and Put options. However, they can differ based on their underlying assets and expiration date.

Technical Cass 9Hammer:
Doji :
Three-white soldiers:
Bullish Engulfing:
Tweezer Bottom:
How to confirm candlestick pattern?
Here are two reliable methods for confirming candlestick patterns with indicators:
MACD: A bullish crossover occurring alongside a bullish candlestick strengthens the case for upward movement.
RSI: Divergence between price and RSI can signal potential reversals, especially when aligned with candlestick patterns.

Option trading Who is the youngest successful stock trader in the world? 5 Youngest Stock Traders Ashu Sehrawat At only 22 years old, the self-made millionaire has created a name for himself as one of India's top stock traders.
Selling options spreads is one such strategy that fits the bill. It's often seen as one of the lowest risk option strategies because it allows you to have a pre-determined capped loss risk when trading. This way, you're not only minimizing risk but also generating income.

GOLD IN SIDEWAY PHASE, WAITING FOR A BREAKOUT THROUGH KEY LEVELSXAU/USD TRADING PLAN 10/06/2025 – GOLD IN SIDEWAY PHASE, WAITING FOR A BREAKOUT THROUGH KEY LEVELS!
🌍 MACRO CONTEXT – FUNDAMENTAL ANALYSIS
Geopolitical tensions and monetary policy: The market is currently in a wait-and-see phase, with major decisions pending from important meetings, especially statements from the Federal Reserve (Fed) and global conflict situations. These factors could have a significant impact on market sentiment and volatility in gold.
Weak economic data from major economies such as the U.S. and the Eurozone indicates challenging economic conditions, leading investors to view gold as a safe-haven asset.
Interest rates: Although the Fed continues its rate hike policy, financial market uncertainties could continue to support gold as a preferred asset class.
📉 TECHNICAL ANALYSIS
On the M30–H1 timeframe, XAU/USD is currently moving within a rising channel. After the correction in Wave 4, gold has bounced back in the 335x region and is now preparing to confirm the next trend. Signals from EMA indicate accumulation, potentially setting up for a strong rally ahead.
Key resistance levels: 3,338 – 3,345 (unexplored FVG region). If gold breaks above 3,345, a continued rise to 3,353 is highly likely.
Key support levels: 3,282 – 3,275. If gold retests these levels without breaking them, the chances of a rebound are strong.
🎯 TRADE SETUPS FOR TODAY
🔵 BUY ZONE:
Entry: 3,302 - 3,304
SL: 3,296
TP: 3,306 → 3,310 → 3,314 → 3,318 → 3,325
🔴 SELL ZONE:
Entry: 3352 - 3354
SL: 3,358
TP: 3,348 → 3,344 → 3,340 → 3,330 → 3,320
⚠️ NOTE:
Risk management: Expect significant volatility as the market awaits important news this week.
Wait for confirmation: Technical signals are for guidance; clear confirmation from the charts is needed before entering trades.
📌 CONCLUSION:
Gold is currently in a sideway phase and may be preparing for a breakout if these key support and resistance levels are breached.
Traders should monitor both macroeconomic factors and strategic price zones to make informed trading decisions.

Learn Institutional options trading Part-1Tools & Data for Option Traders
Tools to Use:
Option Chain Analysis (NSE Website)
Open Interest Charts (OI Analysis)
IV vs HV Charts (Volatility Tools)
PCR (Put Call Ratio) Indicators
FII/DII Activity Monitoring
TradingView, Sensibull, Opstra, StockMock

Learn Institutional options trading Part-5Future of Options Trading in India
What Lies Ahead:
More weekly expiries (e.g., MIDCPNIFTY)
Improved retail education
Stricter compliance and reporting
Rise in algo trading and automation
Integration with global exchanges (GIFT City)
With platforms like NSE IFSC, Indian traders may soon get access to international stock derivatives from Indian soil.

Learn Institutional options trading Part-6Psychology & Discipline in Options Trading
Success in options requires:
Defined trading plan
Strict risk-reward ratio
Avoiding revenge trades
Avoiding overtrading on expiry days
Regular review and journaling of trades
Emotional control and discipline are more important than strategy in consistent profitability.

Option Trading Part-7If you're looking for a simple options trading definition, it goes something like this: Options trading gives you the right or obligation to buy or sell a specific security on or by a specific date at a specific price. An option is a contract that's linked to an underlying asset, such as a stock or another security.
The Indian stock market has witnessed significant growth in recent decades, transforming from a manually operated environment to a digital, highly regulated, and globally integrated system. Among the many financial instruments available, options trading has emerged as one of the most dynamic and potentially rewarding strategies for traders and investors.

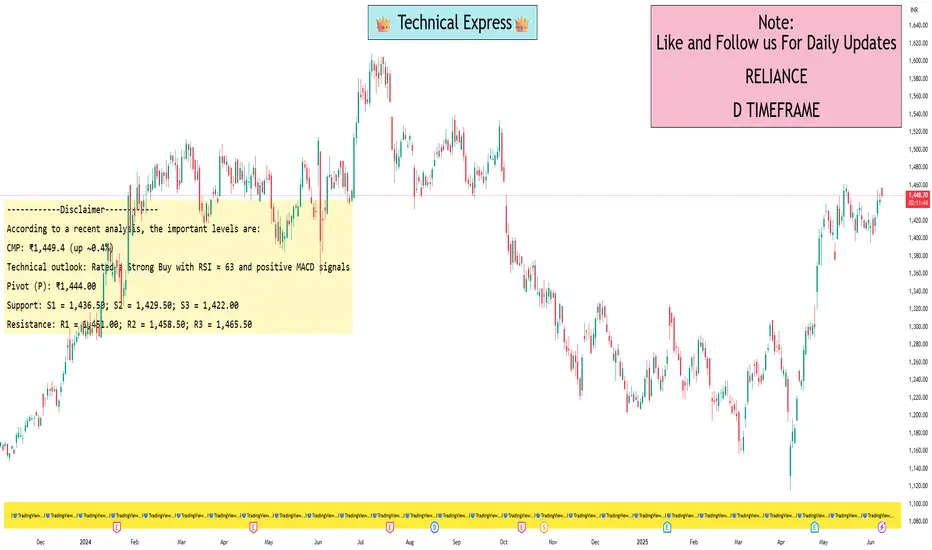
Reliance levels for swing tradingAccording to a recent analysis, the important levels are:
Current Price & Context
-- CMP: ₹1,449.4 (up ~0.4%)
-- Technical outlook: Rated a Strong Buy with RSI ≈ 63 and positive MACD signals
Pivot & CPR Levels
Daily (Classic) Pivot Points
Pivot (P): ₹1,444.00
Support: S1 = 1,436.50; S2 = 1,429.50; S3 = 1,422.00
Resistance: R1 = 1,451.00; R2 = 1,458.50; R3 = 1,465.50
Daily CPR:
Bottom Central (BC) = 1,444.25
Central = 1,444.00
Top Central (TC) = 1,443.75
Weekly Pivot Points
Pivot: ₹1,431.27
Support: S1 = 1,407.83; S2 = 1,372.17
Resistance: R1 = 1,466.93; R2 = 1,490.37
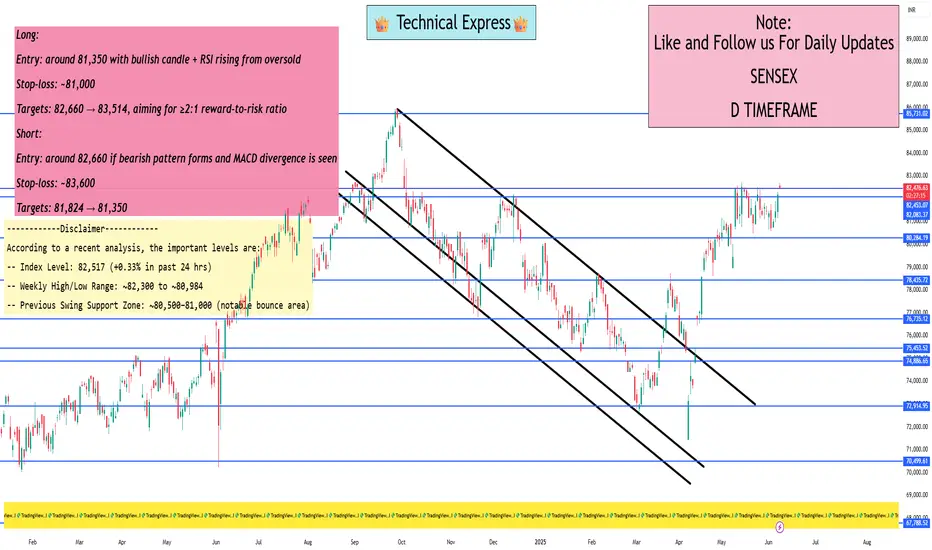
Sensex levels for swing tradingAccording to a recent analysis, the important levels are:
Index Level: 82,517 (+0.33% in past 24 hrs)
Weekly High/Low Range: ~82,300 to ~80,984
Previous Swing Support Zone: ~80,500–81,000 (notable bounce area)
Long:
Entry: around 81,350 with bullish candle + RSI rising from oversold
Stop‑loss: ~81,000
Targets: 82,660 → 83,514, aiming for ≥2:1 reward-to-risk ratio
Short:
Entry: around 82,660 if bearish pattern forms and MACD divergence is seen
Stop‑loss: ~83,600
Targets: 81,824 → 81,350