Bajaj Finance: All-Time High Breakout Powers GrowthTechnical Analysis
Bajaj Finance Limited showcases one of the most spectacular wealth creation stories in Indian equity markets. Over the past two decades, the stock has delivered an extraordinary super bullish rally from below ₹1 to creating an all-time high of ₹1,042 today - representing an exceptional 1,000x+ growth over 20 years.
The stock reached its all-time high at ₹1,042 today and has pulled back slightly to trade at ₹1,019. The previous Q1 FY26 results were positive, setting a strong foundation for continued momentum.
Key support levels are established at ₹975 (recent support), ₹850 (next support), and ₹700 (major demand zone). The stock offers multiple accumulation opportunities based on position sizing at any of these levels.
With Q2 results announcement scheduled for this month-end, this presents another crucial catalyst. If positive results continue, it could validate the breakout and trigger the next rally phase.
Entry Strategy: Start accumulating at current levels or on dips to support zones based on position sizing.
Targets:
Target 1: ₹1,080
Target 2: ₹1,120
Target 3: ₹1,160
Stop Losses:
Recent Support: ₹975
Next Support: ₹850
Major Demand: ₹700
If support levels and demand zone don't sustain, no more expectations on this stock.
Q1 FY26 Financial Highlights (vs Q4 FY25 & Q1 FY25)
Total Income: ₹19,524 Cr (↑ +6% QoQ from ₹18,457 Cr; ↑ +21% YoY from ₹16,100 Cr)
Total Expenses: ₹5,992 Cr (↓ -1% QoQ from ₹6,026 Cr; ↑ +21% YoY from ₹4,956 Cr)
Operating Profit: ₹6,614 Cr (↑ +13% QoQ from ₹5,879 Cr; ↑ +21% YoY from ₹5,460 Cr)
Profit Before Tax: ₹6,368 Cr (↑ +13% QoQ from ₹5,647 Cr; ↑ +21% YoY from ₹5,265 Cr)
Profit After Tax: ₹4,765 Cr (↑ +5% QoQ from ₹4,546 Cr; ↑ +22% YoY from ₹3,912 Cr)
Diluted EPS: ₹7.56 (↑ +5% QoQ from ₹7.21; ↑ +20% YoY from ₹6.32)
Fundamental Highlights
Bajaj Finance delivered robust Q1 FY26 performance with 22% YoY net profit growth and strong operational metrics. The company reported exceptional Q2 FY26 provisional update showing strong growth momentum with AUM up 24% YoY and new loans up 26%.
Market cap stands at ₹6,45,116 crore (up 43.8% in 1 year) with annual revenue of ₹73,107 crore and profit of ₹17,633 crore. Promoter holding remains stable at 54.7%, indicating strong management confidence.
Customer franchise grew to 110.64 million as of September 30, 2025, from 92.09 million the previous year, representing significant 20.2% YoY growth. AUM climbed to ₹4.62 lakh crore in Q2 FY26, with quarterly increase of ₹20,800 crore, demonstrating robust business expansion.
New loans booked rose 26% YoY to 12.17 million in Q2 FY26, indicating strong origination activity. The deposit book continued expanding steadily to approximately ₹69,750 crore, providing stable funding base.
Asset quality remains superior with lower gross and net NPA ratios compared to peers in the NBFC space. The company operates 4,192 branches providing broader coverage and market penetration across India.
Conclusion
Bajaj Finance's remarkable 20-year journey from sub-₹1 to ₹1,042 all-time high, backed by exceptional Q1 FY26 fundamentals showing 22% PAT growth and strong Q2 provisional update with 24% AUM growth, validates the sustained growth thesis. Customer franchise expansion to 110.64 million and AUM reaching ₹4.62 lakh crore demonstrate market leadership. Multiple support levels at ₹975, ₹850, and ₹700 provide attractive accumulation opportunities. Q2 results scheduled for month-end could be the next catalyst for ₹1,160 target. Stock remains a core NBFC holding with strong fundamentals supporting premium valuation.
Disclaimer: tinyurl.com
Fundamental Analysis

DLF: Resistance Turned Support Awaits Q2 CatalystTechnical Analysis
DLF has demonstrated an impressive bullish rally over the past decade, transforming from below ₹100 to reaching an all-time high of ₹968 by April 2024 - representing an exceptional 9.7x growth in 10 years.
Post the peak, the stock entered a corrective phase, falling to ₹600 levels while forming lower lows and lower highs. The last lower high at ₹720 was decisively taken out with super positive Q4 results, propelling the stock to ₹887.
However, negative Q1 FY26 results triggered another fall, bringing the stock back to test the ₹720 level - which acted as resistance earlier. Currently trading at ₹740, this critical level transformation from resistance to support will determine the next directional move.
With Q2 results announcement scheduled this month, this presents a crucial catalyst. Positive results could validate the support and trigger the next rally.
Entry Strategy: Enter only post Q2 results if positive and ₹720 support holds with bullish confirmations.
Targets:
Target 1: ₹800
Target 2: ₹880
Target 3: ₹960 (All-Time High)
Stop Losses:
Critical Support: ₹720 (previous resistance, now key support)
If ₹720 level doesn't sustain or results disappoint expectations, no more expectations on this stock.
FY25 Financial Highlights (vs FY24 & FY23)
Total Income: ₹7,994 Cr (↑ +24% YoY from ₹6,427 Cr; ↑ +40% from FY23 ₹5,695 Cr)
Total Expenses: ₹5,885 Cr (↑ +37% YoY from ₹4,303 Cr; ↑ +48% from FY23 ₹3,969 Cr)
Financing Profit: ₹2,109 Cr (↓ -1% YoY from ₹2,124 Cr; ↑ +22% from FY23 ₹1,726 Cr)
Profit Before Tax: ₹2,261 Cr (↑ +5% YoY from ₹2,151 Cr; ↑ +51% from FY23 ₹1,502 Cr)
Profit After Tax: ₹4,367 Cr (↑ +60% YoY from ₹2,724 Cr; ↑ +115% from FY23 ₹2,034 Cr)
Diluted EPS: ₹17.64 (↑ +60% YoY from ₹11.02; ↑ +115% from FY23 ₹8.22)
Fundamental Highlights
DLF delivered exceptional FY25 performance with PAT surging 60% to ₹4,367 crore and EPS growth of 60% to ₹17.64, demonstrating strong operational leverage. The company achieved record sales bookings of ₹21,223 crore in FY25, up 44% YoY.
Q1 FY26 results showed 18% profit growth to ₹763 crore with revenue doubling to ₹2,717 crore. Market cap stands at ₹1,83,470 crore with promoter holding at 74.1%. The company has set ambitious target to cross annual rental income of ₹10,000 crore in medium-term from commercial properties.
DLF plans ₹17,000 crore residential projects launch in FY26 and targets ₹20,000-22,000 crore in sales driven by strong demand in luxury segment. The company has 280 million square feet of development potential across residential and commercial segments.
Q4 FY25 posted robust 39% profit rise with 46% revenue growth, driven by record sales from luxury projects and steady rental performance. Analysts project rental income to grow at 11% annually over FY25-FY28, with JM Financial maintaining "Buy" rating at ₹1,000 target.
Listed developers including DLF are set for strong Q2 earnings with resilient pre-sales and margin growth. The company is on track to meet or beat FY26 pre-sales guidance despite seasonal monsoon weakness, backed by strong launch pipeline.
Conclusion
DLF's remarkable 10-year journey from sub-₹100 to ₹968 all-time high, backed by exceptional FY25 fundamentals showing 60% PAT growth and record ₹21,223 crore bookings, validates the long-term growth thesis. The critical ₹720 resistance-to-support transformation awaits Q2 results catalyst for direction. Ambitious ₹10,000 crore rental income target, ₹17,000 crore FY26 project pipeline, and 280 million sq ft development potential provide strong visibility. Technical setup favors ₹960 retest if Q2 results are positive and ₹720 support holds.
Disclaimer: tinyurl.com

ZECUSDT - HOLDING STRONG AMID MARKET WIDE LIQUIDATIONSSymbol - ZECUSDT
CMP - 267.18
ZECUSDT has demonstrated notable resilience amid the broader cryptocurrency market downturn, which triggered over $10 billion in long position liquidations. Even in such an environment, certain assets have managed to withstand the selling pressure.
The cryptocurrency market remains gripped by panic and widespread liquidations, with Bitcoin currently testing the 100K level under intense selling pressure. However, amidst this turmoil, a few altcoins have shown relative strength - ZECUSDT being one of them as it continues to climb and test key resistance zones.
ZEC experienced a sharp decline earlier but found strong demand near the high volume node around 145 - 155. The subsequent aggressive rebound indicates the presence of solid bullish interest at these levels.
Resistance levels: 280.30, 305.65
Support levels: 242.64, 208.76
Focus remains on the 280.20 trigger zone. If the current retest does not result in a deep pullback and price consolidates near resistance, the likelihood of a breakout increases substantially. A decisive close above 280.30 - 280.50 could open the path for a rally toward 305 - 345. That said, it remains a high-risk setup, and traders are advised to exercise caution and maintain tight stoploss.

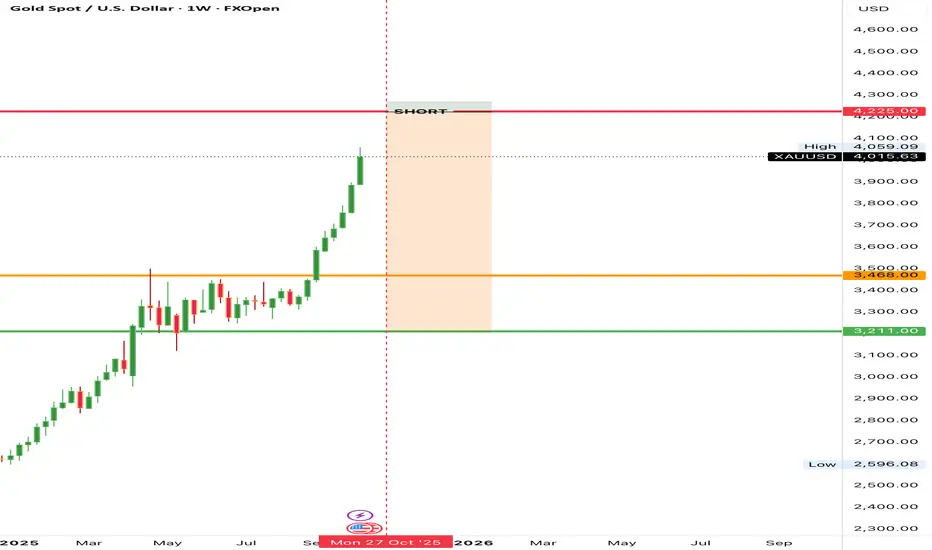
XAUUSD – Continues to set ATH XAUUSD – Continues to set ATH, prioritise buying according to POC 4,146–4,148 🟡
Gold continues to make higher highs after a strong rise in the Asian session; the upward channel structure remains intact. On H1, POC ~4,147–4,148 is the nearest support point; above is the resistance cluster according to FE 1.618 ~4,186 and the sell zone 4,221–4,240.
Key levels
Support: 4,146–4,148 (POC) • 4,140 (short-term invalid).
Resistance/targets: 4,166 • 4,186 (FE 1.618) • 4,188–4,200 • 4,221 (sell scalping) • 4,240 (sell zone).
Trading scenarios
Buy 1 – POC pullback
Entry 4,146–4,148 | SL 4,140 | TP 4,166 → 4,188 → 4,200 → 4,245.
If it pulls back to POC and H1 shows a confirmation candle/mid-trendline support, prioritise buying.
Buy 2 – Shallow retest
If the price only dips ~4,160–4,162 then rebounds above POC, additional buying is possible with SL 4,152, TP as above.
Sell reaction (higher risk)
Entry 4,240 | SL 4,250 | TP 4,222 → 4,200 → 4,188 → 4,160.
Only trigger when there is a clear rejection signal at 4,221–4,240; this is a counter-trend trade.
Invalidation & management
Buying bias weakens when H1 closes below 4,140 or breaks the lower channel edge.
After TP1, move SL to entry; avoid chasing price in the 4,18x–4,20x area when volume is thin. 🎯
Quick context
The upward momentum is maintained due to expectations of the Fed ending QT/looser conditions and safe haven flows; however, the 4,221–4,240 area may create a short-term reaction before the uptrend continues.
Trade well with this scenario!

Who I'm Betting On Amid U.S.–China Trade TensionsThe Redoubling is my own research project, which is designed to answer the following question: How long will it take me to double my capital? Each article will focus on a different company that I've added to my model portfolio. I'll use the close price of the last daily candle on the day the article is published as the initial buy limit price. I'll make all my decisions based on fundamental analysis. Furthermore, I'm not going to use leverage in my calculations, but I'll reduce my capital by the amount of commissions (0.1% per trade) and taxes (20% capital gains and 25% dividend). To find out the current price of the company's shares, just click the Play button on the chart. But please use this stuff only for educational purposes. Just so you know, this isn't investment advice.
Here is a company overview of Silergy Corp. (Ticker: TWSE:6415 )
1. Main areas of activity Silergy Corp. is a fabless analog / mixed‑signal integrated circuit (IC) design company, with core strength in power management, signal-chain, and analog ICs used across consumer, industrial, automotive and computing segments. It positions itself with a “virtual IDM” model (i.e. outsourcing wafer fabrication while internally handling design, integration, and system-level functions).
2. Business model Silergy operates on a fabless IC design + licensing / product sales model. It designs analog, mixed-signal, and power-management chips, outsources manufacturing to foundries, then sells the finished ICs (and related services, such as reference designs, simulation tools, technical support). Its customers tend to be OEMs in consumer electronics, automotive, industrial applications, and computing, giving it a B2B business model.
3. Flagship products or services Key product lines include DC–DC regulators, AC/DC converters, power modules, LED drivers, battery management ICs, and signal chain devices (e.g. analog front ends). One notable acquisition is Teridian Semiconductor from Maxim, giving Silergy capabilities in energy‑metering / smart metering ICs. Silergy also invests heavily in R&D (with many engineers) and offers design / simulation support for its customers.
4. Key countries for business While headquartered (and significantly centered) in China (Hangzhou), Silergy also maintains key technology presence in Taiwan (its listing jurisdiction) and in the United States (technology / design offices in Santa Clara, CA). Given its customer base, it likely sells into global electronics markets (Asia, North America, Europe) through its design center networks.
5. Main competitors Silergy competes with global analog / power IC firms such as Texas Instruments, Infineon, ON Semiconductor, Analog Devices, Maxim Integrated (now part of Analog Devices), and other rising Chinese analog IC challengers. In particular, in the PMIC (power management IC) segment, these established global firms are strong incumbents.
6. External and internal factors contributing to profit growth External factors:
Rising demand for power-efficient devices (smartphones, IoT, electric vehicles, renewable energy systems) increases demand for analog / power management ICs.
Global electrification / green energy trends (e.g. energy management, battery systems) create new addressable markets.
The push for regional supply chain localization (e.g. China’s desire for domestic semiconductor capability) could favor Silergy.
Industry cycle recovery in semiconductors may lift demand and pricing conditions.
Internal factors:
Deep R&D investment and engineering talent allow Silergy to bring differentiated designs and higher integration.
Acquisition of Teridian gives it new capabilities and market reach in energy metering / smart grid space.
Its virtual IDM model keeps capital expenditure lower (no major fabs) and allows flexibility in scaling.
Strong relationships with foundries and customers, and its reference design / support offerings, can lock in customers and generate recurring design wins.
7. External and internal factors contributing to profit decline External factors:
Intense competition from entrenched analog / power IC giants that have scale, brand, and ecosystem advantages.
Price pressure in commoditized analog / power segments.
Volatility in semiconductor industry cycles, supply chain disruptions, or foundry capacity constraints.
Regulatory / geopolitical risks (e.g. U.S. export restrictions on advanced semiconductor tech to China) could hamper access or partnership.
Currency fluctuations, especially between TWD, USD, and RMB.
Internal factors:
Dependence on external foundries introduces operational and supply risks.
High R&D and design costs must be offset by sufficient sales volume; design failures or delayed product launches can be costly.
Execution risk in scaling new products / markets (e.g. smart metering) may stretch management.
If margins erode due to pricing or competition, profitability could suffer.
8. Stability of management Executive changes over the past 5 years:
Silergy was founded by a group of Silicon Valley veterans; among its key executives are Chen Wei (Chairman) and You Budong (Co‑CEO). While public filings do not emphasize frequent CEO turnover, as a relatively young and growth semiconductor company, leadership continuity has been fairly stable. (I did not find widely publicized recent CEO or CFO shake‑ups.)
Impact on strategy, priorities, culture:
The relative management stability seems to have supported a long‑term R&D and growth orientation. The acquisition of Teridian, expansion into U.S. design centers, and continued investment in analog / power domains suggest management has prioritized technological scale and geographic reach. The continuity in leadership aids consistency in corporate strategy.
Why am I going to add this company to my model portfolio?
I see growth in both earnings per share and total revenue. However, the days sales outstanding ratio has not changed. Although operating, investing, and financing cash flows are volatile, the balance sheet remains solid. The debt-to-revenue ratio, current liquidity, and interest coverage are all strong. Additional indicators, such as growing return on equity, a stable gross margin, lower operating expenses, and good payment terms, confirm the company’s resilience. The P/E ratio is 33.332, which I consider acceptable, given the company’s growth; however, continued execution remains important. I did not find any critical news that could affect the company's existence. With a diversification coefficient of 20 and a current stock price that deviates by more than 16 EPS from its annual average, I will allocate 15% of my capital to this company. This balanced decision is based on growth indicators and a strong balance sheet while maintaining caution due to the risks related to the external factors.

Just Dial Ltd as of October 13, 2025, Earnings ForecastRecent Results & Financial Highlights (Q2 FY26 / 2025):
Q2 FY26 EPS: ₹18.12 (vs ₹8.44 Q2 FY25, strong YoY growth)
PAT (Q2 FY26): ₹159.67 crore (up ~1.31% QoQ)
EBIT Margin: 47.52% (improving trend, sector-leading)
Quarterly Revenue (Jun 2025): ₹425.19 crore (YoY up ~16%)
FY25 Revenue: ₹1,348.4 crore
FY25 Net Profit: ₹362.9 crore
TTM ROE: ~14–16% (Sector median: 10–13%)
P/E (Oct 2025): ~19.5
P/B: 1.76
P/S: 6.79
Market Cap: ~₹7,080 crore.
Earnings & Revenue Growth Projections:
Expected Revenue CAGR (next 2 years): ~8.6%
Projected FY26 Revenue:
1,348.4Cr×(1+0.086)=1,464.7Cr
Projected FY26 Net Profit (using stable margin of 27%):
1,464.7Cr×0.27=395.5Cr
Forward EPS FY26 (projected):
Shares outstanding ≈ 8.53 Cr
EPS 2026 = 8.53 / 395.5 = 46.36
Price Target Calculation (Fundamental Method):
Fair valuation forward P/E range: 18 (conservative) – 25 (bullish scenario; historical P/E reversion)
Projected price for FY26 (Dec 2026):
FY26
Conservative
EPS : 46.4
P/E : 18
Target Price ₹835
Mid / Reasonable
EPS : 46.4
P/E : 22
Target Price ₹1020
Bullish/Optimistic
EPS : 46.4
P/E : 25
Target Price ₹1160
2026 target: ₹1,324–1,523 (max: ₹2,750; min: ₹826).
Key Drivers & Risks:
Growth drivers: Digital ad demand, SME onboarding, omnichannel solutions, cost control, strong cash position, consistent profit delivery.
Risks: Slower SME digital spend, market share, competition from larger online models, execution risks in sales.
Just Dial has delivered robust earnings growth and strong margin expansion into FY25–26, with moderate revenue CAGRs. Price targets for 2026 are in the ₹835 (conservative) to ₹1,160 (bullish) band based on fundamental analysis, with analyst consensus higher at ₹1,324–1,523. The stock trades around fair value by several metrics, and offers moderate upside if profit growth persists with industry tailwinds. Risks center on revenue acceleration and execution.
Disclaimer: tinyurl.com

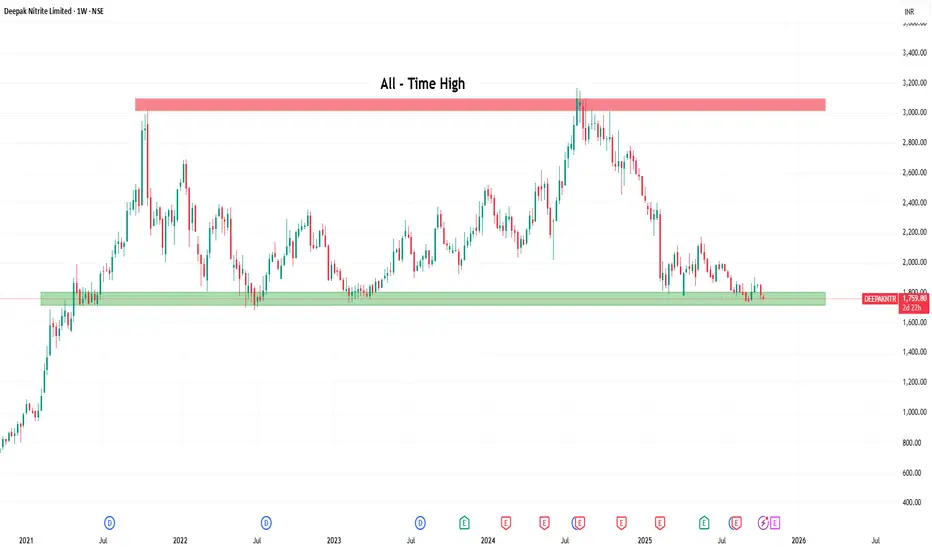
Deepak Nitrite Ltd: At a Crossroad After a Decade-long Rally🔍 Technical Analysis
Deepak Nitrite has experienced an extraordinary rally over the past decade—from below ₹100 to a peak near ₹3,000 in October 2021. The ₹3,000–₹3,200 zone has repeatedly acted as resistance, while the ₹1,700–₹1,800 range has served as a strong support zone. Currently, the stock trades around ₹1,760, hovering near that support.
Lately, fundamentals have decelerated: after years of strong growth until ~2022, the company has faced negative year-on-year profits in recent periods. This makes the current technical zone even more critical: any push above ₹2,000 could reignite a rally, but entry should be confirmed with improving financials.
Targets:
Target 1: ₹2,300
Target 2: ₹2,600
Target 3: ₹3,000
If the ₹1,700–₹1,800 zone fails to hold, the bullish thesis would be invalidated—expect limited upside in that case.
💰 FY25 Financial Highlights (vs FY24 & FY23)
Total Income: ₹8,282 Cr (↑ ~7.8% vs ₹7,682 Cr; ↑ ~8% vs ₹7,972 Cr)
Total Expenses: ₹7,682 Cr (essentially flat vs FY24; declined vs FY23)
Profit Before Tax: ₹953 Cr (↓ vs ₹1,102 Cr in FY24; ↓ vs ₹1,146 Cr in FY23)
Profit After Tax: ₹697 Cr (↓ from ₹811 Cr in FY24 and ₹852 Cr in FY23)
EPS: ₹51.12 (down from ₹59.45 in FY24 and ₹62.47 in FY23)
📌 Despite revenue growth, margins and net profits have contracted, under pressure from rising costs and operating inefficiencies.
🧠 Fundamental Highlights
The company has committed to a ₹8,500 Cr investment in PC resin/phenol capacity, aiming to vertically integrate and reduce dependency on external suppliers.
FY25 saw an 8% rise in revenue, reaching ₹8,366 Cr. However, net profit dropped ~14% to ₹697 Cr due to cost pressures.
Margins under stress: Gross margins compressed as input costs increased—impacting profitability despite revenue gains.
Valuation & Sentiment: JM Financial continues to rate Deepak Nitrite as a Buy, keeping the target at ₹2,305 amid expectations of turnaround.
Dividend & Financial Position: The company retains modest dividend payouts (~0.4% yield) with a payout ratio around 13%.
Balance Sheet: In FY25, a significant jump in long-term debt to ₹1,267 Cr raised leverage risks vs prior years.
✅ Conclusion
Deepak Nitrite is perched at a pivotal level. While its long-term technical setup still holds promise, recent financial trends introduce caution. A break above ₹2,000 with improving fundamentals could trigger new upside, but a failure of the ₹1,700–₹1,800 support zone would cast doubt on future growth.
Bajaj Finance: All-Time High Breakout Powers Growth🔍 Technical Analysis
Bajaj Finance Limited showcases one of the most spectacular wealth creation stories in Indian equity markets. Over the past two decades, the stock has delivered an extraordinary super bullish rally from below ₹1 to creating an all-time high of ₹1,042 today - representing an exceptional 1,000x+ growth over 20 years.
The stock reached its all-time high at ₹1,042 today and has pulled back slightly to trade at ₹1,019. The previous Q1 FY26 results were positive, setting a strong foundation for continued momentum.
Key support levels are established at ₹975 (recent support), ₹850 (next support), and ₹700 (major demand zone). The stock offers multiple accumulation opportunities based on position sizing at any of these levels.
With Q2 results announcement scheduled for this month-end, this presents another crucial catalyst. If positive results continue, it could validate the breakout and trigger the next rally phase.
Entry Strategy: Start accumulating at current levels or on dips to support zones based on position sizing.
Targets:
Target 1: ₹1,080
Target 2: ₹1,120
Target 3: ₹1,160
Stop Losses:
Recent Support: ₹975
Next Support: ₹850
Major Demand: ₹700
If support levels and demand zone don't sustain, no more expectations on this stock.
💰 Q1 FY26 Financial Highlights (vs Q4 FY25 & Q1 FY25)
Total Income: ₹19,524 Cr (↑ +6% QoQ from ₹18,457 Cr; ↑ +21% YoY from ₹16,100 Cr)
Total Expenses: ₹5,992 Cr (↓ -1% QoQ from ₹6,026 Cr; ↑ +21% YoY from ₹4,956 Cr)
Operating Profit: ₹6,614 Cr (↑ +13% QoQ from ₹5,879 Cr; ↑ +21% YoY from ₹5,460 Cr)
Profit Before Tax: ₹6,368 Cr (↑ +13% QoQ from ₹5,647 Cr; ↑ +21% YoY from ₹5,265 Cr)
Profit After Tax: ₹4,765 Cr (↑ +5% QoQ from ₹4,546 Cr; ↑ +22% YoY from ₹3,912 Cr)
Diluted EPS: ₹7.56 (↑ +5% QoQ from ₹7.21; ↑ +20% YoY from ₹6.32)
🧠 Fundamental Highlights
Bajaj Finance delivered robust Q1 FY26 performance with 22% YoY net profit growth and strong operational metrics. The company reported exceptional Q2 FY26 provisional update showing strong growth momentum with AUM up 24% YoY and new loans up 26%.
Market cap stands at ₹6,45,116 crore (up 43.8% in 1 year) with annual revenue of ₹73,107 crore and profit of ₹17,633 crore. Promoter holding remains stable at 54.7%, indicating strong management confidence.
Customer franchise grew to 110.64 million as of September 30, 2025, from 92.09 million the previous year, representing significant 20.2% YoY growth. AUM climbed to ₹4.62 lakh crore in Q2 FY26, with quarterly increase of ₹20,800 crore, demonstrating robust business expansion.
New loans booked rose 26% YoY to 12.17 million in Q2 FY26, indicating strong origination activity. The deposit book continued expanding steadily to approximately ₹69,750 crore, providing stable funding base.
Asset quality remains superior with lower gross and net NPA ratios compared to peers in the NBFC space. The company operates 4,192 branches providing broader coverage and market penetration across India.
✅ Conclusion
Bajaj Finance's remarkable 20-year journey from sub-₹1 to ₹1,042 all-time high, backed by exceptional Q1 FY26 fundamentals showing 22% PAT growth and strong Q2 provisional update with 24% AUM growth, validates the sustained growth thesis. Customer franchise expansion to 110.64 million and AUM reaching ₹4.62 lakh crore demonstrate market leadership. Multiple support levels at ₹975, ₹850, and ₹700 provide attractive accumulation opportunities. Q2 results scheduled for month-end could be the next catalyst for ₹1,160 target. Stock remains a core NBFC holding with strong fundamentals supporting premium valuation.

DLF: Resistance Turned Support Awaits Q2 Catalyst🔍 Technical Analysis
DLF has demonstrated an impressive bullish rally over the past decade, transforming from below ₹100 to reaching an all-time high of ₹968 by April 2024 - representing an exceptional 9.7x growth in 10 years.
Post the peak, the stock entered a corrective phase, falling to ₹600 levels while forming lower lows and lower highs. The last lower high at ₹720 was decisively taken out with super positive Q4 results, propelling the stock to ₹887.
However, negative Q1 FY26 results triggered another fall, bringing the stock back to test the ₹720 level - which acted as resistance earlier. Currently trading at ₹740, this critical level transformation from resistance to support will determine the next directional move.
With Q2 results announcement scheduled this month, this presents a crucial catalyst. Positive results could validate the support and trigger the next rally.
Entry Strategy: Enter only post Q2 results if positive and ₹720 support holds with bullish confirmations.
Targets:
Target 1: ₹800
Target 2: ₹880
Target 3: ₹960 (All-Time High)
Stop Losses:
Critical Support: ₹720 (previous resistance, now key support)
If ₹720 level doesn't sustain or results disappoint expectations, no more expectations on this stock.
💰 FY25 Financial Highlights (vs FY24 & FY23)
Total Income: ₹7,994 Cr (↑ +24% YoY from ₹6,427 Cr; ↑ +40% from FY23 ₹5,695 Cr)
Total Expenses: ₹5,885 Cr (↑ +37% YoY from ₹4,303 Cr; ↑ +48% from FY23 ₹3,969 Cr)
Financing Profit: ₹2,109 Cr (↓ -1% YoY from ₹2,124 Cr; ↑ +22% from FY23 ₹1,726 Cr)
Profit Before Tax: ₹2,261 Cr (↑ +5% YoY from ₹2,151 Cr; ↑ +51% from FY23 ₹1,502 Cr)
Profit After Tax: ₹4,367 Cr (↑ +60% YoY from ₹2,724 Cr; ↑ +115% from FY23 ₹2,034 Cr)
Diluted EPS: ₹17.64 (↑ +60% YoY from ₹11.02; ↑ +115% from FY23 ₹8.22)
🧠 Fundamental Highlights
DLF delivered exceptional FY25 performance with PAT surging 60% to ₹4,367 crore and EPS growth of 60% to ₹17.64, demonstrating strong operational leverage. The company achieved record sales bookings of ₹21,223 crore in FY25, up 44% YoY.
Q1 FY26 results showed 18% profit growth to ₹763 crore with revenue doubling to ₹2,717 crore. Market cap stands at ₹1,83,470 crore with promoter holding at 74.1%. The company has set ambitious target to cross annual rental income of ₹10,000 crore in medium-term from commercial properties.
DLF plans ₹17,000 crore residential projects launch in FY26 and targets ₹20,000-22,000 crore in sales driven by strong demand in luxury segment. The company has 280 million square feet of development potential across residential and commercial segments.
Q4 FY25 posted robust 39% profit rise with 46% revenue growth, driven by record sales from luxury projects and steady rental performance. Analysts project rental income to grow at 11% annually over FY25-FY28, with JM Financial maintaining "Buy" rating at ₹1,000 target.
Listed developers including DLF are set for strong Q2 earnings with resilient pre-sales and margin growth. The company is on track to meet or beat FY26 pre-sales guidance despite seasonal monsoon weakness, backed by strong launch pipeline.
✅ Conclusion
DLF's remarkable 10-year journey from sub-₹100 to ₹968 all-time high, backed by exceptional FY25 fundamentals showing 60% PAT growth and record ₹21,223 crore bookings, validates the long-term growth thesis. The critical ₹720 resistance-to-support transformation awaits Q2 results catalyst for direction. Ambitious ₹10,000 crore rental income target, ₹17,000 crore FY26 project pipeline, and 280 million sq ft development potential provide strong visibility. Technical setup favors ₹960 retest if Q2 results are positive and ₹720 support holds.

Part 12 Trading Master Class With Experts Common Option Trading Strategies
Options can be combined in different ways to create strategies with defined risk and reward profiles.
Some popular strategies include:
Covered Call – Holding a stock and selling a call option on it (income strategy).
Protective Put – Holding a stock and buying a put to protect downside risk.
Straddle – Buying both call and put at the same strike to profit from big moves.
Strangle – Similar to a straddle, but strikes are different.
Iron Condor – Selling both a call and a put spread to profit from a sideways market.

Akzo Nobel India Ltd Fundamental analysis on OvervaluedHere’s a fundamental analysis of AKZOINDIA (Akzo Nobel India Ltd), calculation of its fair value, and a verdict versus the current market price:
Key Fundamentals (Oct 2025)
Market Price: ₹3,341
EPS (TTM): ₹88.93
P/E Ratio: 37.4×
Book Value/Share: ₹291.8
P/B Ratio: 11.6×
Dividend Yield: ~2.99%
ROE: 32.3%
ROCE: ~39.9%
Operating Margin: 15.7%
Sales (TTM): ₹4,050 crore
Net Profit (TTM): ₹405 crore
1. PE Based Fair Value Calculation
EPS (TTM): ₹88.93
Sector median PE: 30× (Paints sector 25–35×)
Current Market Price: ₹3,340
Fair Value=EPS × Sector PE
Fair Value = 88.93 × 30 = ₹2,678
Fair Value=88.93×30=₹2,678
2. Historical Median PE Calculation
-AKZOINDIA’s 5-year median PE: 31×
Fair Value = EPS × Median PE
Fair Value = 88.93 × 31 = ₹2,757
3. Discounted Cash Flow (DCF) Calculation
Analyst DCF intrinsic value zone: ₹1,350–₹1,950
Let’s use midpoint:
DCF Fair Value (mid)=₹1,650
All calculation models show AKZOINDIA’s market price is 20–150% above its fair fundamental value.
Strong ROE and dividend ensure some premium, but current levels offer little margin of safety.
If you apply conservative sector or historical multiples, fair value is near ₹2,600–₹2,800./list]
4. Profit Booking Alert
Price at ₹3,340 = 21–43% above calculated fair value. Consider partial booking or wait for correction if fundamentals don’t justify ongoing high PE.
Disclaimer: tinyurl.com

Part 2 Support and Resistance Why Traders Use Options
Options are versatile instruments. Traders use them for:
Speculation – Betting on price movement to earn profits.
Hedging – Protecting existing investments from adverse price moves.
Income Generation – Selling options (writing) to earn the premium.
For example:
A trader may buy a call option expecting prices to rise.
A portfolio manager may buy put options to protect their stocks from falling prices.
An experienced investor may sell covered calls to earn regular income.

XAUUSD – Liquidity Sweep “Flush”XAUUSD – Liquidity Sweep “Flush”; prioritise trading around key zones 🟡
Gold just dropped nearly 90 points during the Asian session – a time typically lacking volume, resulting in a “flush” that wiped out many leveraged positions. The larger trend remains bullish, but short-term risks of a deep pullback are present before the European–American markets engage.
The accompanying image shows:
Price peaked and then broke the upper edge of the H1 uptrend channel → quickly fell to the mid-channel zone.
Thick Volume Profile cluster around 4.07x, POC ~4,075; below lies VAL ~4,025.
Sell retest zone marked around 4.14x; grey boxes indicate buy zones at 4,075 and 4,056.
Key Levels
Resistance: 4,143–4,150, 4,122, 4,160.
Support: 4,075 (POC), 4,056 (buy scalping), 4,025 (VAL).
Scalping watch: 4,057 – 4,085 – 4,160 – 4,025.
Trading Scenarios
SELL retest (reaction, higher risk)
Entry: 4,143
SL: 4,150
TP: 4,122 → 4,105 → 4,078 → 4,050
Idea: activate only upon clear rejection at 4.14x (long wick/engulfing H1).
BUY at POC zone
Entry: 4,075
SL: 4,067
TP: 4,089 → 4,100 → 4,122 → 4,155
BUY scalping (shallow pullback)
Entry: 4,056
SL: 4,049–4,050
TP: 4,075 → 4,089
Invalidation: short-term buy bias weakens if H1 closes below ~4,025 (VAL). If this zone breaks, prioritise waiting for a failed retest to consider selling with the continued downtrend.
Practical Notes
The range is currently very wide; the European session will increase volume, making false breaks more likely.
After TP1, move SL to entry to secure the position.
Sell orders are merely reaction trades at 4.14x; prioritise buy-the-dip at 4,075/4,056 upon confirmation signals.

MAHSCOOTER Price ActionAs of August 29, 2025, Maharashtra Scooters Limited is trading around ₹15,722, having posted a gain of nearly 5.5% over the past month and 18.5% in three months. The stock has maintained a strong uptrend for over a year, nearly doubling from its 52-week low of ₹8,822 to a high of ₹16,315 during this period. Notably, its market capitalization is about ₹17,968 crore, ranking it highly in the holding company segment.
Technically, the price momentum is positive, trading close to resistance levels near ₹16,000. The short-term moving averages show mild volatility, but long-term signals remain bullish. Despite a very high price-to-earnings ratio above 73, investor interest is supported by consistent profitability, strong control over operating costs, and robust dividend payouts.
Financially, March quarter results reflect steady net sales growth with improved margins. The company continues to benefit from its stake in group entities and maintains a solid cash position with minimal debt. Although growth is modest, valuation remains expensive—a sign that further gains may be limited unless fundamentals accelerate or sector sentiment grows even more bullish. Risk levels are relatively low with support seen around ₹14,340, and the stock remains a hold for existing investors while aggressive new buying may need fresh earnings triggers.

ADANIPORTS Pice Action- The stock is trading around ₹1,438 as of mid-October 2025, with a day range from approximately ₹1,396 to ₹1,442.
- On a 52-week basis, the stock fluctuated between a low of about ₹995 and a high near ₹1,494, currently trading closer to its upper range.
- Market capitalization is around ₹3.1 lakh Crores, making it one of the largest port infrastructure companies in India.
- The PE ratio is about 27.5, reflecting a moderate valuation for a growing infrastructure sector leader.
- Book value per share is about ₹288, so the stock trades at approximately 5 times book value.
- Dividend yield is low, near 0.5%, consistent with reinvestment into growth.
- Recent quarterly results showed a 6.5% rise in net profit and a strong 31% increase in revenue year over year.
- The stock has demonstrated steady sales and profit growth over the past five years with roughly 23% CAGR in profits.
- Return on capital employed (ROCE) is approximately 13.8%, with return on equity (ROE) close to 18.8%, signaling efficient use of capital.
- The stock has shown volatility with daily price swings around 2%, reflecting sensitivity to macroeconomic factors and sector developments.
Overall, ADANIPORTS remains a strong performer in the infrastructure sector with solid fundamentals, consistent growth, and trading at a fair valuation reflecting its leadership in port and logistics services.

ADANIPOWER Price ActionAdani Power Ltd (ADANIPOWER) is currently trading near ₹154, having experienced a range between ₹148 and ₹156 in the last few sessions. The stock has been volatile, recovering quickly after a sharp correction at the end of September 2025, when it dropped from around ₹170 to ₹145 before stabilizing.
Trading volumes remain heavy, often exceeding 60 million shares on active days, reflecting strong investor interest and liquidity. The price quickly rebounded after the steep selloff in late September and early October, with daily swings of 2-5% being common. The recent momentum is slightly upward, though choppy, with brief profit-taking followed by renewed buying.
Overall, Adani Power shows short-term volatility within a broad uptrend established earlier in the year, featuring periods of sharp gains and corrections that align with sector and broader market sentiment shifts. The stock is actively traded and responsive to market news and institutional flows.

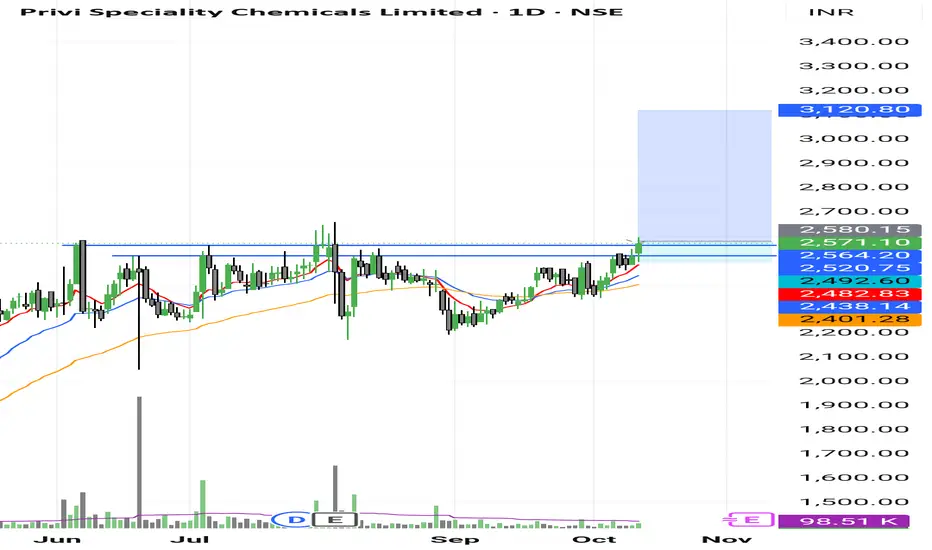
Look at this........i already make a entry 🧪 Fundamentals / Business Snapshot
What they do: Privi Speciality Chemicals is a major Indian manufacturer, exporter, and supplier of aroma & fragrance chemicals. Their capability includes many complex operations (distillation, condensation, hydrogenation etc).
Recent financials:
• In FY25, revenue rose ~ 19.9 % to ~ ₹2,101.19 crore from ~ ₹1,752.23 Cr prev year.
• Net profit nearly doubled—~ 97 % YoY to ~ ₹187.00 crore vs ~ ₹94.91 Cr the previous year.
• In the most recent quarter (Q1 FY26), revenue ~ ₹567.80 Cr (up ~21.7 % YoY), net profit ~ ₹61.93 Cr (up ~97.4 % YoY).
Margins / Efficiency:
• Operating / EBITDA margins have improved. For example, in recent quarters the OPM has been ~ 20-23 % in some reports.
• ROE recently ~ 16.94 % vs its 5-yr average ~11.8 %.
Risks / concerns:
• Some analysts / rating agencies see weaker long-term fundamentals: slow growth in net sales / operating profit over longer horizon, high debt/EBITDA in some reports.
• Commodity input risk, foreign exchange risk (since exports are significant), margin pressure possible. (General for speciality chemicals)
Competitive / strategic positives:
• Strong R&D, product mix improvements.
• Export orientation gives access to global markets.
---
📊 Technical / Price Action View
Current trend & moving averages: According to ETMoney, the stock is hovering around key moving averages: the 20, 50, 100, 200-day EMAs/SMAs are giving “neutral” signals in many cases.
Momentum indicators:
• RSI (14) ~ 48-50 area → neutral territory.
• MACD in some sources is slightly negative or weak → indicates not strong momentum up currently.
• Some resistance / support zones via pivot / classic technical tools: TipRanks shows pivot at ~ ₹2338, with resistance above and support below.
Recent behaviour:
• The stock has hit 52-week highs in recent past, showing strong sentiment after good results.
• However, price also seems to be consolidating / facing short-term corrections (QoQ revenue drops, expenses growth) in some quarters.
Part 6 Learn Institutional Trading Key Terminology in Option Trading
Before diving deeper, let’s understand some crucial terms used in options:
Underlying Asset: The financial instrument (like a stock, index, or commodity) on which the option is based.
Strike Price (Exercise Price): The price at which the underlying asset can be bought (for a call) or sold (for a put).
Expiration Date: The date when the option contract ends. After this date, the option becomes worthless if not exercised.
Option Premium: The price paid by the buyer to the seller for acquiring the option.
Intrinsic Value: The amount by which an option is in profit if exercised immediately.
Time Value: The extra value in the option premium due to time left before expiration.
In-the-Money (ITM): When the option already has intrinsic value (profitable if exercised now).
Out-of-the-Money (OTM): When the option has no intrinsic value.
At-the-Money (ATM): When the strike price equals the current market price of the underlying.
Example:
If a stock is trading at ₹1000 and you buy a call option with a strike price of ₹950, your option is in the money.
If you buy a call with a strike price of ₹1050, it’s out of the money.

XAU/USD: GOLD HITS NEW ATH! Buy or Sell Now?Gold (XAU/USD) is absolutely on fire, hitting a Fresh All-Time High (ATH) this morning! This massive breakout isn't random; it's a direct outcome of global risk factors lining up, making gold the ultimate safe haven:
🇺🇸🇨🇳 Trade War Reloaded: Trump's shocking 100% tariff threat on China exports has brought back major global uncertainty. Though he's softened his tone, the damage to sentiment is done, pushing money into gold.
⚠️ Geopolitical Heat: Warnings about sending Tomahawk missiles to Ukraine keep geopolitical tensions brewing, acting as a continuous tailwind for the metal.
🏛️ US Shutdown Drama: The ongoing US government funding deadlock is a big worry, further driving flight-to-safety flows.
✂️ Fed Rate Cut Confidence: High probability of Fed rate cuts in Oct/Dec (96%/87%) provides strong support, reducing the opportunity cost of holding non-yielding gold.
🔍 TECHNICAL ANALYSIS: Structure is Full-On BULLISH!
The price action today is textbook, showing exactly how Smart Money operates:
Liquidity Sweep & FVG: Price first wicked sharply below 4000 for a classic Liquidity Sweep—hunting weak hands' Stop-Losses—and created a temporary Fair Value Gap (FVG), before reversing with massive momentum.
Structural Break (BOS & MSS): This aggressive move resulted in a clean Break of Structure (BOS) above the old ATH at 405x, confirming a major Market Structure Shift (MSS). The trend is now unequivocally BULLISH.
Trading Plan - The Right Way:
Priority: Stick with BUY positions! The bias remains bullish as long as price holds above the Order Block (OB) support at 405x. This is the key level.
Big Warning: Don't try to short the top (sell dò đỉnh)! The risk of getting caught in a liquidity grab or price trap at these highs is extremely high. Stay away from counter-trend moves.
Sell Scenario (Only if): We only consider a short-term SELL if there's a strong, confirmed candle close below 405x. In that case, we might target a minor pullback to 4000 for profit booking, but the main goal remains to BUY on dips.
👉 Bottom Line: Fundamentals and technicals are singing the same tune. 405x is the line in the sand. Trade carefully, manage your stop-loss, and always do your own research (DYOR).
#GOLD #XAUUSD #ATH #MarketUpdate #TradeWar #FED #SmartMoney #ICT #TechnicalAnalysis #SafeHaven #DYOR

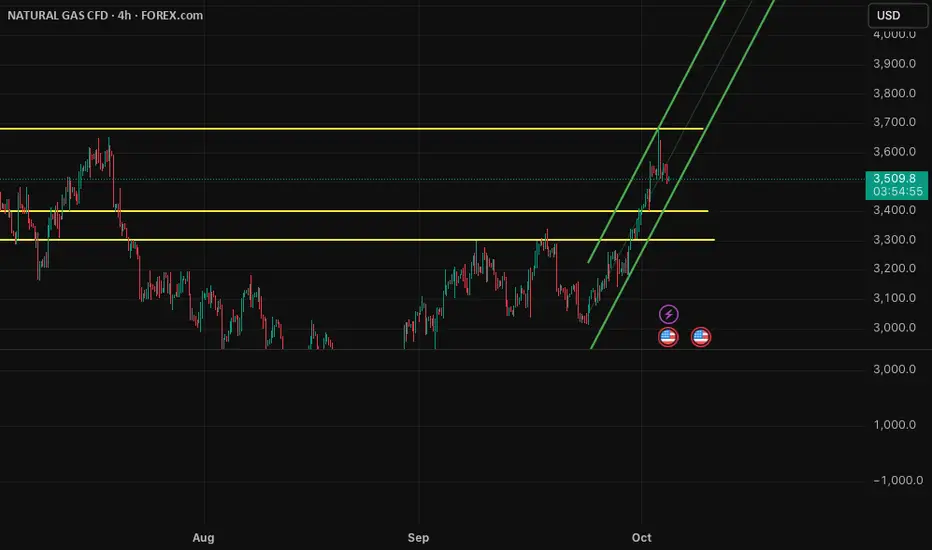
NG Price (FOREXCOM) Outlook: Potential Drop Toward 3.400–3.300Natural gas surged to 3.682 (FOREXCOM CFD), supported by yesterday’s inventory drop and the short-term cold weather forecast.
However, in the short term, if weather conditions normalize, we may see downward pressure on NG prices, with potential retracements to 3.400 and further to 3.300 levels.
LiamTrading – GOLD: Continuing the trend towards 4,130Gold has broken 4,060 and set a new historical peak thanks to the US-China trade tensions and the expectation of an early Fed rate cut. The main trend remains upward; the next target level according to the channel structure is 4,130.
Technical H4→H1
The upward channel has been maintained for several weeks; breaking 4,060 confirms continuation.
Nearest liquidity zone: 4,030–4,032.
Medium-term volume POC: ~3,988.
Target/resistance clusters by rhythm: 4,050 → 4,072 → 4,088 → 4,100 → 4,130.
Trading Plan
Buy 1 (retracing to the liquidity zone)
Entry: 4,030–4,032
SL: 4,025
TP: 4,050 → 4,072 → 4,088 → 4,100 → 4,130
Buy 2 (medium-term POC)
Entry: 3,988
SL: 3,980
TP: 4,022 → 4,050 → 4,088 → 4,100 → 4,130
Sell reaction (higher risk)
Entry: 4,130
SL: 4,140
TP: flexible according to price reaction; prioritize closing at 4,070 if a clear rejection candle appears.
Invalidation: short-term upward structure weakens if H1 closes below 3,980.
Quick Notes
Prioritize “buy-the-dip” at 4,03x and 3,988; sell orders are only reaction trades at 4,130.
When TP1 is reached, move SL to entry to protect the position.
Volatility around US data release times may create false breaks; maintain disciplined risk management.
I will provide immediate updates as price paths change, real-time trading is the best way to be accurate and successful.

Technical Indicators 1. Introduction to Technical Indicators
Technical indicators are mathematical calculations based on historical price, volume, or open interest data. They are primarily used in technical analysis, a method of evaluating securities by analyzing market statistics rather than intrinsic value.
Indicators help traders:
Identify trends and reversals.
Determine momentum and market strength.
Recognize overbought or oversold conditions.
Generate buy or sell signals.
There are three main categories of technical indicators:
Trend Indicators – Identify the direction and strength of a trend.
Momentum Indicators – Measure the speed and force of price movements.
Volume Indicators – Analyze trading activity to confirm price movements.
Some indicators are leading, giving early signals of potential price movement, while others are lagging, confirming trends after they have started.
2. Trend Indicators
Trend indicators help traders identify whether an asset is moving upward, downward, or sideways. Recognizing trends early allows traders to align their strategies with the market direction.
2.1 Moving Averages (MA)
Moving averages smooth out price data to reveal trends over a specific period. There are two main types:
Simple Moving Average (SMA):
Calculated by averaging the closing prices over a specified period.
Example: A 50-day SMA sums the last 50 closing prices and divides by 50.
Exponential Moving Average (EMA):
Places more weight on recent prices, making it more responsive to price changes.
Applications:
Trend identification: Prices above the MA indicate an uptrend; below indicate a downtrend.
Crossovers: A short-term MA crossing above a long-term MA generates a bullish signal, and vice versa.
Limitations:
Lagging indicator, less effective in sideways markets.
2.2 Moving Average Convergence Divergence (MACD)
MACD measures the difference between two EMAs (usually 12-day and 26-day).
Components:
MACD Line: Difference between the fast and slow EMA.
Signal Line: 9-day EMA of the MACD line.
Histogram: Difference between MACD line and Signal line.
Interpretation:
Crossovers: MACD crossing above Signal line = buy signal; below = sell signal.
Divergence: Price making new highs while MACD fails indicates trend weakness.
Strengths:
Effective for spotting trend reversals and momentum shifts.
Weaknesses:
Lagging indicator; may give false signals in choppy markets.
2.3 Average Directional Index (ADX)
ADX measures the strength of a trend regardless of its direction.
Values above 25 indicate a strong trend.
Values below 20 suggest a weak trend or sideways market.
Applications:
Confirming trend strength before entering a trade.
Pairing with other indicators for trend-following strategies.
Limitations:
Does not indicate trend direction, only strength.
3. Momentum Indicators
Momentum indicators assess the speed of price movements, helping traders identify potential reversals or continuation patterns.
3.1 Relative Strength Index (RSI)
RSI measures the magnitude of recent price changes to evaluate overbought or oversold conditions.
Values above 70 = overbought (possible reversal or pullback).
Values below 30 = oversold (possible rebound).
Applications:
Divergence between RSI and price signals potential trend reversals.
Combining RSI with trend indicators enhances trade accuracy.
Limitations:
Can remain overbought or oversold for extended periods in strong trends.
3.2 Stochastic Oscillator
The stochastic oscillator compares a security’s closing price to its price range over a specific period.
%K Line: Current close relative to the high-low range.
%D Line: 3-period moving average of %K.
Interpretation:
Values above 80 = overbought; below 20 = oversold.
Crossovers of %K and %D lines indicate potential buy/sell signals.
Strengths:
Effective in volatile markets for timing entries and exits.
Weaknesses:
Less effective during strong trends; prone to false signals.
3.3 Rate of Change (ROC)
ROC measures the percentage change in price over a given period.
Positive ROC indicates upward momentum.
Negative ROC signals downward momentum.
Applications:
Identifying early trend reversals.
Confirming breakouts or breakdowns.
Limitations:
Sensitive to price spikes; may give false signals in choppy markets.
4. Volume Indicators
Volume analysis confirms price trends, as strong moves are typically accompanied by high volume.
4.1 On-Balance Volume (OBV)
OBV measures cumulative buying and selling pressure by adding volume on up days and subtracting volume on down days.
Applications:
Divergence between OBV and price can signal reversals.
Confirming trend strength.
Limitations:
Lagging indicator; requires combination with price analysis.
4.2 Chaikin Money Flow (CMF)
CMF measures the volume-weighted average of accumulation and distribution over a specified period.
Positive CMF = buying pressure.
Negative CMF = selling pressure.
Applications:
Identifying accumulation or distribution phases.
Supporting trade entries in trend-following strategies.
Weaknesses:
Less effective during low-volume periods.
5. Volatility Indicators
Volatility indicators help traders gauge market risk and potential price swings.
5.1 Bollinger Bands
Bollinger Bands consist of a moving average (middle band) and upper/lower bands based on standard deviation.
Price near upper band = overbought.
Price near lower band = oversold.
Applications:
Trading range-bound markets using band bounces.
Breakouts indicated when price moves outside bands.
Limitations:
Band breakouts don’t always result in sustained trends.
5.2 Average True Range (ATR)
ATR measures market volatility by calculating the average of true price ranges over a period.
Applications:
Setting stop-loss levels.
Identifying breakout potential.
Limitations:
Does not indicate trend direction, only volatility.
6. Combining Indicators for Strategy
Using a single indicator often results in false signals. Effective traders combine indicators from different categories:
Trend + Momentum:
Example: Use SMA to identify trend direction and RSI to detect overbought/oversold conditions.
Trend + Volume:
Example: Confirm trend strength with ADX and OBV before entering a trade.
Momentum + Volatility:
Example: Use MACD for momentum and ATR to set stop-loss levels.
Rule of Thumb:
Avoid indicators that provide the same information.
Mix leading and lagging indicators for better confirmation.
7. Indicator-Based Trading Strategies
7.1 Trend-Following Strategy
Use moving averages or ADX to identify trends.
Enter trades in the direction of the trend.
Use momentum indicators like MACD or RSI for entry timing.
7.2 Reversal Strategy
Use RSI, Stochastic, or Bollinger Bands to detect overbought/oversold conditions.
Look for divergence between price and indicator for potential reversals.
7.3 Breakout Strategy
Use Bollinger Bands or price channels to identify consolidation.
Volume indicators like OBV or CMF confirm breakout strength.
8. Common Mistakes in Using Indicators
Overloading charts: Too many indicators can confuse signals.
Ignoring market context: Indicators must be interpreted in conjunction with price action.
Blind reliance: No indicator guarantees success; risk management is crucial.
Neglecting timeframes: Indicators behave differently on daily, weekly, or intraday charts.
9. Advanced Indicator Techniques
Divergence Trading: Identifying differences between price and indicators like MACD or RSI to spot potential reversals.
Multiple Timeframe Analysis: Confirm signals from multiple timeframes to reduce false entries.
Weighted Indicators: Adjust indicator sensitivity to reduce lag or noise.
Algorithmic Integration: Using indicators as inputs in automated trading systems.
10. Choosing the Right Indicators
Factors to consider:
Trading style: Day traders vs. swing traders vs. long-term investors.
Market conditions: Trending vs. ranging markets.
Timeframe: Short-term indicators are more sensitive; long-term indicators reduce noise.
Simplicity: Choose a few reliable indicators rather than overwhelming charts.
11. Conclusion
Mastering technical indicators requires practice, observation, and discipline. While indicators provide valuable insights into market behavior, they are most effective when combined with strong risk management and a clear trading plan.
Successful traders:
Use indicators to enhance decision-making, not replace it.
Test strategies thoroughly before applying them in live markets.
Adapt indicator settings to suit different market conditions.
By understanding the nuances of trend, momentum, volume, and volatility indicators, traders can create robust strategies that increase probability and confidence in their trades. This Technical Indicators Masterclass equips traders with the knowledge to analyze markets effectively and navigate complex price movements with precision.

What if we are about to see some historical event!If Powell increased a sudden rate hike! We will see some historical event like 1980!
Just be aware of this!