BTCUSD Bitcoin USD has tried to take liquidity below the weekly FVG.After taking liquidity at the bottom, it turns bullish towards the top on demand at the bottom. After taking the liquidity of the niche, it can give an upward rally in the demand of the down. After taking the liquidity of the down, it can give an upward rally in the demand of the niche.
Fundamental Analysis

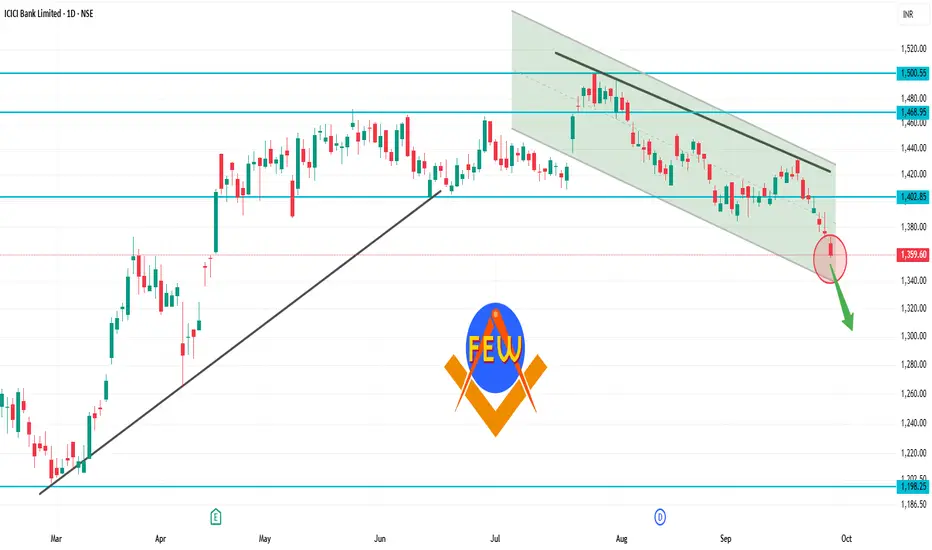
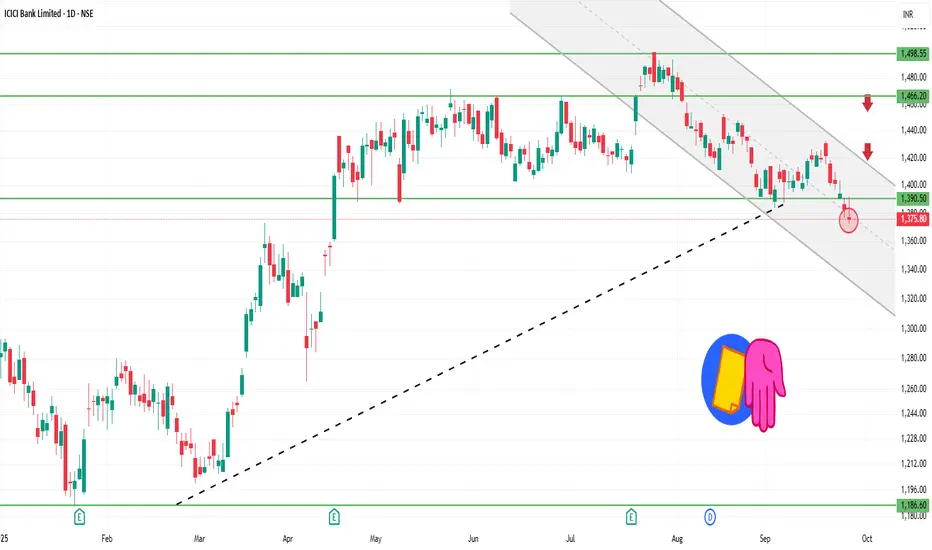
ICICIBANK 1D Time frameClosing Price: ₹1,363.00
Day's Range: ₹1,357.00 – ₹1,372.70
Previous Close: ₹1,375.80
Volume: 18,342,280 shares traded
Market Cap: ₹971,186 crore
52-Week High: ₹1,500.00
52-Week Low: ₹1,186.00
Face Value: ₹2.00
Beta: 0.90
🧾 Financial Highlights
P/E Ratio (TTM): 18.36
P/B Ratio: 3.12
EPS (TTM): ₹74.04
Dividend Yield: 0.81%
ROE: 17.05%
Book Value: ₹436.56
📈 Technical Insights
Trend: The stock is approaching its 200-day moving average, a key technical indicator. A bounce from this level could signal a buying opportunity, while a breakdown may suggest further downside risk.
Support Levels: ₹1,357.00, ₹1,350.00
Resistance Levels: ₹1,375.00, ₹1,400.00
📌 Key Takeaways
Recent Performance: ICICI Bank's stock declined by 0.91%, underperforming the broader market.
Analyst Sentiment: Despite recent volatility, ICICI Bank remains a top pick among analysts for long-term investment.
Part 4 Learn Institutional Trading 1. Introduction to Options and Their Importance
Financial markets have evolved to provide investors with a wide variety of tools to grow wealth, manage risk, and enhance returns. Among these tools, options stand out as one of the most versatile and powerful instruments.
Options belong to the family of derivatives, meaning their value is derived from an underlying asset such as a stock, index, commodity, or currency. Unlike direct ownership (buying a stock outright), options give the investor rights but not obligations, providing flexibility in trading.
Their importance lies in:
Allowing traders to profit in both rising and falling markets.
Offering leverage (control larger positions with smaller capital).
Serving as a hedging instrument to reduce portfolio risks.
Providing a platform for sophisticated strategies that balance risk and reward.
In today’s markets — whether on Wall Street, the NSE, or other global exchanges — option trading has grown from being a niche practice for institutional investors to a mainstream financial strategy accessible to retail traders as well.
2. Basic Concepts: Calls, Puts, and Premiums
At the core of option trading are call options and put options.
Call Option: A financial contract that gives the buyer the right (not obligation) to buy the underlying asset at a predetermined price (strike price) within a specific time frame.
Example: Buying a Reliance call at ₹2,400 strike allows you to buy Reliance shares at ₹2,400 even if the market price rises to ₹2,600.
Put Option: A contract that gives the buyer the right to sell the underlying asset at a fixed strike price within a specific time frame.
Example: Buying a Nifty put at 20,000 strike allows you to sell at 20,000 even if Nifty drops to 19,500.
Premium: The price paid by the option buyer to the seller (writer) for obtaining this right. Premiums are determined by factors like volatility, time to expiry, and demand-supply.
Strike Price: The fixed level at which the buyer can exercise the right.
Expiration Date: Options are time-bound contracts. At expiry, they either get exercised (if in the money) or expire worthless.
These basic concepts form the foundation of all option strategies and trading approaches.

Jobs vs. Inflation: Gold Steady Before PCE ShowdownHello, investors!
Gold saw only a marginal 0.1% gain, closing at $3,739.42/oz on September 25. This struggle was due to better-than-expected US jobs data (jobless claims dropped sharply), which slightly pared back the market's expectation for a Fed rate cut in October (down to 85%).
However, Gold maintains support from dovish Fed comments and potential political instability (like Trump's proposed 100% drug tariff). The entire market focus now shifts to today's (Sept 26) PCE Inflation Report.
Expert Alert: If the PCE data is hotter than anticipated, Gold could face sharp, temporary downward pressure.
Technical Analysis & Strategy
Gold is currently consolidating within a triangle pattern and has yet to break the $375x resistance. While more selling pressure is possible before the PCE release, the long-term trend remains bullish.
Outlook: Prioritize Buy if the price maintains above the Key Level $373x. If the news causes the price to break $373x, be ready to flip the strategy to Sell.
Key Resistance: $3755, $3768, $3778
Key Support: $3738, $3727, $3712
Suggested Trading Strategy (Strict Risk Management):
BUY SCALP
Zone: $3739 - $3737
SL: $3733
TP: $3742 - $3747 - $3752 - $3757 - $3767
BUY ZONE
Zone: $3704 - $3702
SL: $3694
TP: $3712 - $3722 - $3732 - $3742 - $3762
SELL ZONE
Zone: $3776 - $3778
SL: $3786
TP: $3768 - $3758 - $3748 - $3728 - $3708
The market is at a critical juncture. What is your game plan for today? 👇
#Gold #XAUUSD #PCE #Fed #Inflation #TradingView #ATH

EURUSD – Bearish Channel Continuation on H1EURUSD – Bearish Channel Continuation on H1
Market Overview
EURUSD continues to move steadily within a descending channel, confirming a bearish market structure. Recent recovery attempts have been capped at supply zones, while liquidity remains concentrated at lower price levels. As long as the pair trades inside this channel, the preferred strategy is to look for selling opportunities.
Technical Context
The bearish channel remains intact, with strong seller defence in the 1.1720–1.1790 zone.
Key resistance levels: 1.1753 and 1.1820. Only a clear break above 1.1820 would weaken the bearish scenario.
Downside liquidity targets sit around 1.1630, with extended potential toward 1.1575 if selling pressure accelerates.
Trading Scenarios
🔻 Priority – Sell Setups (with the channel trend)
Sell Setup 1
Entry: 1.1720 – 1.1730
Stop Loss: 1.1750
Take Profit: 1.1695 – 1.1670 – 1.1652 – 1.1630
Sell Setup 2
Entry: 1.1780 – 1.1790
Stop Loss: 1.1810
Take Profit: 1.1755 – 1.1730 – 1.1700 – 1.1675
🔹 Alternative – Buy Setup (countertrend, lower probability)
Buy Setup
Entry: 1.1630 – 1.1620
Stop Loss: 1.1600
Take Profit: 1.1660 – 1.1680 – 1.1700
Note: This setup is only valid if price tests the demand zone around 1.1620–1.1630, which could trigger a short-term corrective bounce.
Risk Management & Outlook
Primary Bias: Stay bearish while price action remains within the channel.
Invalidation: A confirmed H1/H4 close above 1.1820 invalidates the bearish view.
Target: A decisive breakdown below 1.1630 could pave the way towards 1.1575.
✅ Conclusion:
EURUSD remains in a clear downtrend. The main strategy is to sell rallies into resistance zones, targeting lower liquidity areas. Long positions can be considered only at strong demand levels, and should be treated as short-term corrective trades rather than a trend reversal.

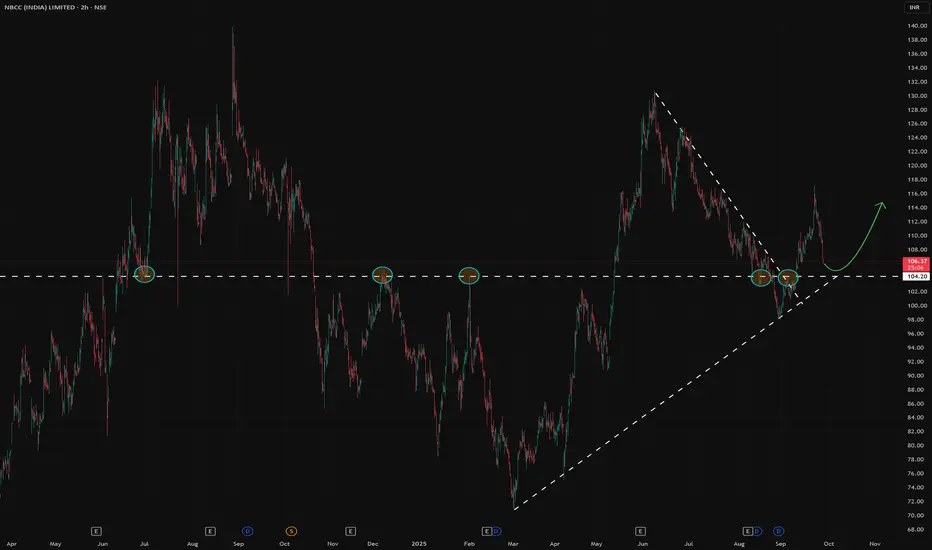
NBCC IN Long🇮🇳 #nbcc #invest
NBCC (India) Limited is an Indian state-owned company and a leader in the construction sector.
The company's operations are divided into three main segments:
Project Management and Consulting (PMC): This segment accounts for approximately 92% of revenue. This includes the redevelopment of old government quarters, project management in the institutional, residential, and industrial sectors, as well as infrastructure projects abroad (Mauritius, Maldives, Seychelles, and Dubai).
Engineering, Procurement, and Construction (EPC)
Real Estate Development
For the fiscal year ending March 2024, revenue was INR 106.67 billion, up 19.03% year-on-year.
The company has been debt-free for the past five years.
High multiples:
P/E 51
P/B 11
EV/EBITDA 28
OCF, FCF positive
We expect profit and revenue to continue to grow.
Dividend yield 0.6%
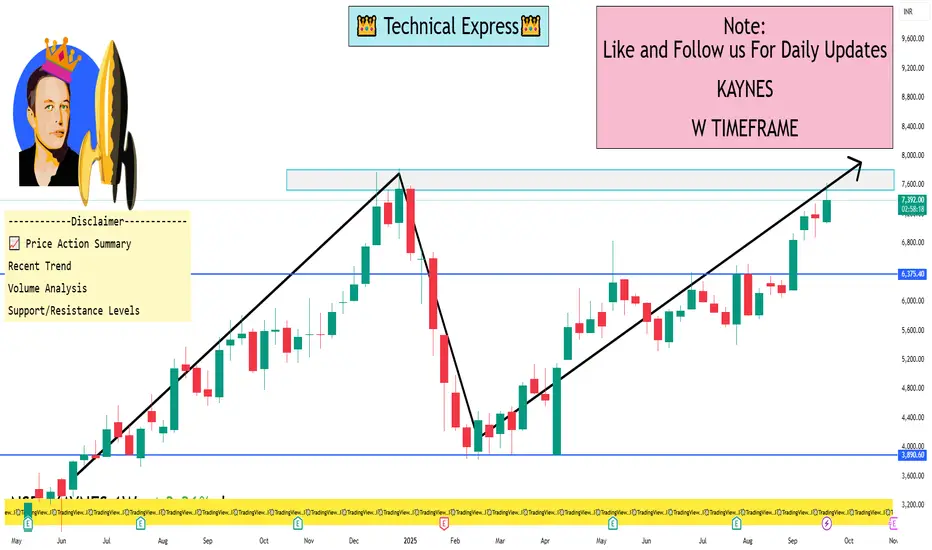
KAYNES 1 Week View 📊 Current Market Snapshot
Current Price: ₹7,379.00
Day's Range: ₹7,375.00 – ₹7,509.00
Previous Close: ₹7,503.00
VWAP (Volume Weighted Average Price): ₹7,445.71
Market Cap: ₹49,725.69 Cr
52-Week High/Low: ₹7,822.00 / ₹3,825.15
P/E Ratio: 156.62
Dividend Yield: 0.00%
Beta: 1.39
Face Value: ₹10.00
Volume: 194,246 shares
🔍 Technical Indicators (1-Day Timeframe)
Moving Averages: Mixed signals; no clear trend direction.
Oscillators: Neutral; no strong buy or sell signals.
Pivot Points: Support around ₹7,375.00; resistance near ₹7,509.00.
MACD: Recently crossed over on September 24, 2025, indicating potential upward momentum.
📈 Price Action Summary
Recent Trend: The stock has shown a slight decline of 1.66% from the previous close, indicating a minor pullback.
Volume Analysis: Trading volume remains moderate, suggesting steady investor interest without significant volatility.
Support/Resistance Levels: Immediate support at ₹7,375.00; resistance at ₹7,509.00. A breakout above resistance could signal a continuation of the upward trend; a drop below support may indicate further downside.
🧠 Market Sentiment
Investor sentiment appears cautiously optimistic, with recent developments such as the company's expansion into OSAT and PCB manufacturing, backed by government subsidies, potentially contributing to positive outlooks.
LiamTrading – Gold may fake a move before dropping
Gold is trading around the 375x region and might exhibit a "fake breakout" upwards before adjusting downwards. The price structure on the H4 chart shows:
Strong resistance is located at the 3770–3773 region, coinciding with the 0.786 – 1.0 Fibonacci extension area. This is a confluence zone prone to a downward reaction.
The main trendline remains upward, but the RSI is gradually weakening, indicating that the buying force is not as strong.
Short-term support is at 3710–3713, also the 0.5 – 0.618 fibo zone, suitable for buy scalping orders.
A larger support area is at 3688–3691, where it converges with the trendline bottom and important Fibonacci, considered a sustainable "buy zone."
Trading Plan Reference
Sell: 3770 – 3773, SL 3778, TP 3756 – 3743 – 3725 – 3710
Buy scalping: 3710 – 3713, SL 3705, TP 3725 – 3736 – 3748 – 3760
Buy zone: 3688 – 3691, SL 3684, TP 3699 – 3710 – 3725 – 3736 – 3745 – 3760
In summary, gold may create a false upward move to the resistance zone 3770–3773 before reversing to adjust. Traders should patiently wait for confirmation signals at key price zones to enter optimal orders and manage risks tightly.
This is my personal view on XAUUSD. If you find it useful, follow for the fastest updates on upcoming scenarios, continuously updated at comulity

LiamTrading XAUUSD Scenario Today Fibo & Volume Profile AnalysisLiamTrading XAUUSD Scenario Today:Fibo & Volume Profile Analysis
Gold, after testing the 375x zone, has shown clear signs of weakening. On the H1 chart, the price structure is forming an adjustment phase aligning with key Fibonacci and Volume Profile levels. This is the time when the market starts to “filter” liquidity, creating opportunities for both short sell orders and buy orders at strong support zones.
Technical Analysis
Fibonacci indicates the 0.786 – 1.0 zone around 3756–3758 coincides with strong resistance and FVG, with a high potential for a reversal.
Volume Profile points out the POC area around 3735–3740, if breached, it will pave the way for deeper downward pressure.
The confluence support zone of 0.618 fibo + large volume around 3688–3691 is suitable for scalping buy.
Further, the area 3648–3651 is reinforced by VAL and the bottom of the volume profile, making it a strong long-term “Buy zone.”
Trading Plan Reference
Sell zone: 3756 – 3758, SL 3763, TP 3750 – 3748 – 3736 – 3710 – 3690 – 3655
Buy scalping: 3688 – 3691, SL 3685, TP 3701 – 3715 – 3728
Long-term Buy zone: 3648 – 3651, SL 3640, TP 3670 – 3688 – 3700 – 3718 – 3733 – 3755
In summary, gold is moving in accordance with the technical structure confirmed by Fibonacci and Volume Profile. Today's scenario prioritises observing reactions around the sell zone 3756–3758 to find short opportunities, and waiting to buy at value zones 369x and 365x for the recovery wave.
This is my personal view on XAUUSD. If you want the fastest updates on the next gold scenarios, follow me and join the community to stay informed.

XAUUSD – Wolfe Waves continue on H4XAUUSD – Wolfe Waves continue on H4, price returns below trendline: prioritise correction scenario
Hello Trader,
Based on the Wolfe Waves structure on the H4 frame and current price behaviour, gold has returned to trading below the trendline, indicating a weakening short-term uptrend and paving the way for a downward correction before the market decides the next trend. The upper zone has created a clear “sell zone”; below, two defensive buy zones appear suitable for both scalping and medium-term.
Main Technical Picture
Wolfe Waves: wave 5 completes near resistance, then price falls back below the trendline — aligning with the correction scenario along Wolfe's target line 1–4.
Trendline & price box zone: the close below the rising trendline indicates “acceptance” below; immediate resistance lies at the 375x–376x cluster (sell zone).
Momentum: H4 MACD slows, histogram narrows → high probability of a pullback – retest before a new decision.
Detailed Trading Scenarios
1) Sell according to correction trend (priority)
Entry: 3756 – 3759
SL: 3764
TP: 3745 → 3732 → 3715 → 3690 → 3672
Reason: the 375x zone coincides with the sell zone + upper trendline; selling at retest offers a good R:R ratio.
Confirmation/Negation: if H4 closes above 3764 and holds, the short-term sell scenario weakens.
2) Buy scalping in buffer zone
Entry: 3701 – 3703
SL: 3695
TP: 3715 → 3732 → 3745 → 3766
Note: this is just a rebound in the correction phase; lock each step and move SL according to TP1.
3) Buy medium-term (strong base zone)
Entry: 3648 – 3651
SL: 3644
TP: 3672 → 3698 → 3708 → 3722 – 3727
Reason: the 365x zone coincides with the demand/accumulation volume on H4; suitable for catching a deep rebound along with the larger trend.
Management: this is a medium-term order, so divide volume, lock each step and move SL to breakeven after TP1.
Refer to my scenario if you find it reasonable, trade accordingly, and if you enjoy trading gold with high-quality scenarios, follow me.

XAUUSD – The downward trend continues to be prioritisedThe downward trend continues to be prioritised (Wolfe Waves Pattern H4)
Hello Trader,
Gold is following the Wolfe Waves structure on the H4 chart, after bouncing off the upper resistance zone and returning below the trendline. This indicates that the short-term upward momentum has weakened, and the scenario of a downward adjustment continues to be prioritised at this stage.
Technical Analysis
Wolfe Waves are clearly formed, wave 5 has hit resistance and a reversal signal has appeared.
The price failed to hold above the upper trendline, while the MACD shows weakening upward momentum.
The 3746 – 3748 zone is considered the main “sell zone” in the short term.
Nearby support zones: 3709 – 3711 and deeper at 3675 – 3678. Further, the area around 3650 is an important “buy zone” in the medium term.
Trading Scenario
Sell following the trend (priority)
Entry: 3746 – 3748
SL: 3754
TP: 3733 → 3720 → 3702 → 3690
Buy Short-term Scalping
Entry: 3709 – 3711
SL: 3705
TP: 3722 → 3730 → 3745
Buy Deep Support Scalping
Entry: 3675 – 3678
SL: 3670
TP: 3688 → 3696 → 3710 → 3725
Medium-term Buy Zone
Entry: around 3650
This is a high-volume accumulation zone, coinciding with strong support on H4. This area is suitable for considering medium-term buy orders if the price adjusts deeply.
Conclusion
In the short term, the bearish scenario continues to be prioritised, especially when the price remains below the 3748 zone.
Buy strategies should only be considered in the form of scalping or at the important buy zone around 3650.
The current gold market is still in a distribution phase, so patience is needed to observe candle confirmations at entry zones to optimise the R:R ratio.
This is today's XAUUSD trading scenario according to Wolfe Waves on H4. You can refer to and combine with personal strategies for the best risk management.
Follow me to receive the latest scenarios when the price structure changes.

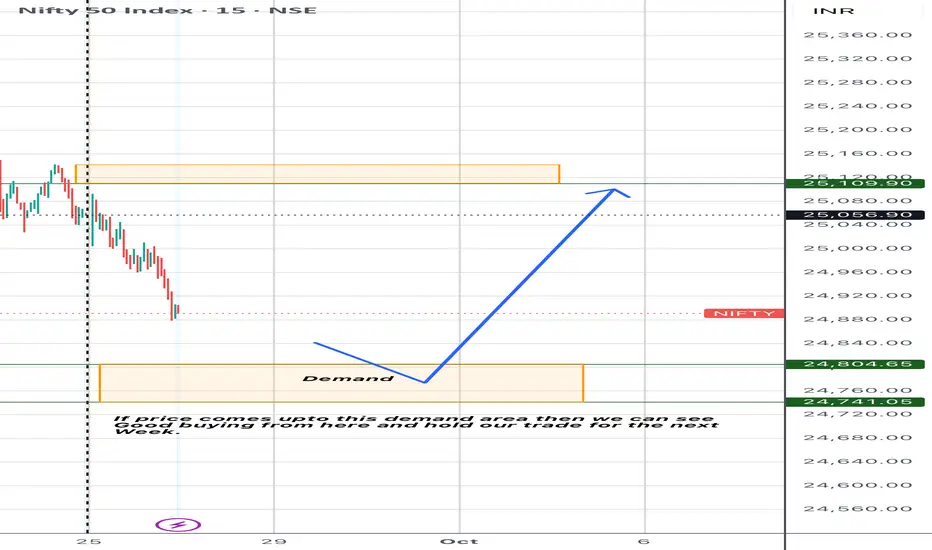
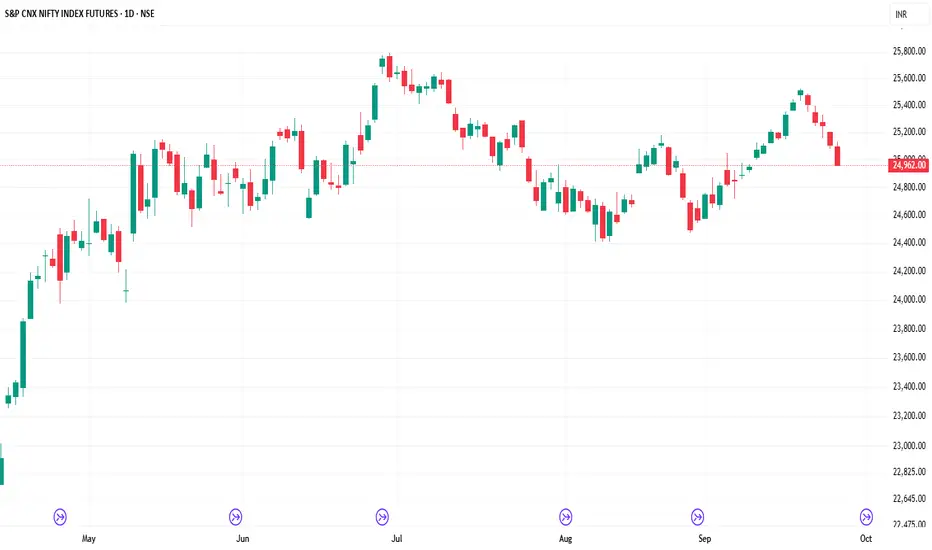
Nifty for the next week Good support area
If we see any sign of bullish flag from this zone
The we can good buying from here and catch atleast 300nifty points.
Just watch the price
If price shows 15min Ema crossover then good trade can be possible to make money here.
Half a Billion Dollars in Bitcoin and Tens of Millions in Ethere🚨In a 60‑minute window, more than 5,700 BTC (~
509
𝑀
)
𝑎
𝑛
𝑑
∗
∗
27
,
000
𝐸
𝑇
𝐻
∗
∗
(
509M)and∗∗27,000ETH∗∗(
43M) moved between large wallets and exchanges.
Such extraordinary volume in a short period often signals rapid trend reversals or strong price pressure.
Exchange inflows usually mean selling pressure; outflows often signal accumulation and possible bullish momentum.🚨


Technofunda Analysis – #CityUnionBank Technofunda Analysis – #CityUnionBank
1️⃣ Technicals
#CUB chart's give trendline breakout today after 4 rejections its strong signal of reversal.
Stock consolidating above 20/50 EMA after recent 20/50 EMA retesting successful
Chrt is outperforming NIFTY500 index, stronger than market.
Trendline breakout supported with healthy volume which confirms institutional interest.
Approx 1:2 Risk Reward
Entry ~215, SL ~203,
Target ~233 → 1:2
2️⃣ Fundamentals
Market Cap 15779 Cr | P/E: 13.5
Growth
Sales YoY ↑ 16% (1605 Cr v/s 1389 Cr)
EBIDT YoY ↑ 13%
Net Profit YoY ↑ 16% (306 Cr v/s 264 Cr)
EPS YoY ↑ 16% (4.13 v/s 3.57)
PEG Ratio ~0.84 (P/E 13.5 ÷ Growth 16%)
undervalued relative to growth.
Good double digit growth undervalued PEG, improving profitability looks attractive.
Disclaimer: This #technofunda analysis is only for educational purpose only. Not a buy/sell/hold recommendation. Do Your Own Research (#DYOR).

GBPUSD – Medium-Term H1/H4 Technical Outlook
Overview: GBPUSD has recently broken below its ascending trendline/channel after failing to sustain momentum near the 1.3530–1.3575 supply zone. At present, price is testing the 0.618 retracement (~1.3366), while the RSI (5) is heavily oversold (~13–14). This signals the possibility of a short-term bounce before the broader bearish bias resumes.
For Indian traders who follow GBPUSD closely, the focus should remain on selling rallies into resistance while being open to buying intraday dips at clearly defined liquidity levels.
Market Structure & Key Observations
Trendline Break: The bullish channel has been violated, shifting momentum to a “sell-the-rally” strategy.
Resistance Zones: 1.3537 and 1.3453–1.3428 (strong supply levels).
Support Zones: Initial support at 1.3366 (Fib 0.618) and 1.3319; major demand lies at 1.3143–1.3093.
Momentum Check: Deep oversold RSI could trigger corrective recoveries, making intraday scalps attractive.
Trading Plan
Sell the Rally – Primary Bias
Entry: 1.3500 – 1.3510
Stop Loss: 1.3550
Take Profit: 1.3480 – 1.3466 – 1.3445 – 1.3430
📌 Idea: Short entries on retest of broken structure. Only invalid if we see a 4H close above 1.3550.
Buy the Dip – Intraday Scalping
Entry: 1.3310 – 1.3330
Stop Loss: 1.3290
Take Profit: 1.3355 – 1.3368 – 1.3390 – 1.3410
📌 Idea: Quick long trades from liquidity near 1.3319, targeting minor resistance.
Buy Deeper Liquidity Sweep – Swing Setup
Entry: 1.3090 – 1.3110
Stop Loss: 1.3050
Take Profit: 1.3135 – 1.3160 – 1.3200 – 1.3240
📌 Idea: If the market flushes into the 1.3143–1.3093 demand zone, expect stronger bounce potential.
Risk Management & Invalidation
Above 1.3550 (4H close) → Bearish bias invalidated.
Strong breakdown below 1.3310 → Skip scalps, focus on deeper buy zones.
Partial profit booking at each target is recommended to protect capital.

Hi Traders, Anfibo here!Hi Traders, Anfibo here!
Market Overview – XAUUSD
Gold (XAUUSD) is currently holding steady within the H4 bullish channel, showing that the overall uptrend remains intact. While there has not been a major breakout in recent sessions, the technical structure still suggests buyers have the upper hand.
That said, the market is slowing down around a key resistance zone. For short-term opportunities, it’s important to focus on reactions at support and resistance levels to capture profits effectively.
Key Levels
Support: 3748 – 3733 – 3703
Resistance: 3768 – 3777 – 3788 – 3799
Trading Plan for Today
Sell Scalp Setup
Entry: 3770 – 3765
Stop Loss: 3780
Take Profit: 3720 – 3705
Buy Zone Setup
Entry: 3700 – 3705
Stop Loss: 3695
Take Profit: 3760 – 3800
⚠️ Always use stop-loss and follow strict money management rules to protect your capital.
Wishing you all successful trades!

INFY 1D Time frame📊 Daily Snapshot
Closing Price: ₹1,484.65
Day’s Range: ₹1,476.50 – ₹1,502.70
Previous Close: ₹1,494.60
Change: Down –0.64%
52-Week Range: ₹1,307.00 – ₹2,006.45
Market Cap: ₹6.17 lakh crore
P/E Ratio (TTM): 22.62
Dividend Yield: 2.90%
EPS (TTM): ₹65.63
Beta: 1.09 (indicating moderate volatility)
🔑 Key Technical Levels
Support Zone: ₹1,469 – ₹1,473
Resistance Zone: ₹1,485 – ₹1,490
Pivot Point: ₹1,480.97 (Fibonacci)
All-Time High: ₹2,006.45
📈 Technical Indicators
RSI (14-day): 44.45 – approaching oversold territory, suggesting potential for a rebound.
MACD: Negative at –6.34, indicating bearish momentum.
Moving Averages: Trading below the 50-day (₹1,511.06) and 200-day (₹1,495.15) moving averages, indicating a bearish trend.
Stochastic RSI: Between 45 and 55, indicating a neutral condition.
CCI (20): Between –50 and 50, implying a neutral condition.
📉 Market Sentiment
Recent Performance: Infosys experienced a decline of 0.64% on September 25, 2025, underperforming the broader market.
Volume: Trading volume was significantly higher than its 20-day average, indicating increased investor activity.
📈 Strategy (1D Timeframe)
1. Bullish Scenario
Entry: Above ₹1,485
Stop-Loss: ₹1,469
Target: ₹1,490 → ₹1,500
2. Bearish Scenario
Entry: Below ₹1,469
Stop-Loss: ₹1,485
Target: ₹1,460 → ₹1,450
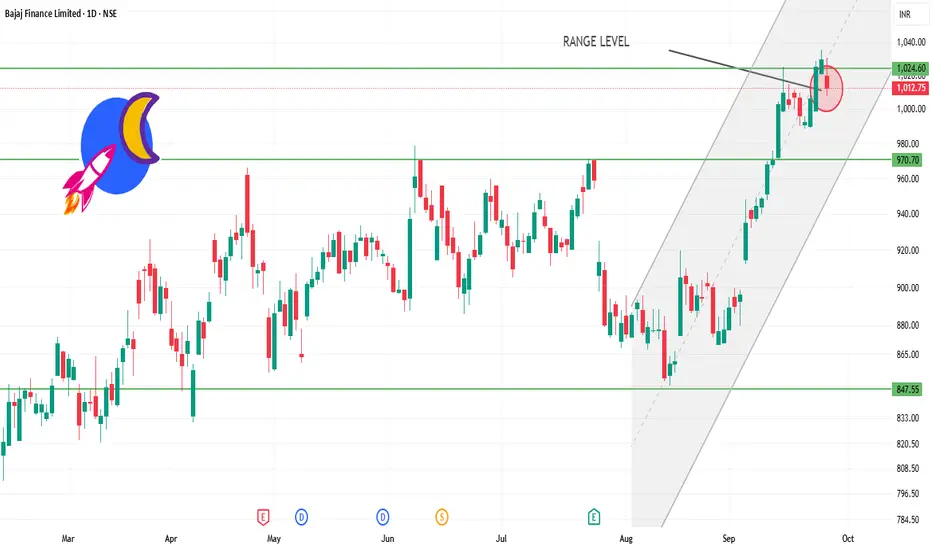
BAJFINANCE 1D time frame📊 Daily Snapshot
Closing Price: ₹1,012.75
Day’s Range: ₹1,008.00 – ₹1,031.10
Previous Close: ₹1,029.75
Change: Down –1.66%
52‑Week Range: ₹645.10 – ₹1,036.00
Market Cap: ₹6.31 lakh crore
P/E Ratio: 36.2
Dividend Yield: 2.76%
EPS (TTM): ₹28.04
Beta: 1.14 (indicating moderate volatility)
🔑 Key Technical Levels
Support Zone: ₹1,008.00 – ₹1,015.00
Resistance Zone: ₹1,031.00 – ₹1,036.00
All-Time High: ₹1,036.00
📈 Technical Indicators
RSI (14-day): 42.88 – approaching oversold territory, suggesting potential for a rebound.
MACD: Positive at 2.46, indicating bullish momentum.
Moving Averages: Trading above the 50-day and 200-day moving averages, indicating an overall uptrend.
📉 Market Sentiment
Recent Performance: Bajaj Finance experienced a decline of 1.66% on September 25, 2025, underperforming the broader market.
Volume: Trading volume was significantly higher than its 50-day average, indicating increased investor activity.
📈 Strategy (1D Timeframe)
1. Bullish Scenario
Entry: Above ₹1,031.00
Stop-Loss: ₹1,008.00
Target: ₹1,045.00 → ₹1,050.00
2. Bearish Scenario
Entry: Below ₹1,008.00
Stop-Loss: ₹1,015.00
Target: ₹995.00 → ₹990.00
ICICIBANK 1D Time frame📊 Daily Snapshot
Closing Price: ₹1,375.50
Day’s Range: ₹1,371.80 – ₹1,391.50
Previous Close: ₹1,382.70
Change: Down –0.52%
52-Week Range: ₹1,018.85 – ₹1,494.10
Market Cap: ₹9.7 lakh crore
P/E Ratio: 20.5
Dividend Yield: 1.2%
EPS (TTM): ₹67.00
Beta: 1.05 (moderate volatility)
🔑 Key Technical Levels
Support Zone: ₹1,370 – ₹1,375
Resistance Zone: ₹1,390 – ₹1,400
All-Time High: ₹1,494.10
📈 Technical Indicators
RSI (14-day): 34.1 – approaching oversold territory, suggesting potential for a rebound.
MACD: Negative, indicating bearish momentum.
Moving Averages: Trading below the 150-day moving average, indicating a bearish trend.
Candlestick Patterns: Recent formation of a Bearish Engulfing pattern, suggesting potential for further downside.
📉 Market Sentiment
Recent Performance: ICICI Bank has experienced a decline for the fifth consecutive session, underperforming the broader market.
Sector Performance: The NIFTY BANK index also closed lower, reflecting sector-wide weakness.
📈 Strategy (1D Timeframe)
1. Bullish Scenario
Entry: Above ₹1,390
Stop-Loss: ₹1,370
Target: ₹1,405 → ₹1,420
2. Bearish Scenario
Entry: Below ₹1,370
Stop-Loss: ₹1,390
Target: ₹1,355 → ₹1,340
SBIN 1D Time frame📊 Daily Snapshot
Closing Price: ₹861.15
Day’s Range: ₹859.95 – ₹870.15
Previous Close: ₹866.20
Change: Down –0.59%
52-Week Range: ₹680.00 – ₹880.50
Market Cap: ₹794,895 crore
P/E Ratio: 10.01
Dividend Yield: 1.85%
EPS (TTM): ₹86.06
Beta: 1.00 (indicating average market volatility)
🔑 Key Technical Levels
Support Zones: ₹860.00 – ₹854.00 – ₹844.00
Resistance Zones: ₹876.00 – ₹886.00 – ₹892.00
All-Time High: ₹912.00
Fibonacci Pivot Point: ₹865.68
📈 Strategy (1D Timeframe)
1. Bullish Scenario
Entry: Above ₹876.00
Stop-Loss: ₹859.00
Target: ₹886.00 → ₹892.00
2. Bearish Scenario
Entry: Below ₹859.00
Stop-Loss: ₹866.00
Target: ₹854.00 → ₹844.00

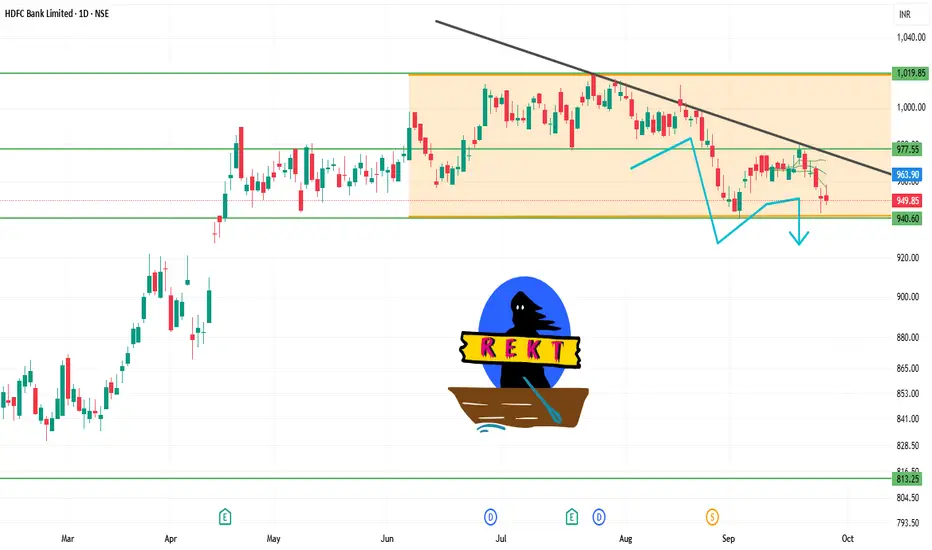
HDFCBANK 1D Time frame📊 Daily Snapshot
Closing Price: ₹949.20
Day’s Range: ₹947.40 – ₹958.00
Previous Close: ₹957.20
Change: Down –0.52%
52-Week Range: ₹806.50 – ₹1,018.85
Market Cap: ₹14.6 lakh crore
P/E Ratio: 20.66
Dividend Yield: 2.32%
EPS (TTM): ₹45.97
Beta: 0.92 (indicating lower volatility)
🔑 Key Technical Levels
Support Zone: ₹947.40 – ₹950.00
Resistance Zone: ₹957.20 – ₹960.00
All-Time High: ₹1,018.85
📈 Strategy (1D Timeframe)
1. Bullish Scenario
Entry: Above ₹957.20
Stop-Loss: ₹947.40
Target: ₹965.00 → ₹970.00
2. Bearish Scenario
Entry: Below ₹947.40
Stop-Loss: ₹957.20
Target: ₹940.00 → ₹935.00
Ote Refinement trade setup for currency .hoping for a long entry set up . after taking out the inducement and fvg associated with the bos .
