Technical Indicators 1. Introduction to Technical Indicators
Technical indicators are mathematical calculations based on historical price, volume, or open interest data. They are primarily used in technical analysis, a method of evaluating securities by analyzing market statistics rather than intrinsic value.
Indicators help traders:
Identify trends and reversals.
Determine momentum and market strength.
Recognize overbought or oversold conditions.
Generate buy or sell signals.
There are three main categories of technical indicators:
Trend Indicators – Identify the direction and strength of a trend.
Momentum Indicators – Measure the speed and force of price movements.
Volume Indicators – Analyze trading activity to confirm price movements.
Some indicators are leading, giving early signals of potential price movement, while others are lagging, confirming trends after they have started.
2. Trend Indicators
Trend indicators help traders identify whether an asset is moving upward, downward, or sideways. Recognizing trends early allows traders to align their strategies with the market direction.
2.1 Moving Averages (MA)
Moving averages smooth out price data to reveal trends over a specific period. There are two main types:
Simple Moving Average (SMA):
Calculated by averaging the closing prices over a specified period.
Example: A 50-day SMA sums the last 50 closing prices and divides by 50.
Exponential Moving Average (EMA):
Places more weight on recent prices, making it more responsive to price changes.
Applications:
Trend identification: Prices above the MA indicate an uptrend; below indicate a downtrend.
Crossovers: A short-term MA crossing above a long-term MA generates a bullish signal, and vice versa.
Limitations:
Lagging indicator, less effective in sideways markets.
2.2 Moving Average Convergence Divergence (MACD)
MACD measures the difference between two EMAs (usually 12-day and 26-day).
Components:
MACD Line: Difference between the fast and slow EMA.
Signal Line: 9-day EMA of the MACD line.
Histogram: Difference between MACD line and Signal line.
Interpretation:
Crossovers: MACD crossing above Signal line = buy signal; below = sell signal.
Divergence: Price making new highs while MACD fails indicates trend weakness.
Strengths:
Effective for spotting trend reversals and momentum shifts.
Weaknesses:
Lagging indicator; may give false signals in choppy markets.
2.3 Average Directional Index (ADX)
ADX measures the strength of a trend regardless of its direction.
Values above 25 indicate a strong trend.
Values below 20 suggest a weak trend or sideways market.
Applications:
Confirming trend strength before entering a trade.
Pairing with other indicators for trend-following strategies.
Limitations:
Does not indicate trend direction, only strength.
3. Momentum Indicators
Momentum indicators assess the speed of price movements, helping traders identify potential reversals or continuation patterns.
3.1 Relative Strength Index (RSI)
RSI measures the magnitude of recent price changes to evaluate overbought or oversold conditions.
Values above 70 = overbought (possible reversal or pullback).
Values below 30 = oversold (possible rebound).
Applications:
Divergence between RSI and price signals potential trend reversals.
Combining RSI with trend indicators enhances trade accuracy.
Limitations:
Can remain overbought or oversold for extended periods in strong trends.
3.2 Stochastic Oscillator
The stochastic oscillator compares a security’s closing price to its price range over a specific period.
%K Line: Current close relative to the high-low range.
%D Line: 3-period moving average of %K.
Interpretation:
Values above 80 = overbought; below 20 = oversold.
Crossovers of %K and %D lines indicate potential buy/sell signals.
Strengths:
Effective in volatile markets for timing entries and exits.
Weaknesses:
Less effective during strong trends; prone to false signals.
3.3 Rate of Change (ROC)
ROC measures the percentage change in price over a given period.
Positive ROC indicates upward momentum.
Negative ROC signals downward momentum.
Applications:
Identifying early trend reversals.
Confirming breakouts or breakdowns.
Limitations:
Sensitive to price spikes; may give false signals in choppy markets.
4. Volume Indicators
Volume analysis confirms price trends, as strong moves are typically accompanied by high volume.
4.1 On-Balance Volume (OBV)
OBV measures cumulative buying and selling pressure by adding volume on up days and subtracting volume on down days.
Applications:
Divergence between OBV and price can signal reversals.
Confirming trend strength.
Limitations:
Lagging indicator; requires combination with price analysis.
4.2 Chaikin Money Flow (CMF)
CMF measures the volume-weighted average of accumulation and distribution over a specified period.
Positive CMF = buying pressure.
Negative CMF = selling pressure.
Applications:
Identifying accumulation or distribution phases.
Supporting trade entries in trend-following strategies.
Weaknesses:
Less effective during low-volume periods.
5. Volatility Indicators
Volatility indicators help traders gauge market risk and potential price swings.
5.1 Bollinger Bands
Bollinger Bands consist of a moving average (middle band) and upper/lower bands based on standard deviation.
Price near upper band = overbought.
Price near lower band = oversold.
Applications:
Trading range-bound markets using band bounces.
Breakouts indicated when price moves outside bands.
Limitations:
Band breakouts don’t always result in sustained trends.
5.2 Average True Range (ATR)
ATR measures market volatility by calculating the average of true price ranges over a period.
Applications:
Setting stop-loss levels.
Identifying breakout potential.
Limitations:
Does not indicate trend direction, only volatility.
6. Combining Indicators for Strategy
Using a single indicator often results in false signals. Effective traders combine indicators from different categories:
Trend + Momentum:
Example: Use SMA to identify trend direction and RSI to detect overbought/oversold conditions.
Trend + Volume:
Example: Confirm trend strength with ADX and OBV before entering a trade.
Momentum + Volatility:
Example: Use MACD for momentum and ATR to set stop-loss levels.
Rule of Thumb:
Avoid indicators that provide the same information.
Mix leading and lagging indicators for better confirmation.
7. Indicator-Based Trading Strategies
7.1 Trend-Following Strategy
Use moving averages or ADX to identify trends.
Enter trades in the direction of the trend.
Use momentum indicators like MACD or RSI for entry timing.
7.2 Reversal Strategy
Use RSI, Stochastic, or Bollinger Bands to detect overbought/oversold conditions.
Look for divergence between price and indicator for potential reversals.
7.3 Breakout Strategy
Use Bollinger Bands or price channels to identify consolidation.
Volume indicators like OBV or CMF confirm breakout strength.
8. Common Mistakes in Using Indicators
Overloading charts: Too many indicators can confuse signals.
Ignoring market context: Indicators must be interpreted in conjunction with price action.
Blind reliance: No indicator guarantees success; risk management is crucial.
Neglecting timeframes: Indicators behave differently on daily, weekly, or intraday charts.
9. Advanced Indicator Techniques
Divergence Trading: Identifying differences between price and indicators like MACD or RSI to spot potential reversals.
Multiple Timeframe Analysis: Confirm signals from multiple timeframes to reduce false entries.
Weighted Indicators: Adjust indicator sensitivity to reduce lag or noise.
Algorithmic Integration: Using indicators as inputs in automated trading systems.
10. Choosing the Right Indicators
Factors to consider:
Trading style: Day traders vs. swing traders vs. long-term investors.
Market conditions: Trending vs. ranging markets.
Timeframe: Short-term indicators are more sensitive; long-term indicators reduce noise.
Simplicity: Choose a few reliable indicators rather than overwhelming charts.
11. Conclusion
Mastering technical indicators requires practice, observation, and discipline. While indicators provide valuable insights into market behavior, they are most effective when combined with strong risk management and a clear trading plan.
Successful traders:
Use indicators to enhance decision-making, not replace it.
Test strategies thoroughly before applying them in live markets.
Adapt indicator settings to suit different market conditions.
By understanding the nuances of trend, momentum, volume, and volatility indicators, traders can create robust strategies that increase probability and confidence in their trades. This Technical Indicators Masterclass equips traders with the knowledge to analyze markets effectively and navigate complex price movements with precision.
Fundamental Analysis
What if we are about to see some historical event!If Powell increased a sudden rate hike! We will see some historical event like 1980!
Just be aware of this!
$4024 Gold: 8-Week Jhakaas Record! BUY Pivot $398x!Hello, traders!
Gold just wrapped up an impressive 8-week winning streak, closing the session at $4,024.40/oz (Futures). This bada (big) rally was immediately triggered by President Trump's unexpected tariff threat on China, which, boss, fueled a massive rush toward safe-haven assets.
Fundamentals & Technical Bias: Buying the Pivot
Core Drivers: Escalating trade panga (conflict) thanks to Trump, steady Fed rate cut expectations, and ongoing global gadbadi (instability) are all making Gold the top safe haven.
Technical Recovery: After a deep correction to $394x, Gold recovered super fast and closed firmly above $399x. This confirms that buying power is dominant and the bullish momentum is pakka (confirmed).
Priority Bias: BUY (Long). $398x is the critical short-term pivot point. Risk management is key, remember that.
Risk Warning: Only switch to SELL (Short) if the price rapidly breaks below $398x due to major negative news.
Key Price Levels:
Resistance: $4064, $4084, $4104, $4124
Support: $3984, $3951, $3934
Trading Strategy (Prioritize BUY at the Pivot)
BUY ZONE (Pivot $398x): $3984 - $3982
SL: $3974
TPs: $3992, $4002, $4012, $4022, $4032
SELL ZONE (Counter-Trend): $4024 - $4026
SL: $4034
TPs: $4016, $4006, $3996, $3986, $3976
Will this trade war tension take Gold past $4100 next week? Kya lagta hai? 👇
#Gold #XAUUSD #4KGold #TrumpTariffs #8WeeksUp #Pivot #TradingView #PaisaBanega

FLAIR Price Action- Current Price: About ₹315 as of early October 2025.
- Price Range: 52-week low roughly ₹195 and high around ₹357.
- Market Cap: Approximately ₹3,300 Crores.
- P/E Ratio: Around 27-28, indicating moderate valuation relative to earnings.
- Recent Trend: The stock has been fluctuating in the ₹300-320 range in recent weeks with some volatility shown in daily price changes.
- Moving Averages: The 50-day and 200-day moving averages align near the ₹310-320 levels, indicating a sideways to slight downtrend intraday in early October.
- Financial Performance: Annual revenue close to ₹970 Crores, with profits around ₹114 Crores and promoter holding near 79%.
- The stock has shown some recovery from the lows earlier in 2025 but remains below its 52-week high.
- Trading volume shows moderate liquidity, with typical daily volumes in the tens of thousands range.
Overall, Flair Writing is moderately valued, with recent price consolidation and moderate volatility as it trades below its recent highs, supported by steady financials.

TARIL Price ActionHere is the price and fundamental analysis summary for Transformers & Rectifiers (India) Ltd (TARIL) without references:
- Current Price: Around ₹491.35 as of October 2025.
- Price Range: 52-week range is approximately ₹356 low to ₹649 high.
- Market Capitalization: About ₹14,748 Crores.
- P/E Ratio: Around 56-60, indicating relatively high valuation.
- EPS: About ₹8.06 to ₹8.71 (TTM).
- Dividend Yield: Very low, about 0.04%.
- Price averages: 50-day average ~ ₹507, 200-day average ~ ₹494.
- Revenue and Profit Growth: Strong profit growth of over 250% CAGR in last 5 years; sales and operating profit margins improving, with recent operating profit margin around 16-17%.
- Return Ratios: ROCE ~28%, ROE ~23%.
- Working Capital Efficiency: Debtor days reduced significantly, improving cash cycles.
- Stock trades at about 11.8 times book value (book value approximately ₹37).
- Quarterly trends show improving profitability and sales year-over-year.
- Peer comparison: Valuation and profitability metrics compare reasonably with peers in electrical equipment sector.
The stock price has been on an uptrend with strong fundamentals and growth metrics indicating positive medium-term potential but trades at a high valuation reflecting investor optimism and strong earnings growth.

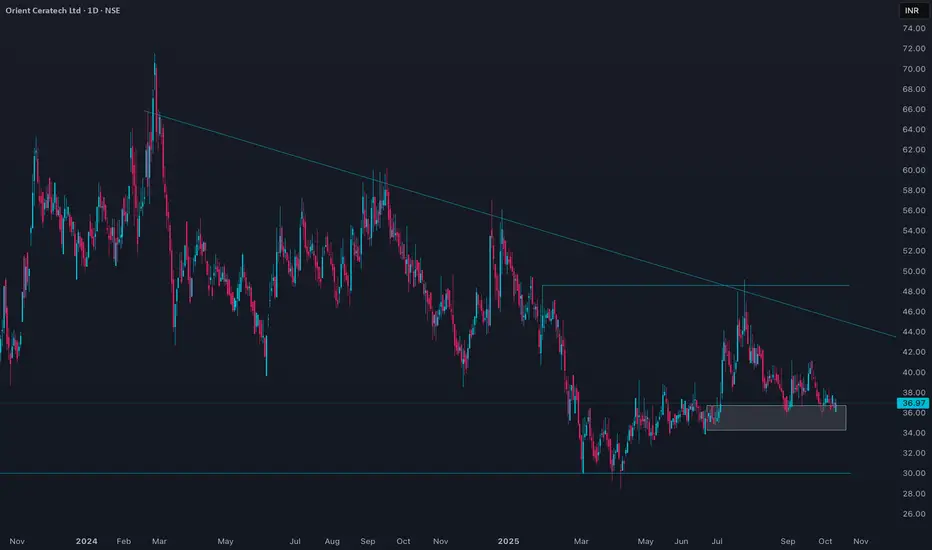
ORIENTCER Price ActionOrient Ceratech Ltd is currently trading at ₹37, showing a slight uptick in the latest session. The stock has an annual range between ₹28.93 (year low) and ₹57.4 (year high). Volumes in recent sessions have been below average, reflecting subdued market participation. The market capitalization stands close to ₹442 crore.
Technically, the stock is consolidating, with the price hovering just below both the 50-day and 200-day moving averages, indicating a weak trend in the medium term. Recent intraday movement ranged from ₹36.8 to ₹38.2, and resistance is visible around ₹38–₹41, while support lies near the ₹36 zone and more strongly at the yearly low.
On the fundamentals front, Orient Ceratech reported modest profit growth with a trailing twelve-month EPS of ₹0.95 and a P/E ratio near 39, which is above its historical average but below the sector average. The book value per share stands around ₹23 and the price-to-book is about 1.6. Dividend yield is modest at 0.68%, and the balance sheet shows moderate leverage. While revenue has grown slightly year-over-year, profitability remains a concern with recent margin pressures.
In summary, the stock remains in a consolidation phase with a mildly negative bias until a strong reversal or breakout above resistance emerges. Both technicals and fundamentals suggest a cautious stance for new entries, with high valuations and weak earnings trends requiring close monitoring.
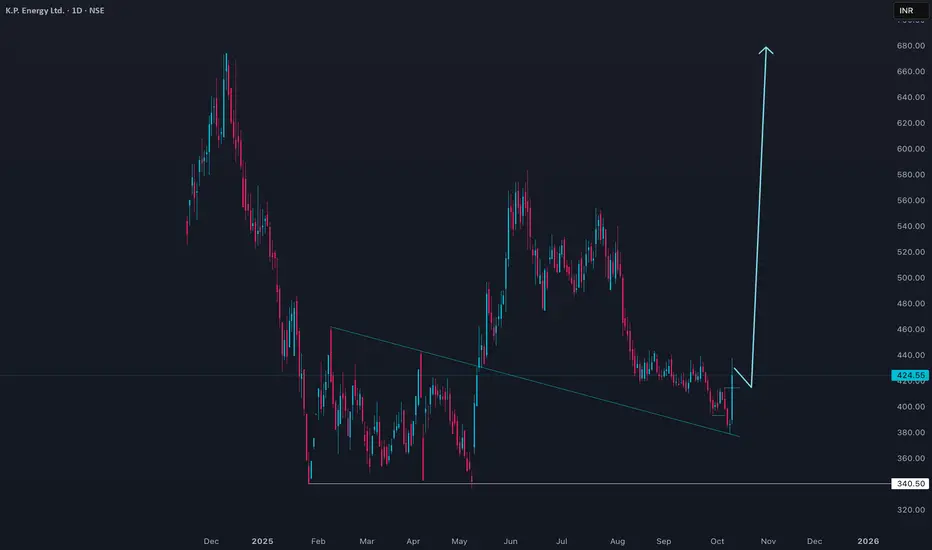
KPEL Price ActionK.P. Energy Ltd (KPEL) is currently trading around ₹424, rebounding sharply with a rise of almost 10% in the last session. The price remains well below the 52-week high of ₹675 but is comfortably above the year's low at ₹336. Recent sessions saw increased volatility, with an intraday range from ₹386 to ₹438 and strong trading volumes, pointing to heightened trader activity.
The stock is in the middle of a broad upward trend but has underperformed on a year-to-date basis, falling more than 21% compared to modest market gains. Short-term technicals are mixed: while the long-term average remains bullish, the stock faces immediate resistance near ₹528 and finds support just above ₹420. Momentum indicators such as MACD show lingering positive signals, but trading below the short-term average keeps the outlook cautious for aggressive entry.
KPEL’s financial fundamentals are robust, highlighted by strong growth in both net sales and profits. The company’s price-to-earnings (P/E) ratio is about 23, and the price-to-book (P/B) stands near 11.8—both somewhat elevated but aligning with industry standards for growth-oriented firms. Debt levels are well-controlled, and operational margins have improved, adding confidence to the long-term narrative. Despite high valuations, continued top-line and bottom-line delivery sustains market interest, with a positive outlook for future growth if sector conditions remain favorable.
For traders, key levels to monitor are resistance at ₹528 and support at ₹420. As long as the price remains above the lower band, upward momentum is supported, though breaking below could invite short-term selling pressure. Long-term investors may consider accumulating during any dips, relying on the company’s strong operating performance and sector prospects.
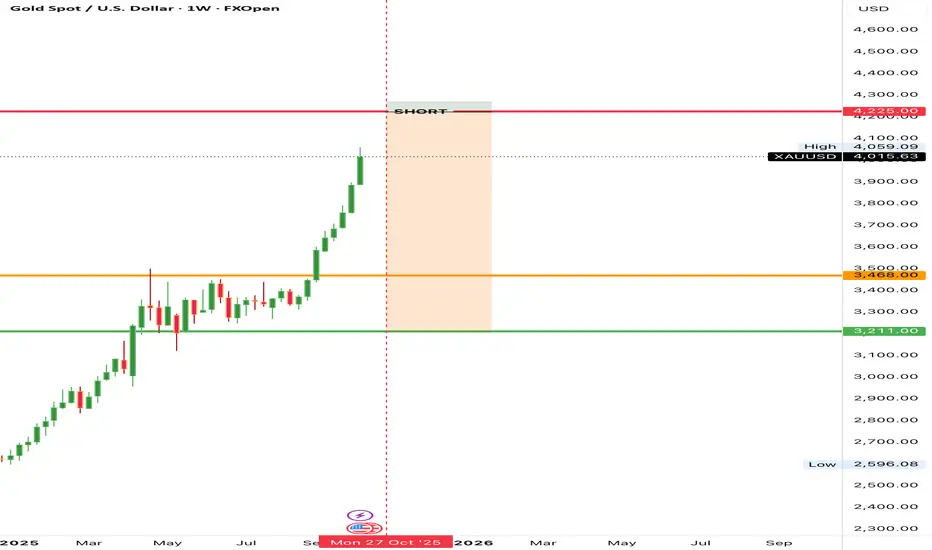
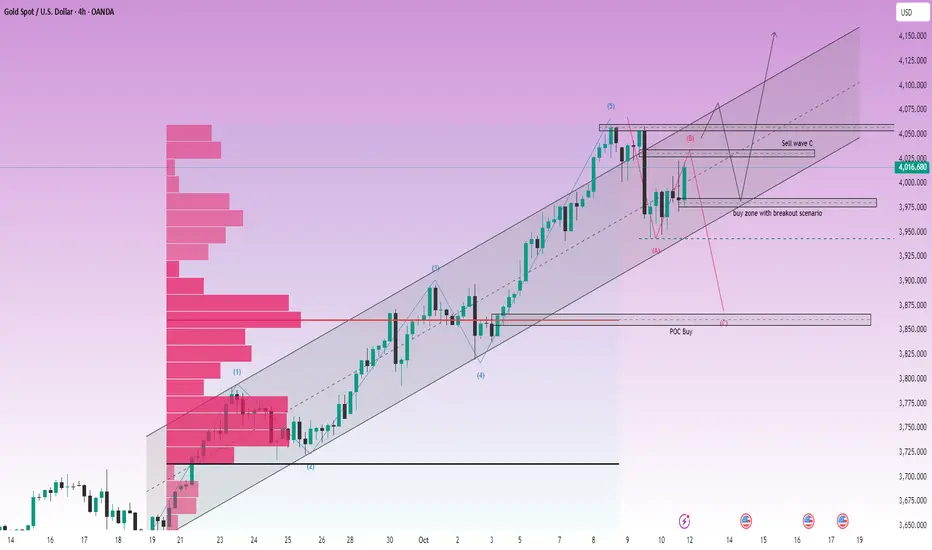
LiamTrading – GOLD: Risk of ABC Correction Wave..LiamTrading – GOLD: Risk of ABC Correction Wave, Short-term Sell at 4028
Hello traders,
Gold has had an impressive growth week, but as prices hit new highs, the risk of correction always increases. Let's examine this week's Gold scenario based on wave analysis and market liquidity.
📊 Technical Analysis (Chart H4 – XAUUSD)
Based on the H4 chart, Gold (GOLD) seems to have completed the Push Wave 5 (Elliott Wave 5) in the current uptrend cycle, reaching strong resistance around 4050–4060.
Current Structure:
The price is within a sustainable Uptrend Channel.
The 4050–4060 range is a significant resistance where selling pressure may emerge.
An ABC correction wave scenario appears after completing Wave 5.
Key Liquidity Zones:
Potential Resistance Zone (Sell Wave C): Around 4028–4033 (Price area to watch for the reaction of the final Wave C).
Confirmed Drop Support Zone: 3972 (Critical price area confirming if selling pressure is strong enough).
Attractive Buy Zone: 3976 (Temporary liquidity if price corrects, waiting for Breakout confirmation).
Long-term Buy Zone (POC Buy): ~3850 (Price area with a huge Volume Profile, ideal for long-term buy orders).
🎯 New Week Trading Scenario
📉 Short-term Sell
This scenario is based on the expectation of an ABC correction wave starting from the resistance zone.
📍 Entry: 4033
🛑 SL: 4040 (Very tight SL, suitable for short-term Sell strategy at the wave peak)
🎯 TP: 3976 → 3943 → POC (~3850)
📈 Long-term Buy
This setup waits for a correction to lower liquidity zones to enter Buy orders with optimal R:R ratio.
📍 Entry: 3976 (Temporary liquidity buy zone)
🛑 SL: 3970
🎯 TP: 4040 → 4090 → 4150
🛑 Failure Scenario (Wait for Breakout Confirmation)
If the price breaks the 4060 peak and creates a new ATH (All-Time High), the ABC wave scenario will fail.
Action: Continue to prioritize Buying. The best entry is to wait for the price to retest the broken liquidity zone (Breakout Retest) around 3976.
🧭 Fundamental & Long-term Analysis
Macroeconomic Sentiment: The Royal Bank of Canada (RBC) forecasts Gold to rise to $4,500 in the next two years, bolstered by long-term inflation concerns. This confirms the long-term uptrend of Gold remains intact.
US Dollar Impact (USD): The traditional view is that USD rises as investors seek liquidity during market stress. However, Gold's rise alongside USD shows the market prioritizes gold as an inflation hedge rather than just a safe haven.
Long-term Strategy: The buy zone at POC (~3850) according to Volume Profile is extremely suitable. Large liquidity here will help traders enter optimal orders and hold long-term, leveraging the pressure from the Seller's Liquidity to push prices up.
📌 Conclusion
Gold is at a critical crossroads. Although the long-term trend is up, the short-term correction risk (ABC Wave) at the 4028–4033 zone is very high.
Priority: Watch for short-term sells at the resistance zone with a tight SL.
Safe strategy: Wait to Buy at liquidity support zones like 3976 or POC (~3850) to optimize risk/reward (R:R).
I will continue to update Gold scenarios daily with insights from 8 years of trading experience.
👉 Follow me to not miss important updates!
this is a 4hr zone but zone is big compare to risk reward(avoid) i can marked this zone more accurately but i dont want to so just leaving it as it is
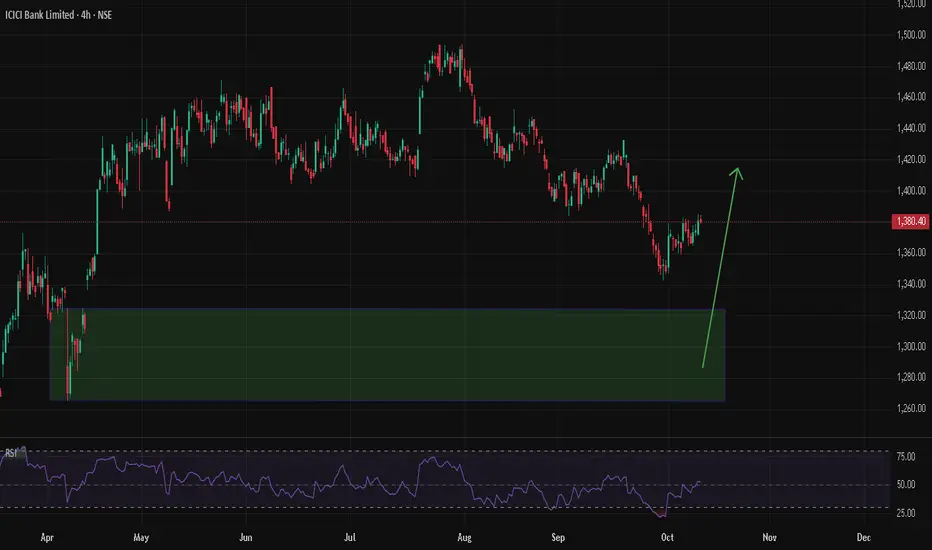
intraday trade zone in 1 day time frame marked it after deeply analyse, before taking a long trade or buy do you own analysis first. people wil keep posted there analysis but you are the who has to decide whether to go for it or not after you analysis
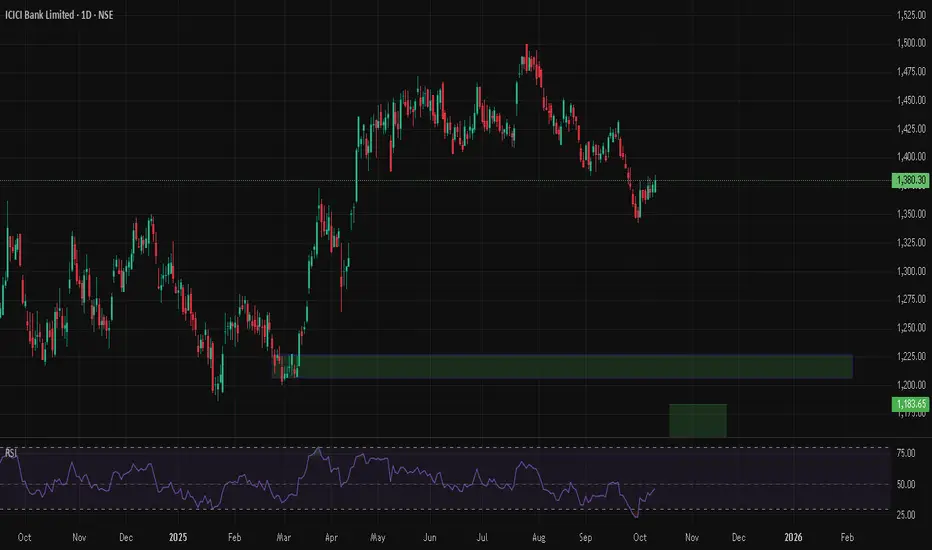
icici bank long term zones for best buying i have marked the 2 rare and best buying zones for icici if it comes here you should definitely look for a long term prospect

googl inc long entry but for long termmentioned this zone in 1 day time frame but showing you in 1 week, don't get confused
let's hope it comes to somewhere near it

Part 2 Master Candle Stick PatternHow Option Trading Works
Let’s take a simple example.
Suppose a stock named XYZ Ltd. is trading at ₹1000. You believe it will rise in the next month, so you buy a call option with a strike price of ₹1050, expiring in one month, and pay a premium of ₹20 per share.
If the price rises to ₹1100, your profit = (1100 - 1050 - 20) = ₹30 per share.
If the price stays below ₹1050, you lose the premium (₹20 per share).
This is the beauty of options — your loss is limited to the premium, but your potential profit is unlimited.
Similarly, if you believe the stock will fall, you can buy a put option. For example, if you buy a put option at ₹950 with a premium of ₹15:
If the stock falls to ₹900, your profit = (950 - 900 - 15) = ₹35 per share.
If the stock stays above ₹950, you lose the ₹15 premium.

LiamTrading – XAUUSD: Structure BreakLiamTrading – XAUUSD: Structure Break, Preparing for a STRONG DOWNTREND?
Hello trader,
The Gold market has undergone a significant Market Structure Shift, breaking the previous sustainable uptrend. After the key support area around 4000 was breached with high volume, the Bears have taken short-term control.
Currently, the price is experiencing a slight correction after a sharp drop, but overall, it is forming Lower High – Lower Low patterns on the H1 chart, confirming the downward movement.
📊 Technical Analysis (Chart 1H – XAUUSD)
The recent sharp decline has broken the upward structure (Break of Structure - BOS) and created significant inefficiencies/imbalances that need to be filled:
Liquidity Zone (Resistance): $4050 – $4060. This is the resistance peak to watch.
Sell Liquidity Zone (FVG Sell Zone): $4030 – $4040. This is the ideal Fair Value Gap for Bears to re-enter.
Key Support/Buy Scalping Zone: $3925 – $3935 (Confluence area of Fibonacci Extension 2.272).
Swing Buy/Accumulation Zone: $3905 – $3915 (Confluence area of Fibonacci Extension 2.618).
🎯 Main Trading Scenario (Short-term BEARISH)
Sell entry 4000 – 4002
SL 4008
TP 3986 – 3965 3950 – 3923
Sell Entry 4028 – 4031 (FVG)
SL 4036
TP 4022 – 4010 4000 – 3960
Buy Scalping
3926 – 3928
SL 3921
TP 3939 – 3955 3970 – 3990
Buy Bottom Zone 3900 – 3908
SL 3895
TP 3922 – 3945 3970 – 3988
Export to Spreadsheet
🧭 Fundamental View & Market Sentiment
The downward momentum is being driven by the following factors:
Monetary Policy: Fed official Williams' remarks supporting continued rate cuts seem to be reducing the safe-haven demand for Gold. Although rate cuts typically support Gold in the long term (due to "cheap money"), a slowing labour market is a short-term negative signal.
CPI News: The Bureau of Labour Statistics recalling staff to compile the CPI report amid a government shutdown highlights the importance of this data. If CPI is not as expected, it could cause significant volatility.
Market Sentiment: After the structure break, technical selling sentiment may dominate, especially if the price cannot quickly recover to the 4000 level.
📌 Conclusion & Recommendations
Gold has confirmed a short-term structure change to a downtrend. While the long-term trend is not yet clearly defined, the current priority is to seek Sell opportunities when the price retraces to key resistance and FVG areas (such as $4000 and $4030).
Advice: Always adhere to SL (Stop Loss) and prioritise risk reduction when the market shows reversal signals. DO NOT BUY when the downtrend structure is prevailing.
👉 Follow me for detailed updates and the latest trading plans during the session!

ETHFIUSDT - BULLS ARE NOT DONE YET?Symbol - ETHFIUSDT
ETHFIUSDT is undergoing a corrective phase after updating its local high at 1.938 The breakout above the 1.677 zone appears to be an attempt to initiate a distribution phase following an extended period of consolidation. The key question now is whether the bulls can sustain control above this area.
Bitcoin is also in correction mode following a false breakout of its resistance level. In this context, the broader cryptocurrency market is experiencing a temporary decline. Nevertheless, the prevailing trend remains bullish, supported by a favorable fundamental outlook. Once the current correction concludes, market growth may resume.
On the daily timeframe, ETHFIUSDT is attempting to transition into a distribution phase after approximately five to six months of consolidation. The overall trend remains upward, and following the breakout of resistance, a corrective movement toward the liquidity zone at 1.677 is developing. A false breakdown, accompanied by a shift in market imbalance and subsequent consolidation above 1.678, could stimulate renewed buyer interest - potentially leading to further price appreciation.
Resistance levels: 1.898, 1.938
Support levels: 1.677, 1.534
The chart highlights two critical support zones - 1.677 and 1.534, Sustained bullish activity above the 1.677 level may result in a rebound and continued upward movement, confirming the ongoing distribution phase. Conversely, failure to maintain this level could prompt a retest of the zone at 1.534, where a liquidity sweep may subsequently trigger a new wave of buying pressure.

LTCUSDT - BULL TRAP IN MAKING?Symbol - LTCUSDT
CMP - 130.00
LTCUSDT is currently forming a distribution pattern following a period of local consolidation. The price is testing the resistance zone and exhibiting signs of a false breakout. However, it is important to note that the broader cryptocurrency market remains in a corrective phase.
At present, Bitcoin appears relatively weak, undergoing both a correction and short-term consolidation ahead of a potential continuation of the decline toward the 117K-116K range. Within this environment, the recent upward move in LTCUDST may be short lived and could transition into an aggressive decline if the price closes below the key resistance level.
This false breakout, or market manipulation relative to resistance, suggests that LTC’s current rally may represent a local bull trap, particularly amid broader market weakness. A breakdown could lead the pair toward the breakeven or liquidity zone between 124.10 & 115.30
Resistance levels: 132.00, 134.20
Support levels: 124.14, 115.36
A confirmed false breakout of the resistance zone, especially while the altcoin market continues to weaken, could indicate a liquidity grab prior to a deeper market alignment with Bitcoin’s broader correction. Consequently, confirmation of this pattern may serve as a signal for a potential downside move in LTCUSDT.

VBL Price ActionVarun Beverages Ltd (VBL) is currently trading around ₹444, having faced some pressure recently from its peak near ₹664 within the last year. The stock price has seen a decline of about 25% over the past year. It maintains a significant market capitalization exceeding ₹1.5 trillion, reflecting its strong position in the consumer staples sector.
Technically, VBL is below its 50-day and 200-day moving averages, with resistance near ₹485 and support at ₹419. Momentum indicators suggest mild bearishness, though volumes remain steady, indicating investor interest. The stock shows moderate volatility with daily price swings around 1%, and RSI near neutral levels.
Fundamentally, VBL reported a positive quarter with a 64% increase in consolidated revenues quarter-on-quarter, though annual revenue saw a slight dip. Earnings per share stand around ₹8.5 with a price-to-earnings ratio in the mid-50s, indicating a premium valuation. The company enjoys steady market demand with stable margins, but valuation concerns and short-term profit-taking pressure remain.
Overall, VBL remains fundamentally strong but faces technical resistance. Short-term traders should watch for support near ₹420, while medium-term investors may seek a sustained move above ₹485 to confirm the next upward leg.

How to Build a Crypto Portfolio for Long-Term Wealth?Hello Traders!
The crypto market can look exciting, fast profits, new coins every week, and hype everywhere.
But those who build long-term wealth in crypto don’t chase trends; they build structured portfolios with strategy.
Let’s understand how to create a crypto portfolio that can grow steadily over time, not just in bull runs.
1. Decide Your Investment Horizon
Before buying anything, decide your goal, 3 years, 5 years, or 10 years.
Longer horizons allow you to ride out volatility and benefit from compounding.
If you’re thinking short term, you’re speculating, not investing.
2. Allocate Wisely – The 60/30/10 Rule
60%: Blue-chip cryptos like Bitcoin (BTC) and Ethereum (ETH) , the foundation of your portfolio.
30%: Promising large/mid-cap projects (Layer-1s, AI, DeFi leaders).
10%: High-risk, high-reward small-cap or emerging tokens.
This keeps your portfolio stable while still giving growth exposure.
3. Diversify Across Categories
Don’t just hold coins, diversify across crypto sectors:
~Layer-1 platforms (ETH, SOL, AVAX)
~DeFi (AAVE, UNI)
~Infrastructure (LINK, ARB)
~AI/Metaverse (INJ, RNDR, MATIC)
This ensures that if one sector underperforms, others balance your returns.
4. Use SIP or DCA Method
Instead of buying everything at once, invest gradually through Systematic Investment Plans (SIP) or Dollar Cost Averaging (DCA) .
This helps you accumulate more during dips and reduces emotional stress during corrections.
5. Secure and Rebalance Regularly
Use hardware wallets for long-term storage. Don’t keep large amounts on exchanges.
Review your portfolio every 3–6 months and rebalance to maintain original allocation.
Trim profits from overperforming assets and add to undervalued ones.
Rahul’s Tip:
Crypto investing is not about catching every rally, it’s about staying long enough to see technology grow and adoption rise. Patience is your biggest alpha.
Conclusion:
A strong crypto portfolio is like a business, diversified, secure, and managed with discipline.
If you build it smartly, it can become a powerful wealth creator over time.
If this post helped you plan your crypto journey, like it, drop your thoughts in comments, and follow for more practical investment insights!

SOL | Network Strength Meets Market MomentumSolana (SOLUSDT) continues to show resilience as both technical and fundamental factors align for potential upside. On the technical side, the market has completed a controlled correction phase, suggesting liquidity buildup below recent lows. The structure remains bullish, with increasing volume and price stability hinting that buyers are regaining control. Fundamentally, Solana’s network growth and strong developer activity have reinforced investor confidence, supported by rising on-chain activity and ecosystem expansion in DeFi and NFTs. This combination of solid fundamentals and technical structure indicates the possibility of another bullish leg, with SOL positioning itself for a gradual climb toward the $240–$250 range in the near term.

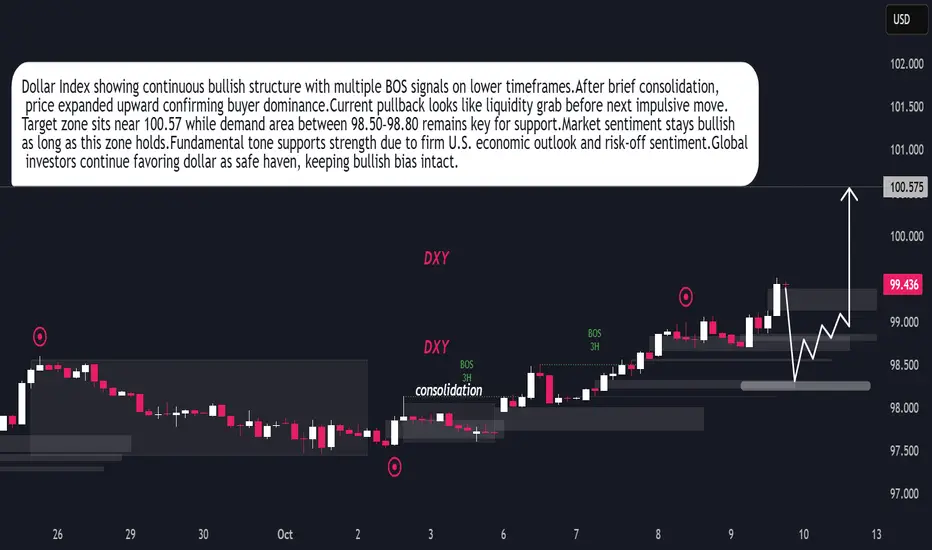
DXY Ready for Next Bullish Leg After Liquidity SweepDollar Index maintaining bullish structure after recent BOS on 3H timeframe.Market formed consolidation phase early October before expansion.Buyers showing control pushing price towards 100.57 objective.Current retracement indicates liquidity grab before next bullish impulse.Demand zone 98.50–98.80 remains key area for continuation.Technical sentiment stays positive as long as price holds above 98.50.Fundamentally, dollar supported by strong U.S. data and cautious global tone favoring safe-haven demand.Momentum outlook remains bullish with potential continuation toward 100.50+ zone.
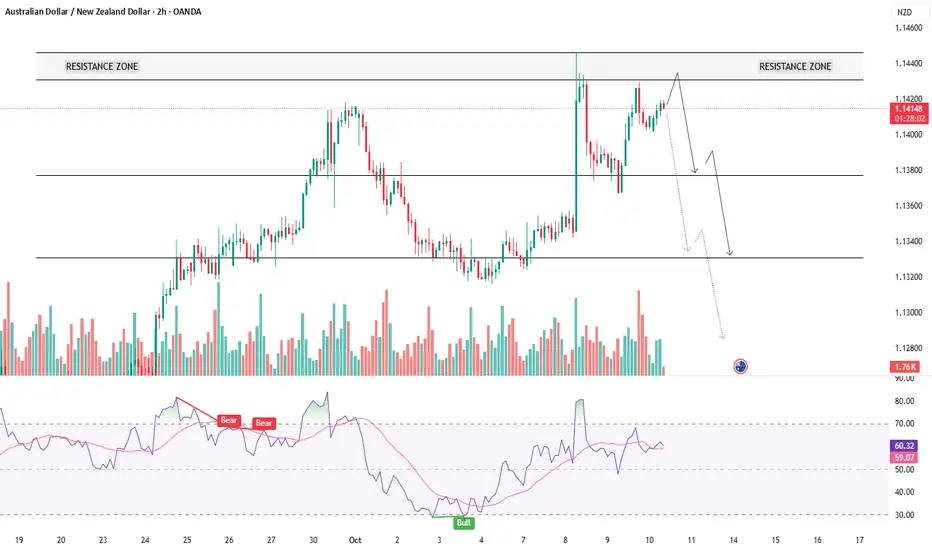
AUDNZD - READY FOR A REVERSAL?Symbol - AUDNZD
CMP - 1.14180
AUDNZD continues to maintain its upward trajectory, supported by fundamental divergence between the two economies. The Australian dollar remains resilient and continues to outperform the New Zealand dollar after the RBNZ implemented an aggressive 50 basis point rate cut, lowering the official cash rate to 2.5% - the lowest level in over three years. The central bank also signaled a willingness to ease further as the domestic economy continues to struggle.
Despite this fundamental backdrop favoring the Australian dollar, the currency pair is showing signs of exhaustion in its bullish momentum and now appears poised for a corrective phase. Selling pressure is becoming evident at higher levels, and if this activity intensifies, AUDNZD could transition into a deeper correction in the near term.
Resistance levels: 1.1430, 1.1455, 1.1472
Support levels: 1.1387, 1.1350
While the overall trend remains upward, the near-term bias has turned bearish as momentum wanes. However, if buyers manage to defend key support levels and regain control, a renewed cycle of bullish momentum may emerge - potentially extending toward higher resistance levels before a broader reversal unfolds.
Part 12 Trading Master ClassMastering the Art of Option Trading
Option trading blends mathematics, psychology, and market logic. It’s not just about predicting direction but understanding probabilities, risk management, and timing. Successful traders treat options as tools for strategic advantage — not gambling tickets.
In essence:
Options = Flexibility + Leverage + Protection.
They empower traders to define risk, hedge intelligently, and profit across market cycles.
But to master them, one must study pricing models, volatility behavior, and trade discipline.
Whether you’re a hedger protecting a portfolio or a speculator chasing momentum, options are the bridge between risk and opportunity — making them one of the most powerful innovations in modern financial markets.

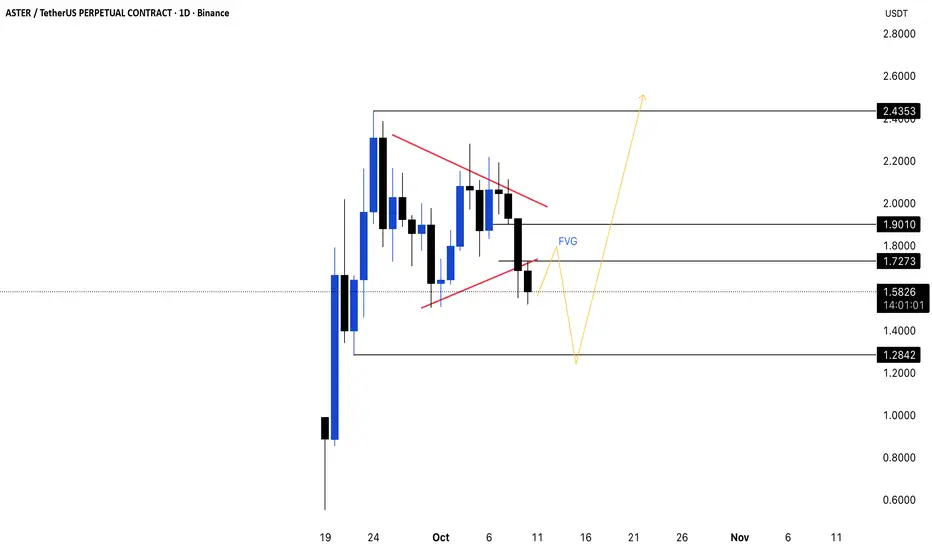
ASTER IS SCAM? FUTURE TARGET !📊 ASTER/USDT 1D Update
🔎 Technical Observation:
- Breakdown from symmetrical triangle, signaling momentum shift.
- Strong bearish impulse candle, price below previous swing low.
- Fair Value Gap (FVG) between $1.73 and $1.90.
⚠️ Key Levels:
- Support: $1.2842
- Resistance: $1.7273, $1.9010, $2.4353
📉 Market Outlook:
- Bearish in the short term after pattern breakdown.
- Likely continuation to test support at $1.2842. Watch for reaction here.
💡 Trade Idea:
- Capitulation drop towards $1.2842 support.
- Anticipate bullish reversal near this zone. Target for reversal: $1.8000 (FVG fill).
- Reclaiming this zone signals bullish momentum towards $2.4353.
✅ Closing Note:
- Reaction at $1.2842 key; look for absorption and reversal signals.