Understanding Fundamental Market Concepts1. Introduction to Financial Markets
Financial markets are platforms where buyers and sellers come together to trade financial instruments. They provide liquidity, transparency, and price discovery, ensuring efficient allocation of resources. Markets are not limited to stocks; they include bonds, commodities, currencies, and derivatives.
Purpose of Financial Markets
Capital formation: Businesses raise funds to expand operations or invest in projects.
Price discovery: Market prices reflect supply-demand dynamics and underlying value.
Liquidity: Investors can quickly buy or sell assets.
Risk transfer: Instruments like derivatives help shift or manage financial risk.
Economic growth: Efficient markets channel capital to productive sectors.
Types of Financial Markets
Stock markets: Trading of company shares.
Bond markets: Trading of debt securities.
Commodity markets: Trading raw materials like metals, energy, and agriculture.
Foreign exchange markets: Currency trading.
Derivatives markets: Trading contracts based on underlying assets.
2. Key Participants in Financial Markets
Understanding participants helps in analyzing market dynamics.
1. Retail Investors
Individuals trading their personal capital.
Motivated by wealth creation, savings growth, or speculation.
2. Institutional Investors
Mutual funds, hedge funds, insurance companies, and pension funds.
They control large capital pools and influence market trends.
3. Brokers and Market Makers
Brokers: Facilitate buying and selling for clients.
Market makers: Provide liquidity by quoting buy and sell prices.
4. Regulators
Ensure market transparency, fairness, and stability.
Examples: SEBI (India), SEC (USA), FCA (UK).
3. Stocks: Ownership in Companies
Stocks, also called equities, represent ownership in a company. Investing in stocks allows individuals to participate in company profits and growth.
Types of Stocks
Common stocks: Voting rights and dividends.
Preferred stocks: Fixed dividends, limited voting rights.
Stock Valuation Metrics
Market Capitalization: Stock price × total shares.
Price-Earnings (P/E) Ratio: Price per share ÷ earnings per share (EPS).
Book Value: Net asset value per share.
Dividend Yield: Annual dividend ÷ stock price.
Stock Indices
Represent performance of a group of stocks.
Examples: Nifty 50, S&P 500, Dow Jones Industrial Average.
Indices serve as benchmarks for investment performance.
Stock Trading Mechanisms
Conducted through stock exchanges like NSE, BSE, NYSE, or NASDAQ.
Primary market: Companies issue shares via IPOs to raise capital.
Secondary market: Existing shares are traded among investors.
4. Bonds and Fixed-Income Instruments
Bonds are debt instruments issued by governments or corporations to raise funds. Investors lend money to issuers and receive periodic interest payments.
Key Bond Concepts
Face value: Amount paid at maturity.
Coupon rate: Interest paid to bondholders.
Yield: Return on investment.
Credit rating: Risk assessment by agencies like Moody’s or S&P.
Types of Bonds
Government bonds (low risk).
Corporate bonds (higher returns, moderate risk).
Municipal bonds (tax advantages in some countries).
Advantages of Bonds
Lower risk than stocks.
Regular income through interest.
Diversification for a balanced portfolio.
5. Commodity Markets
Commodity markets trade raw materials critical for global industries.
Types of Commodities
Metals: Gold, silver, copper.
Energy: Oil, natural gas, coal.
Agricultural: Wheat, coffee, cotton.
Price Determinants
Supply-demand imbalance.
Weather and natural disasters.
Geopolitical events.
Currency fluctuations (especially USD).
Trading Mechanisms
Spot markets: Immediate delivery.
Futures markets: Agreements to buy/sell at future dates.
6. Foreign Exchange Markets
The forex market is the largest global financial market, facilitating currency exchange for trade, investment, and speculation.
Key Concepts
Exchange rate: Value of one currency in terms of another.
Currency pairs: e.g., EUR/USD, USD/INR.
Spot rate vs. forward rate: Immediate vs. future delivery.
Market Participants
Central banks (e.g., RBI, Fed) controlling monetary policy.
Commercial banks facilitating trade and hedging.
Retail and institutional traders speculating on currency movements.
7. Derivatives: Managing Risk
Derivatives are financial instruments whose value is derived from underlying assets (stocks, bonds, commodities, currencies).
Types of Derivatives
Futures: Obligatory contract to buy/sell at a future date.
Options: Right, but not obligation, to buy/sell at a predetermined price.
Swaps: Exchange of cash flows between parties (e.g., interest rate swaps).
Forwards: Customized contracts for future transactions.
Purpose of Derivatives
Hedging: Protect against price fluctuations.
Speculation: Profit from price movements.
Arbitrage: Exploit price differences between markets.
8. Market Analysis Techniques
Investors use multiple approaches to evaluate markets and select investments.
1. Fundamental Analysis
Evaluates intrinsic value based on economic, financial, and industry factors.
Key metrics: Earnings, revenue growth, P/E ratio, debt levels.
Macro factors: Inflation, GDP growth, interest rates, unemployment.
2. Technical Analysis
Studies historical price and volume patterns to predict future movements.
Tools: Candlestick charts, moving averages, RSI, MACD.
3. Sentiment Analysis
Gauges investor mood using news, surveys, and social media trends.
Important for predicting short-term market movements.
9. Risk and Money Management
Effective risk management ensures sustainable returns and protects capital.
Types of Market Risk
Market risk: Loss due to price movements.
Credit risk: Borrower fails to repay.
Liquidity risk: Inability to sell assets quickly.
Operational risk: Failures in systems or processes.
Risk Mitigation Techniques
Diversification: Spread investments across sectors and asset classes.
Position sizing: Invest proportionally to portfolio value.
Stop-loss orders: Limit potential losses on trades.
10. Global Market Awareness
Markets are increasingly interconnected, influenced by global economic and geopolitical developments.
Key Influencers
Global indices: S&P 500, FTSE 100, Nikkei 225 indicate economic trends.
Currency movements: Affect trade and multinational companies.
Central bank policies: Interest rate changes and quantitative easing impact markets.
Geopolitical events: Wars, elections, trade agreements affect market sentiment.
Importance
Investors must track international trends to make informed decisions.
Global awareness aids in risk diversification and long-term strategy planning.
11. Financial Products and Instruments
Investors have multiple options to gain exposure to markets:
Mutual funds: Pooled investment managed by professionals.
Exchange-Traded Funds (ETFs): Traded like stocks, tracking indices or commodities.
Real Estate Investment Trusts (REITs): Income from property portfolios.
SIP (Systematic Investment Plan): Periodic investment in mutual funds.
IPOs and FPOs: Opportunities to invest in companies at the primary market level.
These products help investors tailor risk-return profiles to their financial goals.
12. Building a Market Mindset
Successful investors develop a disciplined mindset:
Patience: Long-term wealth creation over short-term gains.
Continuous learning: Understanding evolving market trends.
Adaptability: Adjusting strategies based on economic changes.
Analytical thinking: Making decisions based on data, not emotions.
Conclusion
Mastering fundamental market concepts involves understanding market structures, instruments, participants, and analysis techniques. Investors equipped with this knowledge can navigate stocks, bonds, commodities, forex, and derivatives, balancing risk and return. Global awareness, disciplined risk management, and continuous learning are essential for sustainable market success.
The world of financial markets may appear complex initially, but breaking it down into structured learning—starting with basic concepts and progressing to global strategies—enables anyone to become a confident, informed market participant.
Fundamental Analysis

Market Rotation and Its Types1. Introduction
Market rotation is a core concept in financial markets that refers to the movement of capital from one sector, asset class, or investment style to another. It is a natural outcome of the ever-changing economic, political, and financial environment. By understanding market rotations, investors and traders can anticipate trends, optimize portfolio performance, and manage risks effectively.
Market rotations are often influenced by macroeconomic conditions, monetary policy, investor sentiment, interest rate cycles, inflation trends, and geopolitical developments. They reflect the underlying shifts in investor risk appetite and the changing opportunities across different segments of the market.
Importance of Market Rotation
Enhances Investment Returns: By investing in sectors or styles that are in favor, investors can capitalize on trends before they peak.
Reduces Risk: Market rotation helps avoid sectors or assets that may underperform during certain economic phases.
Portfolio Optimization: Active investors and fund managers use rotation strategies to balance growth and defensive assets.
Economic Insight: Observing rotations provides insight into where the economy is headed, as different sectors react differently to economic cycles.
2. The Concept of Market Rotation
Market rotation can be understood as a strategic reallocation of capital across different market segments. Investors move their money based on perceived risk, expected returns, and economic cycles. These rotations are cyclical and often predictable to some extent, making them an essential tool for traders and portfolio managers.
Rotations can happen:
Between sectors (e.g., technology to energy)
Between investment styles (e.g., growth to value)
Across regions (e.g., emerging markets to developed markets)
Between asset classes (e.g., stocks to bonds or commodities)
Within market capitalizations (e.g., large-cap to small-cap)
Characteristics of Market Rotation
Cyclical: Rotations often follow the economic cycle: expansion, peak, contraction, and recovery.
Predictable to Some Extent: Historical data and economic indicators can provide clues.
Influenced by External Factors: Geopolitical events, monetary policy changes, inflation, and market sentiment play key roles.
Sector-Specific: Not all sectors respond similarly to economic changes; some outperform while others lag.
3. Types of Market Rotation
Market rotations can be broadly classified into several types. Understanding these types helps investors position themselves strategically in different market conditions.
3.1 Sector Rotation
Sector rotation occurs when capital shifts from one industry sector to another based on economic conditions or market cycles. Different sectors perform differently during different stages of the business cycle.
Economic Cycle and Sector Performance
Expansion Stage: Economic growth is strong, consumer demand is high.
Best Performing Sectors: Consumer discretionary, industrials, technology.
Why: Companies expand, invest, and consumer spending rises.
Peak Stage: Growth reaches its highest point, inflation may rise.
Best Performing Sectors: Energy, materials, financials.
Why: Rising interest rates favor financials; inflation benefits commodity-linked sectors.
Contraction Stage: Economic growth slows or falls, unemployment rises.
Best Performing Sectors: Utilities, consumer staples, healthcare.
Why: These sectors provide essential goods and services, acting as defensive investments.
Recovery Stage: Economy begins to grow after a downturn.
Best Performing Sectors: Industrials, technology, cyclicals.
Why: Increased capital expenditure and demand for goods and services spur growth.
Example of Sector Rotation:
During the 2008-2009 financial crisis, capital moved from financials and cyclicals to defensive sectors like utilities and consumer staples. Post-crisis, recovery saw a rotation back to technology, industrials, and consumer discretionary sectors.
3.2 Style Rotation
Style rotation refers to the movement of capital between different investment styles, most commonly growth and value investing.
Growth vs. Value
Growth Stocks: Companies with high expected earnings growth, often tech or emerging sectors.
Value Stocks: Companies trading at lower valuations relative to earnings, assets, or dividends.
Drivers of Style Rotation
Interest Rate Changes: Rising interest rates generally favor value over growth stocks because growth stocks have high future earnings discounted more heavily.
Economic Conditions: Economic recovery may favor growth stocks; recession may favor value stocks with stable earnings.
Investor Sentiment: Risk-on sentiment favors growth; risk-off sentiment favors value.
Example:
In 2022, inflation and interest rate hikes triggered a style rotation from growth tech stocks to value sectors like energy, financials, and industrials.
3.3 Geographic Rotation
Geographic rotation involves the movement of capital between countries or regions. Investors shift funds based on macroeconomic conditions, currency strength, and geopolitical stability.
Key Considerations
Developed vs. Emerging Markets: During risk-on periods, capital often flows into emerging markets for higher returns. In risk-off periods, funds move to safer developed markets.
Currency Movements: Strong domestic currencies can attract foreign investment; weak currencies may discourage inflows.
Political and Economic Stability: Investors prefer regions with stable governance and economic policies.
Example:
During periods of global uncertainty, investors may rotate capital from emerging markets like Brazil or India to safer markets like the US or Germany.
3.4 Asset Class Rotation
Asset class rotation is the shifting of capital between equities, bonds, commodities, and cash equivalents.
Drivers of Asset Rotation
Interest Rate Changes: Rising rates make bonds less attractive and equities more attractive in certain sectors like financials.
Inflation: Commodities often outperform during high inflation.
Risk Appetite: During uncertainty, investors rotate from equities to bonds or gold as safe havens.
Example:
In 2020, during the COVID-19 crisis, investors rotated heavily into bonds and gold, while equities suffered. As markets recovered, capital rotated back into equities, particularly tech and healthcare.
3.5 Market Capitalization Rotation
Market capitalization rotation refers to capital moving between large-cap, mid-cap, and small-cap stocks based on risk appetite and economic conditions.
Characteristics
Small-Cap Stocks: Higher growth potential but higher risk; perform well during economic expansion.
Mid-Cap Stocks: Balanced risk and growth; often outperform during early recovery.
Large-Cap Stocks: Stable and defensive; preferred during market uncertainty or downturns.
Example:
During the 2020 recovery, small-cap and mid-cap indices in India and the US outperformed large-cap indices as investors sought higher growth potential.
4. Drivers of Market Rotations
Market rotations are driven by several macroeconomic, financial, and behavioral factors:
Economic Cycles: Each stage of the business cycle favors different sectors or investment styles.
Interest Rates: Central bank policies affect discount rates and equity valuations.
Inflation Trends: Inflation favors commodities and value stocks, while low inflation favors growth stocks.
Monetary and Fiscal Policy: Quantitative easing, stimulus packages, or tightening measures shift capital allocation.
Geopolitical Events: Wars, sanctions, and political instability trigger risk-on/risk-off rotations.
Market Sentiment and Psychology: Investor optimism or fear often leads to defensive or aggressive rotations.
5. Indicators to Track Market Rotations
Sector Performance Charts: Monitor relative strength of sectors against indices.
ETF Fund Flows: Money inflows/outflows indicate where capital is rotating.
Interest Rate Spreads and Yield Curves: Signal upcoming rotation between growth and value.
Commodities and Currency Movements: Rising commodity prices may trigger rotation into energy and materials sectors.
Market Breadth Indicators: Identify which sectors or asset classes are leading or lagging.
6. Popular Rotation Patterns
Cyclical → Defensive: Seen during economic slowdowns; investors move to utilities, consumer staples, healthcare.
Growth → Value: Triggered by rising interest rates or market uncertainty.
Large-Cap → Small/Mid-Cap: Risk-on environments favor smaller, high-growth companies.
Equities → Bonds/Gold: Risk-off periods push investors into safer assets.
Commodity-Led Rotation: Inflationary trends favor metals, energy, and materials.
7. Tools and Strategies for Tracking Rotations
Relative Strength Analysis: Compare sector ETFs or indices to identify outperformers.
ETF Investing: Easy way to rotate capital across sectors without picking individual stocks.
Quantitative and AI Models: Predict sector rotation using economic indicators.
Momentum and Trend Following: Rotate into sectors with strong price momentum.
Fund Flow Analysis: Monitor institutional and retail investor activity.
8. Historical Examples of Market Rotations
2008-2009 Financial Crisis: Defensive sectors like utilities and staples outperformed; cyclicals and financials lagged.
2020 COVID-19 Crisis: Rotation from equities to bonds and gold. Post-crisis recovery saw rotation back into tech, healthcare, and consumer discretionary.
2022 Inflation and Rate Hikes: Growth stocks underperformed, value sectors and commodities led the market.
9. Advanced Topics in Market Rotation
Cross-Asset Rotations: Understanding correlations between stocks, bonds, commodities, and currencies.
Intermarket Analysis: Using bond yields, equity indices, and commodity prices to anticipate rotation.
Quantitative Models and AI Predictions: Using data-driven methods to predict rotation trends.
Behavioral Finance Insights: How fear, greed, and sentiment drive rotations.
Global Macro Rotations: Monitoring central bank policies, geopolitical events, and trade developments.
10. Conclusion
Market rotation is an essential concept in trading and investing. By understanding its types, drivers, and patterns, investors can make informed decisions, optimize portfolios, and capitalize on trends.
Sector Rotation: Aligns investments with economic cycles.
Style Rotation: Adjusts between growth and value stocks.
Geographic Rotation: Shifts capital based on regional opportunities and risks.
Asset Class Rotation: Moves funds across stocks, bonds, commodities, and cash.
Market Capitalization Rotation: Optimizes risk-reward by moving across large, mid, and small-cap stocks.
Incorporating market rotation strategies into investment planning can significantly enhance returns while managing risk, making it a vital tool for traders, fund managers, and individual investors alike.

LiamTrading – XAUUSD Trading Scenario for TodayGold continues its robust upward momentum and is now approaching the critical resistance zone around 3,697 – 3,700. This is a confluence point with the Fibonacci extension level and also a zone where sellers might re-enter strongly.
Technical Analysis
On the H1 chart, the price has tested the resistance zone multiple times but hasn't broken through decisively. This indicates that profit-taking pressure is emerging.
The sell confirmation zone will form if the price breaks below 3,685 – 3,686, at which point the correction target could be around 3,673.
The main Buy Zone is located at 3,650 – 3,645, coinciding with previous support and a strong liquidity area. This is a region where a price increase reaction is likely.
Further down, the 3,628 – 3,630 zone is considered solid support on the larger frame, and if retested, it will be a long-term buying opportunity.
Conversely, if the price decisively surpasses the strong resistance zone of 3,720 – 3,730, the upward trend will be confirmed to continue, opening up higher targets around 3,750+.
Trading Plan Reference
Short-term sell around 3,697 – 3,700, SL 3,707, TP 3,686 – 3,673.
Short-term buy around 3,650 – 3,645, SL 3,640, TP 3,673 – 3,690.
Long-term buy around 3,628 – 3,630, SL 3,620, TP 3,660 – 3,690 – 3,720.
These are my personal views on XAUUSD, and you can use them as a reference to build your own plan. If you find this useful, follow me for the latest updates on new gold trading scenarios.

Stock Analysis: Petronet LNG Ltd Fundamentals:
Market Cap: ₹ 41,782 Cr.;
Stock P/E: 11.3 (Ind. P/E: 20.35 ) 👍;
ROCE: 25.4% 👍; ROE: 21.2% 👍;
3 Years Sales Growth: 6% 👎;
3 Years Compounded Profit Growth: 5% 👎;
3 Years Return on Equity: 22% 👍
Technicals:
Resistance levels: 273, 267
Support levels: 281, 308, 325, 345
Petronet LNG is trading near important crossover level 9 EMA(Orange Line) just above the 21 EMA (Black Line).

XAUUSD – Daily Trading Plan
Hello Traders,
Gold opened the Asian session holding its price structure firmly. The 3708 level will be the key pivot today:
If price sustains above this level, the next upside targets are 3750 and possibly 3780.
If price reacts lower at 3708 resistance, then 3650 or even 355x could be the zones to watch for buying opportunities.
Fundamental Context
Last week’s correction was triggered by comments from the Fed Chair on interest rate policy. The Fed does not intend to cut rates too frequently, and this week’s PCE data will play a decisive role in shaping the outlook.
Trading Strategy for Today
Buy Setup
Entry: 3650 – 3653
SL: 3645
TP: 3662 – 3675 – 3690 – 3706 – 3725
Sell Setup 1
Entry: 3700 – 3703
SL: 3708
TP: 3690 – 3675 – 3662 – 3650 – 3633
Sell Setup 2
Entry: 3738 – 3740
SL: 3746
TP: 3725 – 3710 – 3700 – 3675 – 3650
Summary
The preferred bias for today is to look for buy opportunities on dips, in line with the broader uptrend.
Follow me to receive the latest updates as soon as market structure changes

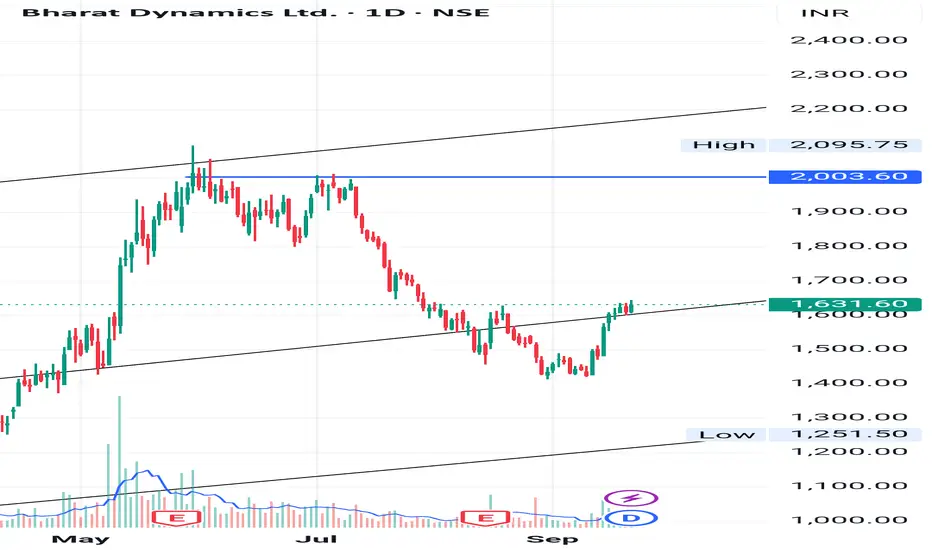
Pattern and line shows upmoveThe volume seems to be increasing. After drawing lines, it seems like, its above support, retested with single candle. It is government linked company, hence anyhow having good background. Currently showing upmove. One can view stock, study and can buy if felt so.
Option Trading1. Real-World Opportunities
1.1. Equities and Index Options
Profitable in bullish, bearish, or sideways markets.
Examples: Nifty, Bank Nifty, Sensex options in India; S&P 500, Nasdaq options globally.
1.2. Commodity Options
Crude oil, gold, and agricultural commodities offer opportunities based on seasonality, geopolitical events, and supply-demand dynamics.
Traders can use options to hedge inventory or speculate on price movements.
1.3. Currency Options
Companies and investors hedge foreign exchange exposure using currency options.
Traders speculate on currency pairs like USD/INR, EUR/USD with directional or volatility-based strategies.
1.4. Volatility Trading
Options on volatility indices (like India VIX or CBOE VIX) provide opportunities to trade market sentiment rather than price.
2. Emerging Opportunities in Options Markets
Algorithmic Options Trading: Using AI and machine learning to exploit inefficiencies and price anomalies.
Synthetic Positions: Combining options to mimic stock positions at lower capital.
Weekly and Short-Term Options: Increasingly popular for nimble traders seeking frequent opportunities.
Cross-Asset Strategies: Trading options across equities, commodities, and currencies for diversified opportunities.
3. Practical Tips for Maximizing Opportunities
Educate Continuously: Understanding greeks (Delta, Gamma, Theta, Vega) is crucial.
Start Small: Begin with defined-risk trades before exploring complex strategies.
Focus on Liquidity: Trade options with high open interest to avoid slippage.
Monitor Volatility: Use IV percentile and historical volatility comparisons to identify opportunities.
Event-Based Trading: Plan trades around earnings, FOMC meetings, or geopolitical events for maximum edge.
Options trading presents endless opportunities for traders who approach the market with knowledge, strategy, and discipline. From generating income, hedging risk, or speculating on directional and volatility moves, options provide a flexible, capital-efficient, and strategic way to participate in financial markets.
Successful trading relies on:
Understanding the fundamentals of options.
Applying strategies aligned with market conditions.
Maintaining disciplined risk management.
Continuously adapting to evolving markets.
For both individual investors and professional traders, options are not just tools—they are pathways to sophisticated financial strategies that can enhance returns, manage risk, and exploit market opportunities.

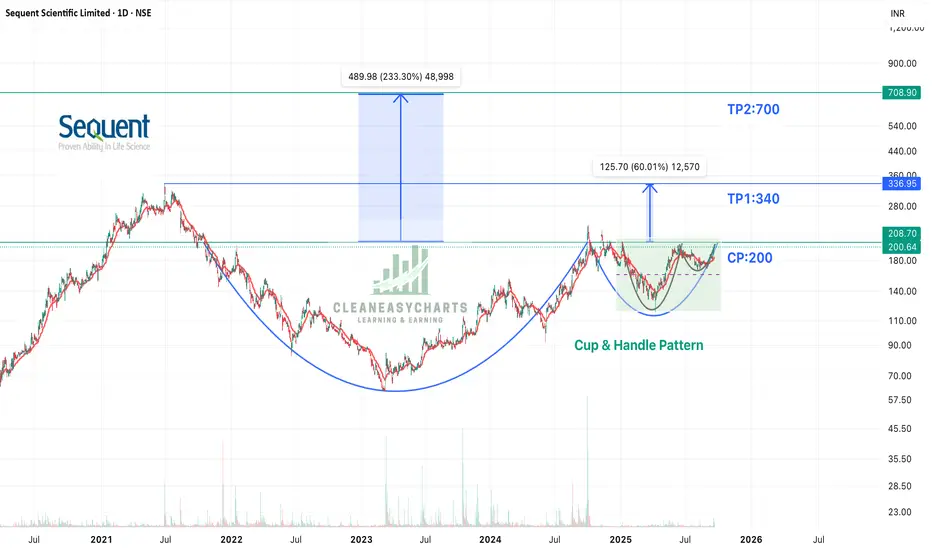
Sequent Scientific - 2 CUP & HANDLE PatternsSequent Scientific is heading for a 60% to 200% upside. Following are the factors:
Technical Factors:
1. 2 Cup & Handle Patterns waiting for a breakout
2. Small Cup & Handle - giving a potential upside of 60%
3. Large Cup & Handle - giving a potential upside of 200%+
4. Price respecting 20EMA
Technical Factors:
1. India's largest animal healthcare company and world's top 20 companies
2. Merger with Viyash - on the verge of completion
3. Post merger - Big Topline and Big Profits
Do keep this stock in your watchlist. Keep following @Cleaneasycharts as we provide Right Stocks at Right Time at Right Price.
Cheers!!
LiamTrading – Long-Term Trend for XAUUSD is Taking ShapeGold continues its robust upward momentum, currently trading around 3,680 – 3,685. After a series of consecutive bullish candles, the price is showing signs of consolidation and slight adjustment, paving the way for crucial scenarios in the upcoming phase.
Technical Analysis
On the Daily chart, the RSI has surpassed the 70 mark, indicating an overbought condition. This is often an early warning sign for a potential correction.
The price structure suggests that the FVG zone of 3,630 – 3,600 will be the first observation point if a short-term correction occurs.
A stronger support zone lies at 3,510 – 3,475, coinciding with Fibonacci levels 0.5 – 0.382, and also the previous resistance area that has been broken. This is considered a potential long-term 'Buy zone'.
If the correction completes, gold has the potential to return to its upward trend with a further target around 3,800 (Fibonacci extension levels 2.618 – 3.618).
Trading Scenarios
Short-term: Monitor the reaction at 3,630 – 3,600. If it holds, there might be a short recovery.
The price area around 3552-3562 should be watched for reactions.
Medium-term: Wait for the price to test the 3,500 – 3,475 zone to find more sustainable buying opportunities.
Long-term: The major trend still leans towards an increase, with an expected target towards 3,800.
This is my personal view on XAUUSD, and you can consider it to build your own plan. If you find it useful, follow me for the latest updates on gold's upcoming scenarios.

XAUUSD – Strong Resistance at 3760–3770 Await ConfirmationHello trader,
Gold continues to fluctuate within the accumulation zone after the recent recovery. Although the larger trend leans towards an increase, a clear confirmation at key resistance-support levels is needed for a stronger breakout.
Strong Resistance: 3760 – 3770, converging with the Fibonacci extension zone. This is a crucial level if the price aims to create a new ATH in the mid-term.
Key level Sell: 3685 – 3695, currently a short-term resistance zone. If the price fails to break through, gold may face downward pressure.
Important Support:
3564 – 3574: mid-term support.
3534 – 3540: deep support zone, aligning with previous liquidity.
MACD H4: Histogram remains weak, momentum is unclear → the market needs further confirmation to clearly define the trend.
Trading Scenario
Bullish Scenario
Condition: Price breaks above 3695 and holds.
Entry: Retest 3665 – 3668.
Target: 3680-3698-3715-3730 – 3760 – 3770.
Extension: If successfully surpassing 3770 → expect a move towards 3800+.
Bearish Scenario
Condition: Price fails at 3695 and reverses.
Entry: Sell at 3685 – 3695 zone upon rejection signal.
Target: 3672-3655-3635 – 3600 – 3574.
Extension: If breaking 3574, the decline may target 3540, or even deeper.
Mid-term Scenario
Price may retest 3534 – 3550 to gather liquidity, then rebound following the larger trend. This will be an attractive long-term Buy zone.
The gold market is at a crucial stage: buyers need to break 3695 to confirm the uptrend, while sellers still have opportunities at the short-term resistance zone. Deep support levels will continue to serve as a foundation for mid-term Buy strategies.
Keep a close watch on 3695 and 3760 – 3770 to determine the next direction.
Stay tuned for the latest scenarios as the price structure evolves.

Polycab India: Strong Q1 Powers Return to Supply ZoneTechnical Analysis
Polycab India has demonstrated exceptional technical progression showcasing a remarkable super bullish rally over the past few years. Before COVID, the stock was trading at ₹1,200 levels, but the pandemic-induced correction brought it down to ₹600 - representing a significant 50% decline from pre-COVID highs.
However, the post-COVID recovery proved extraordinary as the stock embarked on a phenomenal journey, surging from ₹600 lows directly to ₹7,300 by June 2024 - representing an incredible 12x growth in just over 4 years. This massive rally established Polycab as one of the top performing stocks in the electrical equipment sector.
The ₹7,300-7,600 zone has acted as formidable resistance multiple times, creating a critical supply area that has tested the stock's momentum repeatedly. When this resistance proved too strong, the stock underwent a sharp correction down to ₹4,500 levels by February 2025, representing a significant 38% decline from the highs.
The game-changing catalyst arrived with strong Q4 FY25 results followed by impressive Q1 FY26 performance, showcasing record revenue growth and robust profitability. These stellar quarterly numbers provided the momentum needed to stage a remarkable recovery back toward the supply zone.
Currently trading at ₹7,549, the stock has successfully returned to the critical 7,300-7,600 supply zone. If this resistance transforms into robust support with bullish candlestick pattern confirmation and volume backing, the technical setup appears highly favorable for the next leg of rally.
Entry Strategy: Monitor for breakout above ₹7,600 with strong volume confirmation, or enter on dips toward ₹7,300 if it holds as support.
Targets:
Target 1: ₹8,000
Target 2: ₹8,500
Target 3: ₹9,000
Stop Losses:
Critical Stop: ₹7,200 (below supply zone support)
If ₹7,300-7,600 supply zone doesn't act as support or shows rejection, caution advised on further expectations.
Q1 FY26 Financial Highlights (vs Q4 FY25 & Q1 FY25)
Total Income: ₹5,906 Cr (↓ -15.5% QoQ from ₹6,986 Cr; ↑ +25.7% YoY from ₹4,698 Cr)
Total Expenses: ₹5,048 Cr (↓ -15.3% QoQ from ₹5,960 Cr; ↑ +22.7% YoY from ₹4,115 Cr)
Operating Profit: ₹858 Cr (↓ -16.3% QoQ from ₹1,025 Cr; ↑ +47.2% YoY from ₹583 Cr)
Profit Before Tax: ₹801 Cr (↓ -16.6% QoQ from ₹961 Cr; ↑ +50.3% YoY from ₹533 Cr)
Profit After Tax: ₹600 Cr (↓ -18.3% QoQ from ₹734 Cr; ↑ +49.3% YoY from ₹402 Cr)
Diluted EPS: ₹39.34 (↓ -18.6% QoQ from ₹48.31; ↑ +49.3% YoY from ₹26.34)
Fundamental Highlights
Polycab India delivered spectacular Q1 FY26 performance with PAT surging an exceptional 49.3% YoY to ₹600 crore, driven by strong performance in the Wires & Cables business which led to a robust 25.7% YoY revenue growth. The company's consolidated net profit spiked 49.32% with revenue rising 25.71% to ₹5,906 crore in Q1 FY26, with the Wires & Cables segment leading the growth momentum.
As India's largest manufacturer of wires and cables, Polycab dominates the market with 84% revenue contribution from the W&C segment in FY25, offering a diverse product portfolio including flexible wires, building wires, optical-fiber cables, and control cables. The company's integrated manufacturing approach provides significant competitive advantages in cost management and quality control.
Market cap stands at ₹1,12,867 crore (up 14.9% in 1 year) with stable promoter holding of 63.0%, indicating strong management confidence. The company achieved record-breaking revenues and profitability, surpassing ₹220 billion and ₹20 billion respectively, solidifying its position as both the largest and most profitable company in the electrical industry.
The wires & cables industry accounts for 40-45% of the electrical equipment industry with a market size of ~₹50,000 crores, demonstrating double-digit growth over the last decade driven by electrification and infrastructure development. This provides strong sectoral tailwinds for sustained growth.
Polycab plans to maintain capex levels between ₹10-11 billion annually over the next three years, positioning the company for sustained growth and market leadership. The Power Ministry's ₹2,440 billion plan to build over 50,000 km of transmission lines for renewable capacity evacuation provides massive growth opportunities.
Operating margin resilience demonstrated through 47.2% YoY operating profit growth despite seasonal revenue patterns, showcasing superior operational efficiency. The company's focus on infrastructure projects, real estate expansion, and export markets drives consistent revenue diversification.
India's electric wire and cable market is projected to grow by USD 2.14 billion (2024-2028), driven by infrastructure development, energy demands, and digitization, with Polycab well-positioned as a market leader. Strategic expansion in renewable energy transmission and distribution sectors aligns with India's green energy transition.
Conclusion
Polycab India's outstanding 49.3% YoY PAT growth and 25.7% revenue surge in Q1 FY26 validates its return to the critical 7,300-7,600 supply zone, creating compelling technical and fundamental convergence. The company's market leadership position, record profitability, and strong sectoral tailwinds from India's infrastructure boom and renewable energy transition provide robust backing for sustained growth. Critical resistance at ₹7,600 breakout could unlock significant upside toward the ₹9,000 target zone. The stock's remarkable recovery from ₹4,500 lows to current levels demonstrates strong underlying business fundamentals supporting the technical rally.
Disclaimer: tinyurl.com

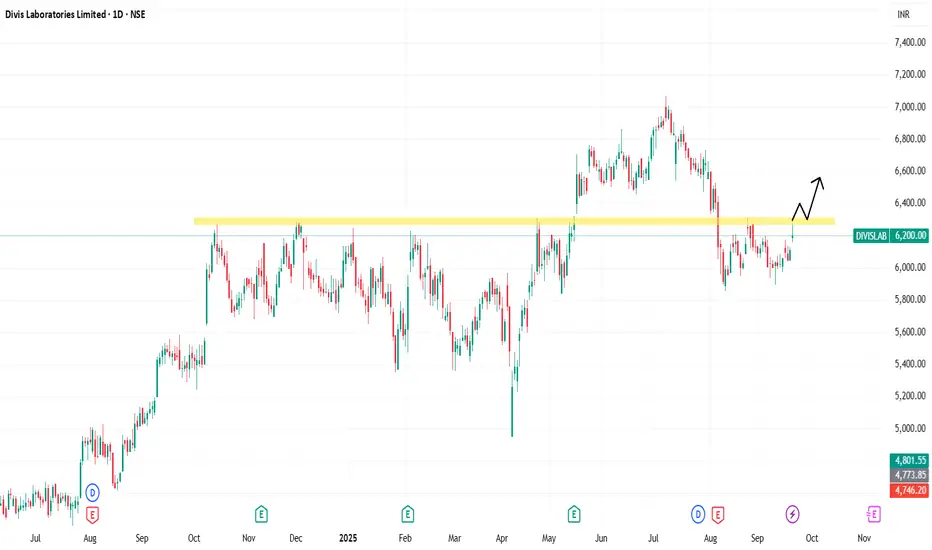
Divis Labs: Stellar FY25 Results Set Stage for Fresh Breakout🔍 Technical Analysis
Divis Laboratories has demonstrated exceptional technical progression with a super bullish rally spanning an incredible 2 decades, establishing itself as one of India's premier pharma success stories. The stock's consistent uptrend reflects the company's strong fundamentals and market leadership in the API segment.
From October 2024, the ₹6,250-6,300 zone emerged as formidable resistance, creating a critical supply area that tested multiple times. However, the game-changing catalyst arrived with the announcement of stellar FY25 results showcasing record revenue growth and impressive profitability metrics.
The positive FY25 performance and strong YoY growth provided the momentum needed to break above the stubborn ₹6,250-6,300 supply zone, with the stock rallying impressively to ₹7,071 - marking a significant 13% surge from resistance levels.
However, profit-booking and market volatility caused a correction back to ₹5,800 levels, and the stock is now trading at ₹6,200, finding itself once again at the critical supply zone. This same resistance area that was conquered earlier now acts as a key battleground for the next directional move.
Entry Strategy: Enter on confirmed breakout above ₹6,300 with strong volume, or accumulate on dips if ₹6,200 holds as support with bullish candlestick patterns.
🎯 Targets:
Target 1: ₹6,600
Target 2: ₹6,800
Target 3: ₹7,000
🚫 Stop Losses:
Critical Stop: ₹6,100 (below current support zone)
If this zone doesn't sustain and shows rejection, no more expectations on this stock.
💰 FY25 Financial Highlights (vs FY24 & FY23)
Total Income: ₹9,360 Cr (↑ +19.3% YoY from ₹7,845 Cr; ↑ +20.5% vs ₹7,767 Cr in FY23)
Total Expenses: ₹6,387 Cr (↑ +13.3% YoY from ₹5,635 Cr; ↑ +18.3% vs ₹5,397 Cr in FY23)
Operating Profit: ₹2,973 Cr (↑ +34.5% YoY from ₹2,210 Cr; ↑ +25.4% vs ₹2,370 Cr in FY23)
Profit Before Tax: ₹2,916 Cr (↑ +34.8% YoY from ₹2,163 Cr; ↑ +23.1% vs ₹2,369 Cr in FY23)
Profit After Tax: ₹2,191 Cr (↑ +36.9% YoY from ₹1,600 Cr; ↑ +20.1% vs ₹1,824 Cr in FY23)
Diluted EPS: ₹82.53 (↑ +37.0% YoY from ₹60.27; ↑ +20.1% vs ₹68.71 in FY23)
🧠 Fundamental Highlights
Divis Laboratories delivered spectacular FY25 performance with PAT surging an exceptional 36.9% YoY to ₹2,191 crore, driven by robust demand for APIs and strong execution across all business segments. Revenue surged 19% to Rs 9,712 crore while net profit jumped 37% to Rs 2,191 crore, reflecting strong demand for APIs and robust growth momentum.
The company demonstrated remarkable quarterly consistency with Q3FY25 net profit of Rs 589 crore, up 64.5% Y-o-Y, and EBITDA rising to Rs 743 crore with margins improving to 32.04% from 26.9%. Q2 FY25 achieved consolidated revenue of ₹2,444 crore, up 22.50% YoY, with PAT of ₹510 crore, up 46.55% YoY.
Market cap stands at ₹1,63,282 crore with the company maintaining healthy dividend payout of 43.2%, demonstrating strong cash generation capabilities. Divi's Laboratories stands out as the sector's most preferred name, valued for its strong track record and broad domestic ownership with mid- to long-term growth visibility.
The company has positioned itself strategically for future growth with aggressive capex of ~₹1000-2000 crore including greenfield Kakinada plant over next two years to capture ~US$20 billion opportunity of APIs going off-patent over FY23-25.
Strong business mix with custom synthesis and generics contributing 53% and 47% respectively, while EBITDA margins expanded from 26.4% to 32%, showcasing superior operational efficiency and pricing power in premium API segments.
New Unit-3 operations started with ₹30/share dividend declared, indicating continued capacity expansion and shareholder-friendly policies. The company's focus on complex APIs and custom synthesis provides sustainable competitive advantages and higher margin profiles.
It is rare to find an Indian pharma company which makes systematic investments towards building customer trust, improving compliance and ramping up manufacturing efficiency, positioning Divis as a quality leader in the global API space.
Operating margin expansion from previous years demonstrates excellent cost management and operational leverage benefits. Strong balance sheet fundamentals and consistent profitability growth support the technical breakout thesis for sustained momentum in the premium pharma segment.
✅ Conclusion
Divis Laboratories' outstanding 36.9% YoY PAT growth and 19.3% revenue surge in FY25, coupled with consistent quarterly outperformance, creates compelling technical and fundamental convergence at the critical ₹6,200-6,300 zone. The company's market leadership position, aggressive expansion plans targeting $20 billion off-patent opportunity, and strong sectoral tailwinds provide robust backing for sustained growth. Critical breakout above ₹6,300 with volume confirmation could unlock significant upside toward the ₹7,000 target zone. The 2-decade wealth creation journey continues with fresh technical setup favoring further upside in this premium API play.
SBI: Strong Q1 Performance Breaks Key Resistance🔍 Technical Analysis
State Bank of India has demonstrated impressive technical progression with a super bullish rally that culminated in creating an All-Time High of ₹912 in June 2024. This historic peak marked the zenith of a remarkable multi-year uptrend that established SBI as one of the top-performing banking stocks.
However, from the ATH levels, the stock entered a corrective phase, continuously falling while creating lower highs - a classic bearish pattern that concerned many investors. The recent lower high was formed at ₹840, which acted as formidable resistance multiple times, creating a critical supply zone that tested the stock's recovery momentum.
The game-changing catalyst arrived with the announcement of strong Q1 FY26 results, showcasing record profitability and robust operational metrics. These stellar quarterly numbers provided the momentum needed to finally break above the stubborn ₹840 resistance level on September 17th, 2025, with strong volume confirmation.
Currently trading at ₹862, the stock has successfully conquered the ₹840 resistance zone that had been acting as a ceiling for months. If this breakout sustains and the previous resistance transforms into robust support, the technical setup appears highly favorable for the next leg of rally toward the ATH levels.
Entry Strategy: Enter on any dips toward ₹840-850 range, ensuring the old resistance holds as new support with volume confirmation.
🎯 Targets:
Target 1: ₹880
Target 2: ₹900
Target 3: ₹920
🚫 Stop Losses:
Critical Stop: ₹840 (previous resistance, now key support)
If market doesn't sustain above ₹840 levels, no more expectations on this stock.
💰 Q1 FY26 Financial Highlights (vs Q4 FY25 & Q1 FY25)
Total Income: ₹1,25,729 Cr (↓ -1.0% QoQ from ₹1,26,997 Cr; ↑ +6.3% YoY from ₹1,18,242 Cr)
Total Interest: ₹78,266 Cr (↑ +0.05% QoQ from ₹78,227 Cr; ↑ +9.2% YoY from ₹71,701 Cr)
Total Expenses: ₹59,496 Cr (↓ -20.1% QoQ from ₹74,438 Cr; ↑ +10.2% YoY from ₹53,996 Cr)
Operating Profit: ₹-12,034 Cr (Better QoQ from ₹-25,668 Cr; Improved YoY from ₹-7,455 Cr)
Profit Before Tax: ₹29,229 Cr (↑ +8.7% QoQ from ₹26,897 Cr; ↑ +10.6% YoY from ₹26,428 Cr)
Profit After Tax: ₹22,121 Cr (↑ +8.5% QoQ from ₹20,379 Cr; ↑ +10.1% YoY from ₹20,094 Cr)
Diluted EPS: ₹23.76 (↑ +8.2% QoQ from ₹21.96; ↑ +9.7% YoY from ₹21.65)
🧠 Fundamental Highlights
State Bank of India delivered exceptional Q1 FY26 performance with PAT surging 10.1% YoY to ₹22,121 crore, demonstrating remarkable resilience and operational excellence. SBI remained the top performer among PSBs, contributing 43% of total Q1 earnings with net profit of ₹19,160 crore, marking a 15% YoY increase, solidifying its position as India's most profitable bank.
Public sector banks collectively posted record profit of ₹44,218 crore in Q1 FY26, with SBI leading this historic performance, reflecting the banking sector's robust health and SBI's dominant market position. Market cap stands at ₹7,95,909 crore (up 9.17% in 1 year) with stable fundamentals supporting long-term growth.
SBI's loan portfolio grew 11.61% YoY to ₹42.5 lakh crore, with retail and SME segments outperforming, demonstrating strong credit demand across sectors. The bank's diversified loan book provides stability while capturing high-growth opportunities in priority sector lending.
SBI reported net profit of ₹212.01 billion for Q1 FY26, up 9.7% YoY, maintaining its position as India's largest lender. This consistent profitability growth validates the bank's strategic focus on operational efficiency and risk management excellence.
With resilient economic activity, credit demand remained strong with advances growing 15.24% to ₹37.68 lakh crore in FY2024, positioning SBI to capitalize on India's economic expansion and infrastructure development boom.
Public sector banks show stable credit growth of 12.2% in FY25, with SBI leading the charge in capturing market share through competitive pricing and superior customer service. Operating expenses were well-managed through improved operating leverage and digital transformation initiatives.
The banking sector benefits from strong economic growth, rising disposable incomes, increasing consumerism and digital adoption driving transformation in 2025. SBI's report anticipates loan to GDP ratio increasing from 1.2 in FY23 to 1.7 in FY24, guaranteeing prolonged GDP expansion.
Cost management excellence reflected in controlled expense growth while revenue maintained steady levels, showcasing operational leverage benefits. Strong asset quality metrics and improved NIMs position SBI for sustained profitability growth in the evolving banking landscape.
✅ Conclusion
State Bank of India's outstanding 10.1% YoY PAT growth and successful breakout above ₹840 resistance creates compelling technical and fundamental convergence. The bank's market leadership position, record Q1 profitability contributing 43% of total PSB earnings, and strong sectoral tailwinds from India's economic growth provide robust backing for sustained rally. Critical support at ₹840 breakout level must sustain for continued bullish momentum toward the ₹920 target zone. As India's largest and most profitable bank, SBI remains well-positioned to capitalize on the credit growth cycle and digital banking revolution.

Polycab India: Strong Q1 Powers Return to Supply Zone🔍 Technical Analysis
Polycab India has demonstrated exceptional technical progression showcasing a remarkable super bullish rally over the past few years. Before COVID, the stock was trading at ₹1,200 levels, but the pandemic-induced correction brought it down to ₹600 - representing a significant 50% decline from pre-COVID highs.
However, the post-COVID recovery proved extraordinary as the stock embarked on a phenomenal journey, surging from ₹600 lows directly to ₹7,300 by June 2024 - representing an incredible 12x growth in just over 4 years. This massive rally established Polycab as one of the top performing stocks in the electrical equipment sector.
The ₹7,300-7,600 zone has acted as formidable resistance multiple times, creating a critical supply area that has tested the stock's momentum repeatedly. When this resistance proved too strong, the stock underwent a sharp correction down to ₹4,500 levels by February 2025, representing a significant 38% decline from the highs.
The game-changing catalyst arrived with strong Q4 FY25 results followed by impressive Q1 FY26 performance, showcasing record revenue growth and robust profitability. These stellar quarterly numbers provided the momentum needed to stage a remarkable recovery back toward the supply zone.
Currently trading at ₹7,549, the stock has successfully returned to the critical 7,300-7,600 supply zone. If this resistance transforms into robust support with bullish candlestick pattern confirmation and volume backing, the technical setup appears highly favorable for the next leg of rally.
Entry Strategy: Monitor for breakout above ₹7,600 with strong volume confirmation, or enter on dips toward ₹7,300 if it holds as support.
🎯 Targets:
Target 1: ₹8,000
Target 2: ₹8,500
Target 3: ₹9,000
🚫 Stop Losses:
Critical Stop: ₹7,200 (below supply zone support)
If ₹7,300-7,600 supply zone doesn't act as support or shows rejection, caution advised on further expectations.
💰 Q1 FY26 Financial Highlights (vs Q4 FY25 & Q1 FY25)
Total Income: ₹5,906 Cr (↓ -15.5% QoQ from ₹6,986 Cr; ↑ +25.7% YoY from ₹4,698 Cr)
Total Expenses: ₹5,048 Cr (↓ -15.3% QoQ from ₹5,960 Cr; ↑ +22.7% YoY from ₹4,115 Cr)
Operating Profit: ₹858 Cr (↓ -16.3% QoQ from ₹1,025 Cr; ↑ +47.2% YoY from ₹583 Cr)
Profit Before Tax: ₹801 Cr (↓ -16.6% QoQ from ₹961 Cr; ↑ +50.3% YoY from ₹533 Cr)
Profit After Tax: ₹600 Cr (↓ -18.3% QoQ from ₹734 Cr; ↑ +49.3% YoY from ₹402 Cr)
Diluted EPS: ₹39.34 (↓ -18.6% QoQ from ₹48.31; ↑ +49.3% YoY from ₹26.34)
🧠 Fundamental Highlights
Polycab India delivered spectacular Q1 FY26 performance with PAT surging an exceptional 49.3% YoY to ₹600 crore, driven by strong performance in the Wires & Cables business which led to a robust 25.7% YoY revenue growth. The company's consolidated net profit spiked 49.32% with revenue rising 25.71% to ₹5,906 crore in Q1 FY26, with the Wires & Cables segment leading the growth momentum.
As India's largest manufacturer of wires and cables, Polycab dominates the market with 84% revenue contribution from the W&C segment in FY25, offering a diverse product portfolio including flexible wires, building wires, optical-fiber cables, and control cables. The company's integrated manufacturing approach provides significant competitive advantages in cost management and quality control.
Market cap stands at ₹1,12,867 crore (up 14.9% in 1 year) with stable promoter holding of 63.0%, indicating strong management confidence. The company achieved record-breaking revenues and profitability, surpassing ₹220 billion and ₹20 billion respectively, solidifying its position as both the largest and most profitable company in the electrical industry.
The wires & cables industry accounts for 40-45% of the electrical equipment industry with a market size of ~₹50,000 crores, demonstrating double-digit growth over the last decade driven by electrification and infrastructure development. This provides strong sectoral tailwinds for sustained growth.
Polycab plans to maintain capex levels between ₹10-11 billion annually over the next three years, positioning the company for sustained growth and market leadership. The Power Ministry's ₹2,440 billion plan to build over 50,000 km of transmission lines for renewable capacity evacuation provides massive growth opportunities.
Operating margin resilience demonstrated through 47.2% YoY operating profit growth despite seasonal revenue patterns, showcasing superior operational efficiency. The company's focus on infrastructure projects, real estate expansion, and export markets drives consistent revenue diversification.
India's electric wire and cable market is projected to grow by USD 2.14 billion (2024-2028), driven by infrastructure development, energy demands, and digitization, with Polycab well-positioned as a market leader. Strategic expansion in renewable energy transmission and distribution sectors aligns with India's green energy transition.
✅ Conclusion
Polycab India's outstanding 49.3% YoY PAT growth and 25.7% revenue surge in Q1 FY26 validates its return to the critical 7,300-7,600 supply zone, creating compelling technical and fundamental convergence. The company's market leadership position, record profitability, and strong sectoral tailwinds from India's infrastructure boom and renewable energy transition provide robust backing for sustained growth. Critical resistance at ₹7,600 breakout could unlock significant upside toward the ₹9,000 target zone. The stock's remarkable recovery from ₹4,500 lows to current levels demonstrates strong underlying business fundamentals supporting the technical rally.

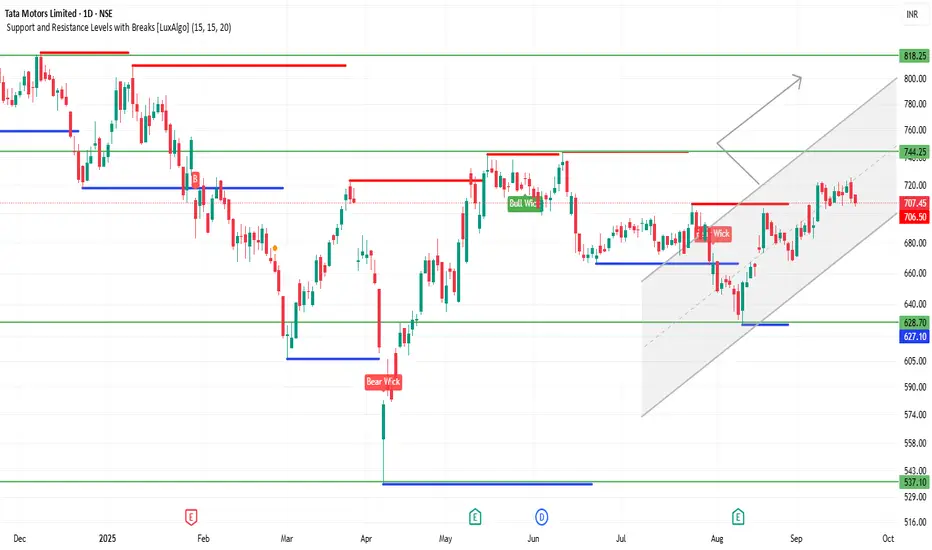
TATAMOTORS 1D Time frameCurrent Price: 707
Current Trend: Strong bullish momentum; stock is trading near recent highs.
Support Zone: Immediate support at 695 – 700. If this holds, uptrend remains intact.
Resistance Zone: Next resistance at 720 – 730. A breakout above this can push toward 750+.
Indicators: Daily candles are bullish, showing higher highs and strong buying interest.
Outlook:
Above 720 → continuation of bullish rally likely.
Below 695 → minor correction possible toward 680–685.
👉 In short (with 707 current price):
Bullish tone.
Range to watch: 695 – 730.
SENSEX 1D Time frameCurrent Trend: Still sideways to mildly bullish, but trading closer to support levels.
Support Zone: Now the strong support shifts to 82,300 – 82,500. If this zone holds, bounce is possible.
Resistance Zone: On the upside, watch 83,200 – 83,500 for resistance. Breakout above this can push price higher.
Indicators: Daily candle suggests consolidation; buyers defending 82,300 zone.
Outlook:
Above 83,500 → fresh bullish momentum likely.
Below 82,300 → weakness can extend further.
👉 In short (based on 82,626 level):
Range: 82,300 – 83,500.
Market neutral, waiting for breakout either side.

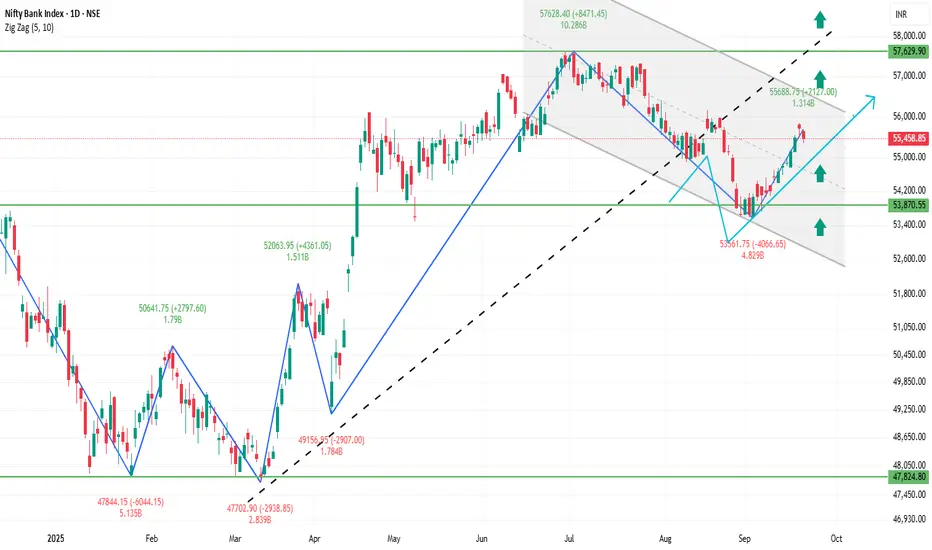
BANKNIFTY 1D Time frameCurrent Trend: BANKNIFTY is showing consolidation with mild bullish bias.
Support Zone: Strong support lies near 55,200 – 55,400. If this holds, buyers may remain active.
Resistance Zone: Key resistance is around 55,800 – 56,000. A breakout above this can bring strong momentum.
Indicators: Daily structure is stable; candles show demand near support zones.
Outlook:
Above 56,000 → fresh rally possible.
Below 55,200 → weakness can extend.
👉 In short:
Sideways to bullish.
Strength above 56,000, weakness below 55,200.
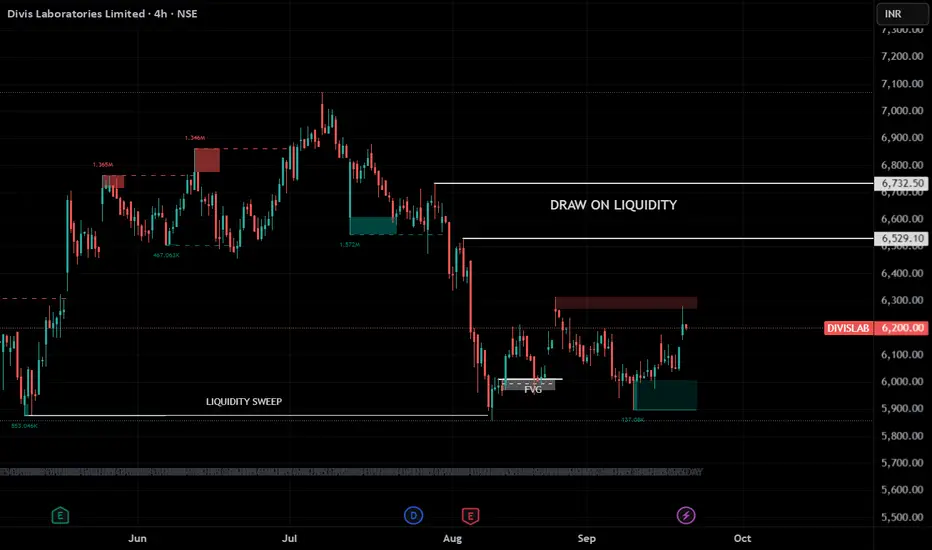
DIVIS LAB STOCK ANALYSISDIVIS LAB liq sweeped - 5878
still in demand zone .discount price so buy accumulate this stocks
1st target - 6528
2nd target - 6721
Intraday Scalping Tips: A Comprehensive Guide for Traders1. Understanding Intraday Scalping
Intraday scalping is a high-frequency trading strategy where traders aim to exploit minor price movements in highly liquid stocks, indices, or commodities. Scalpers typically hold positions for a few seconds to a few minutes, rarely longer than an hour, focusing on micro-trends.
Key Characteristics of Scalping:
Frequency: Multiple trades per day, often 20-50 or more.
Profit per trade: Small, usually 0.1% to 0.5% of the asset price.
Timeframe: Very short, typically 1-minute, 5-minute, or tick charts.
Tools: Technical indicators, Level 2 data, order books, and high-speed trading platforms.
Scalping is favored by traders who thrive on fast decision-making and have the discipline to follow strict risk management rules.
2. Choosing the Right Market and Instruments
Not all markets are suitable for scalping. The ideal instruments share characteristics like liquidity, volatility, and tight bid-ask spreads.
A. Liquidity
Highly liquid instruments allow traders to enter and exit positions quickly without significant slippage. Examples include:
Stocks: Large-cap equities such as Apple, Microsoft, or Reliance Industries.
Indices: Nifty 50, S&P 500, or Dow Jones futures.
Forex pairs: EUR/USD, GBP/USD, USD/JPY.
Commodities: Gold, crude oil futures.
B. Volatility
Scalpers thrive on small price fluctuations. Moderate volatility ensures there are enough trading opportunities without excessive risk. Instruments with too low volatility may not provide sufficient profit potential, while highly volatile ones can lead to rapid losses.
C. Spreads
Tighter bid-ask spreads reduce trading costs. Scalpers often trade instruments with minimal spreads to maximize net gains.
3. Technical Analysis for Scalping
Technical analysis is the backbone of scalping. Traders rely on charts, indicators, and patterns to make rapid decisions.
A. Timeframes
Scalpers primarily use:
1-Minute Charts: Ideal for ultra-short-term trades.
5-Minute Charts: Better for slightly larger moves and trend confirmation.
Tick Charts: Track each transaction for highly active markets.
B. Indicators
Common indicators for scalping include:
Moving Averages (MA):
Use short-term MAs (5, 10, 20 periods) to identify micro-trends.
Crossovers signal potential entry/exit points.
Relative Strength Index (RSI):
Helps spot overbought or oversold conditions.
RSI above 70 indicates overbought, below 30 indicates oversold.
Bollinger Bands:
Show volatility and potential reversal zones.
Price touching the upper or lower band may indicate a short-term reversal.
Volume Analysis:
Confirms the strength of price movements.
Increasing volume with price momentum strengthens trade signals.
C. Price Action Patterns
Scalpers also rely on candlestick patterns:
Pin Bars: Indicate quick reversals.
Doji: Signal market indecision.
Engulfing Patterns: Show strong directional shifts.
4. Scalping Strategies
A. Momentum Scalping
Momentum scalping involves entering trades in the direction of strong price movements. Traders look for:
Breakouts from consolidation zones.
High volume spikes confirming the trend.
Fast execution to ride the momentum.
Example: A stock breaking above a resistance level with heavy volume may provide a 1-2% intraday profit if timed correctly.
B. Range Trading
Some instruments trade within a defined price range during the day. Scalpers can:
Buy at support and sell at resistance.
Use tight stop-losses to minimize risk.
Confirm trades with oscillators like RSI or Stochastic.
C. News-Based Scalping
Economic reports, corporate announcements, or geopolitical news can trigger rapid price movements. Scalpers exploit this by:
Monitoring economic calendars.
Reacting quickly to breaking news.
Using platforms with low latency execution.
Caution: News-based scalping is high-risk due to unpredictable price swings.
D. Spread Scalping
This strategy is common in Forex or highly liquid markets:
Traders exploit tiny differences in bid-ask spreads.
Requires sophisticated software or a broker offering minimal latency.
5. Risk Management in Scalping
Effective risk management is non-negotiable in scalping. High trade frequency increases exposure, making small losses potentially catastrophic.
A. Position Sizing
Use small position sizes relative to your total capital.
Limit risk to 0.5%-1% per trade.
B. Stop-Loss and Take-Profit
Set tight stop-losses to avoid large losses.
Use risk-reward ratios around 1:1 or 1:1.5 due to the small profit target per trade.
C. Avoid Overtrading
Stick to your strategy, even if tempted to chase small gains.
Overtrading can erode profits and increase emotional stress.
D. Monitor Transaction Costs
Frequent trades mean higher brokerage and fees.
Opt for brokers with low commissions and tight spreads.
6. Common Mistakes to Avoid
Overleveraging: Increases risk of large losses.
Ignoring Transaction Costs: High fees can nullify gains.
Chasing the Market: Jumping into trades without setup leads to losses.
Neglecting Stop-Losses: Can transform small losses into significant drawdowns.
Emotional Trading: Fear and greed are the biggest enemies of scalpers.
Conclusion
Intraday scalping is a high-speed, high-discipline trading strategy that can yield consistent profits if executed correctly. The key to success lies in:
Choosing the right instruments.
Mastering technical analysis and chart patterns.
Implementing strict risk management.
Maintaining emotional control and mental focus.
Leveraging technology to improve speed and efficiency.
Scalping is not for everyone. It requires patience, precision, and resilience. However, for traders willing to invest time in learning and practicing, it can be a highly rewarding strategy in the world of financial markets.
NFLX STOCK ANALYSISnetflix stock = liquidity sweeped (grab)- 1183 $
two order blocks found - 1160$ , 1171$
MSS - 1171 $
equal highs - 1266 $ = target 1
2nd target found fvg and order block - 1319 $

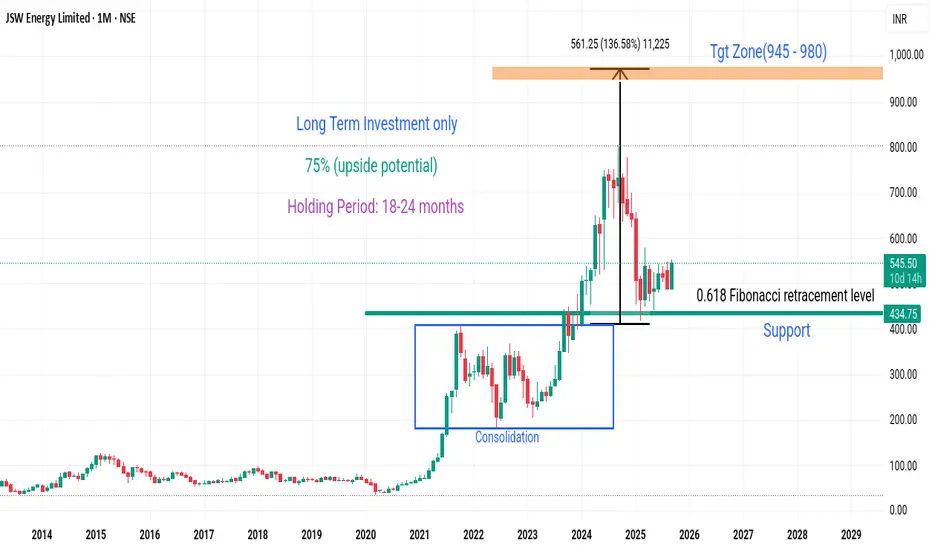
Short Term Sentiment Bullish; Hefty valuations raise concern
The company has a strong focus on transitioning to green energy, with a target of achieving 30 GW of generation capacity by FY 2030, with renewables constituting 70% of the portfolio.
Recent strategic acquisitions, such as the Tidong Power Generation(Rs. 1,728 Crore from Statkraft) and the boiler manufacturing unit of GE Power India, and a significant pipeline of new projects.
Revenue and profit grew by 78% and 42% respectively in Q1 FY26.
JSW Energy is on an expansion spree (added 1.9 GW of new capacity, bringing its total installed base to 12.8 GW, a 70% YoY increase).
The company aims to have a 30 GW generation capacity by FY 2030 and a 40 GWh energy storage capacity.
Has a Debt-to-equity ratio of 1.83 (net debt has also increased due to capital expenditures and acquisitions). However, management is focused on maintaining a strong credit rating.
POLYPLEX LongPOLYPLEX trading in a channel. Took support and moving towords the resistance.
THIS IS FOR EDUCATIONAL PURPOSE NOT AN RECOMMEDATION
