Manorama IndustriesDate 31.08.2025
Manorama Industries
Timeframe : Day Chart
About
Manorama Industries is a leading manufacturer of specialty fats and butters derived from Sal and Mango seeds
Leadership
(1) No. 1 Indian Exporter of Sal & Mango Based Speciality Fats & Butters
(2) No. 1 Sal Fat Manufacturer Globally
Products
Their product portfolio include Mango butter, Mango olein, Mango stearin, Sal butter, Sal olein, Sal stearin, Shea butter, Shea olein, Shea stearin, Cocoa Butter Equivalents, Cocoa Butter Improvers, Chocolates/Hazelnut Spread Fats, Cocoa Butter Optimiser
Geographical Split
(1) Domestic 27%
(2) International 73%
Manufacturing Facility
(1) The company has an integrated manufacturing plant at Birkoni, Chhattisgarh
Manufacturing Capacity
(1) Seed Milling – 90,000 MTPA
(2) Extraction Plant – 90,000 MTPA
(3) Refinery – 45,000 MTPA
(4) Interesterification – 30,000 MTPA
(5) Fractionation – 40,000 MTPA
(6) Blending Station & Packing – 30,000 MTPA
Key Supply Sources
(1) Sal Forest – India: Covers 14% of India’s forests, with major sourcing from Odisha, Bihar, Jharkhand, West Bengal, MP, and Chhattisgarh, accounting for 30% of India's Sal forest area.
(2) Shea Forest – Africa: West Africa has ~1 billion Shea trees, while Africa overall has 2+ billion, serving as a key sourcing region.
Customers
(1) Chocolate and Confectionery :
Ferrero Rocher, Mondelez, Barry Callebaut, Mitsui, Unigra, Walter Rau, and Adeka Corporation.
(2) Cosmetics:
The Body Shop, Lush, L’Oréal, ActivON, Naturasante LeafMotiv, Gustav Hess GMBH, Hallstar, Jedward International INC, and Kerfoot Group
Key Valuations
(1) OPM27%
(2) ROCE 23%
(3) ROE 28%
(4) Stock PE 54
(5) Sales Growth 93%
Regards,
Ankur
Fundamental Analysis

Part 2 Master Candlestick PatternKey Participants in the Options Market
The options market has a mix of participants:
Hedgers: Protect themselves from risks (institutions, exporters, investors).
Speculators: Try to profit from price moves (retail & professional traders).
Arbitrageurs: Exploit price inefficiencies between cash and derivatives.
Institutions & Banks: Use options for structured products and risk management.
How Options are Priced
Options are more complex than stocks because they have two value components:
Intrinsic Value = Difference between spot price and strike price (if profitable).
Time Value = Extra premium traders pay for the possibility of future moves.
The pricing is influenced by The Greeks:
Delta: Sensitivity of option price to underlying asset moves.
Theta: Time decay (options lose value as expiry nears).
Vega: Impact of volatility on option price.
Gamma: Rate of change of delta.
Understanding Greeks is essential for advanced option strategies.

How I Analyze Any IPO in 5 Minutes (Simple Checklist)Hello Traders!
IPOs always create excitement. Retail investors often rush in because of hype, but smart traders know how to quickly separate strong opportunities from risky bets.
You don’t need hours of research, a simple checklist can give you clarity in just 5 minutes.
Here’s the process I follow before looking at any IPO.
1. Understand the Business Model
Before anything else, ask: What does the company actually do? Is it solving a real problem, or just another crowded business?
If you cannot explain the business in one simple line, it’s better to avoid.
2. Revenue and Profit Trend
Check the last 3 years’ financials. Are sales and profits consistently growing, or is the IPO just timed after one good year?
A company with unstable profits may not sustain growth once the IPO buzz fades.
3. Promoter and Management Quality
Look at promoter background, experience, and any red flags. Are they increasing their stake or selling heavily in the IPO?
If promoters themselves are exiting big, you need to be cautious.
4. Debt Levels and Cash Flow
High debt or weak cash flow is a danger sign. IPO money should ideally be used for growth, not just to repay loans.
Companies with positive cash flow and low debt are much safer bets.
5. Valuation vs Peers
Even a good company can be a bad investment if the price is too high. Compare P/E and other valuation ratios with similar listed companies in the sector.
If it looks overpriced, it may be better to wait and buy later.
Rahul’s Tip:
Don’t get trapped in IPO hype. Most strong companies will give you chances to buy even after listing. Focus on fundamentals, not emotions.
Conclusion:
Analyzing an IPO doesn’t need to be complicated.
With this 5-minute checklist, business model, growth, promoters, debt, and valuation — you’ll quickly know if the IPO is worth your time or better avoided.
If this helped you, like the post, share your IPO checklist in the comments, and follow for more simple investing insights!
“Multi-Year Rally in the Making – Route Mobile”My Technical View:
---Double-bottom pattern identified – strong reversal signal.
---Long-term trendline breakout in progress, setting the stage for a huge upside rally.
Upside Targets:
🎯 Target 1: +30% Upside
🎯 Target 2: +66% Upside
🎯 Target 3: 100%+ Upside
Key Growth Catalysts:
1) Global Expansion – Integration with CPaaS major Kaleyra, giving presence in 100+ countries and Tier-1 clients.
2) Strong Backing – Supported by Proximus Group (Belgium), enhancing credibility & global scale.
3) Tech Edge – Partnership with Nokia for secure, carrier-grade CPaaS solutions worldwide.
New Business Wins (Driving Revenue & Margins):
1) IRCTC – Enterprise communication.
2) L&T Metro – Smart ticketing.
3) Nagpur / Hyderabad / Pune Metros – Digital ticketing solutions.
4) Google RCS – Advanced messaging platform.

Types of Financial InstrumentsIntroduction
Financial instruments are the lifeblood of the global financial system. They represent monetary contracts between parties and are used for various purposes such as raising capital, investing, trading, risk management, and hedging. Whether it’s a simple bank deposit, a government bond, or a complex derivative like a swap, financial instruments act as the medium through which money flows in the economy.
Broadly speaking, financial instruments can be classified into two major categories: cash instruments (whose value is directly determined by markets) and derivative instruments (whose value is derived from underlying assets such as stocks, commodities, or currencies). Within these categories exist several subtypes, ranging from equity shares and bonds to futures, options, and structured products.
In this article, we will examine financial instruments in detail, covering their types, features, roles, and global significance.
1. Meaning and Characteristics of Financial Instruments
A financial instrument can be defined as:
“A tradable asset, security, or contract that represents a legal agreement involving monetary value.”
Key characteristics include:
Monetary Value – Each instrument carries a certain value in terms of money.
Transferability – Most financial instruments can be traded between parties.
Liquidity – They vary in liquidity; shares of large companies are highly liquid, while structured products may be less so.
Risk and Return – They balance between safety and profitability.
Maturity – Some instruments (like equity shares) have no maturity, while others (like bonds) mature after a specific period.
2. Classification of Financial Instruments
Financial instruments can be classified into multiple categories depending on their structure and usage:
A. Based on Nature of Contract
Cash Instruments
Directly influenced by market conditions.
Examples: Deposits, loans, equity shares, bonds.
Derivative Instruments
Value derived from underlying assets.
Examples: Futures, options, forwards, swaps.
B. Based on Ownership
Equity-based Instruments – Ownership in a company (shares).
Debt-based Instruments – Borrowed funds to be repaid (bonds, debentures).
C. Based on Market
Primary Instruments – Issued directly by companies or governments to raise funds.
Secondary Instruments – Traded between investors on exchanges.
3. Cash Instruments
Cash instruments are the simplest and most common. They are valued directly by supply and demand in financial markets.
3.1 Equity Instruments (Shares)
Represent ownership in a company.
Two main types:
Common/Equity Shares: Provide ownership rights, voting power, and dividends.
Preference Shares: Fixed dividends, priority over common shareholders during liquidation, but usually no voting rights.
Importance:
Provide capital to businesses.
Allow investors to share profits and growth of companies.
3.2 Debt Instruments (Bonds & Debentures)
Debt instruments represent a loan given by the investor to an issuer (corporation or government).
Government Bonds – Considered risk-free, issued by sovereign entities.
Corporate Bonds – Issued by companies, carry credit risk.
Municipal Bonds – Issued by local governments.
Debentures – Unsecured bonds relying on issuer’s creditworthiness.
Key Features:
Fixed interest (coupon).
Redemption at maturity.
Credit rating plays a crucial role in pricing.
3.3 Money Market Instruments
Short-term financial instruments with high liquidity and low risk.
Examples:
Treasury Bills (T-Bills).
Commercial Papers (CPs).
Certificates of Deposit (CDs).
Repurchase Agreements (Repos).
3.4 Loans and Deposits
Bank Loans: Credit extended by banks with fixed repayment terms.
Fixed Deposits (FDs): Deposits made with banks for fixed tenure at agreed interest.
4. Derivative Instruments
Derivatives derive their value from an underlying asset such as stocks, indices, commodities, currencies, or interest rates. They are widely used for hedging, speculation, and arbitrage.
4.1 Forwards
Customized agreements between two parties to buy/sell an asset at a predetermined future date and price.
Traded over-the-counter (OTC).
High counterparty risk.
4.2 Futures
Standardized contracts traded on exchanges.
Obligates buyer/seller to transact underlying asset on a future date at a fixed price.
Common in commodities, currencies, and stock indices.
4.3 Options
Provide the right, but not obligation, to buy/sell an asset at a predetermined price.
Call Option: Right to buy.
Put Option: Right to sell.
Used for hedging and speculative trading.
4.4 Swaps
Contracts to exchange cash flows between two parties.
Types include:
Interest Rate Swaps – Fixed vs floating rate exchange.
Currency Swaps – Exchange of principal and interest in different currencies.
Commodity Swaps – Based on commodity price fluctuations.
5. Hybrid Instruments
These combine characteristics of debt and equity.
5.1 Convertible Bonds
Start as debt but can be converted into equity shares at later stages.
Attractive to investors seeking both safety and growth.
5.2 Preference Shares (with Debt Features)
Hybrid nature: act like equity but provide fixed returns like debt.
5.3 Warrants
Provide the right to buy company shares at a fixed price in future.
Often issued along with bonds to make them attractive.
6. Based on Risk and Return
Financial instruments also differ in terms of risk profile:
Low-risk instruments – Treasury bills, government bonds.
Moderate-risk instruments – Corporate bonds, preference shares.
High-risk instruments – Equity shares, derivatives, cryptocurrencies.
7. Structured and Alternative Financial Instruments
With globalization and financial innovation, new categories of instruments have emerged:
7.1 Structured Products
Custom-designed financial products combining derivatives with bonds or equities.
Example: Capital-protected notes.
7.2 Securitized Instruments
Pooling financial assets and selling them as securities.
Examples: Mortgage-backed securities (MBS), Asset-backed securities (ABS).
7.3 Alternative Assets
Hedge funds, private equity, venture capital.
Cryptocurrencies and digital tokens also fall under this category.
8. International Financial Instruments
Financial instruments also differ based on geography and cross-border usage:
Eurobonds – Bonds issued in currency different from the issuer’s home country.
Global Depository Receipts (GDRs) & American Depository Receipts (ADRs) – Allow companies to raise funds abroad.
Foreign Exchange Instruments – Spot, forwards, and swaps in currency markets.
9. Role of Financial Instruments in the Economy
Capital Formation – Companies raise funds through shares and bonds.
Liquidity Creation – Instruments can be traded in secondary markets.
Risk Management – Derivatives allow hedging against price fluctuations.
Efficient Resource Allocation – Savings flow into productive investments.
Global Integration – International instruments connect economies.
10. Regulatory Framework for Financial Instruments
Since financial instruments impact millions of investors, they are regulated by authorities:
India: SEBI (Securities and Exchange Board of India).
USA: SEC (Securities and Exchange Commission).
Global: IOSCO (International Organization of Securities Commissions).
Regulations cover disclosure norms, investor protection, insider trading, and systemic risk management.
11. Risks Associated with Financial Instruments
Market Risk – Fluctuations in prices.
Credit Risk – Default by borrower.
Liquidity Risk – Inability to sell asset quickly.
Operational Risk – Failures in systems or processes.
Regulatory Risk – Sudden changes in laws or policies.
12. Future of Financial Instruments
The landscape is evolving rapidly:
Digital Assets & Cryptocurrencies – Bitcoin, Ethereum, and tokenized securities.
Green Bonds & ESG-linked Instruments – Promoting sustainable finance.
Blockchain-based Smart Contracts – Transparent, decentralized trading.
Artificial Intelligence in Trading – Algorithm-driven financial products.
Conclusion
Financial instruments are at the core of global finance, enabling businesses, governments, and individuals to mobilize capital, invest, manage risks, and generate returns. From traditional cash instruments like bonds and shares to complex derivatives and innovative products like cryptocurrencies, they represent the dynamic evolution of money and markets.
Understanding the types, features, risks, and applications of these instruments is essential for investors, traders, policymakers, and anyone involved in the financial ecosystem. As global markets evolve, financial instruments will continue to adapt, reflecting technological progress and the changing needs of economies.
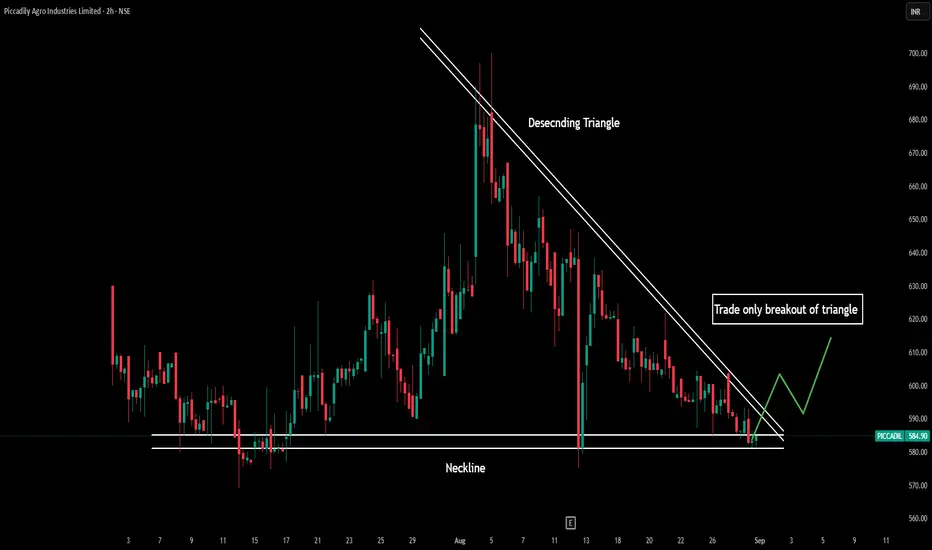
Piccadily Agro Industries LtdDate 30.08.2025
Piccadily Agro Industries
Timeframe : 2 Hrs Chart
Business Segments
(1) Distillery 75%
(2) Sugar 25%
Brand Leadership
(1) Indri is the top-selling Indian Single Malt Brand in India & globally
(2) With a 30%+ market share in single malt whisky in India f
Operational Metrics
(1) Sugarcane Crushed : 56 LQ
(2) Recovery : 9.75%
(3) Sugar Produced : 5.48 LQ
(4) Country Liquor Production : 61.7 LC
(5) Alcoholic Beverage Production : 1.68 LC
(6) Ethanol Production : 32.3 LL
Note
(1) LQ - Lakh Quintals
(2) LC - Lakh Cases
(3) LL - Lakh Liters
Revenue Mix / Product-Wise
(1) Sugar: 33%
(2) Alco-Bev Brands: 33%
(3) Country Liquor: 24%
(4) ENA/ Ethanol: 5%
(5) B2B Malts: 5%
Geography-Wise
(1) Domestic: 95%
(2) Exports: 5%
Manufacturing Facility
(1) Sugar Plant: 5,000 TCD
(2) Ethanol/ ENA Plant: 78 KLPD
(3) Malt Plant: 12 KLPD
Note
(1) KLPD - Kilo Liter Per Day
(2) TCD - Tonnes Cane Crushed Per Day
Valuations
(1) Market Cap ₹ 5,537 Cr.
(2) Stock P/E 51
(3) ROCE 23%
(4) ROE 20%
(5) OPM 23%
(6) Sales Growth 10.50%
(7) Profit Growth 21.43%
(7) Promoter 71%
Regards,
Ankur
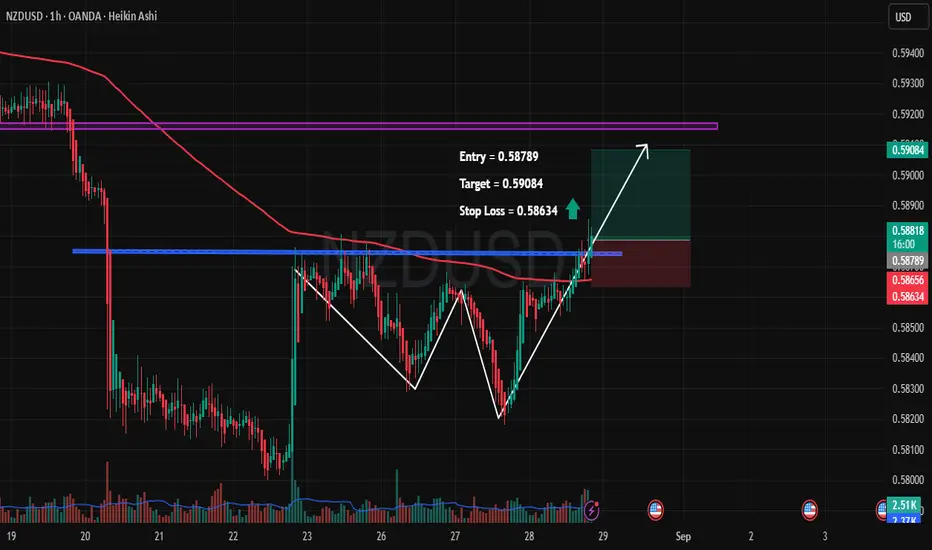
NZDUSD – Breakout Confirmation with Upside Potential🔹 Pair: NZDUSD (1H, Heikin Ashi)
🔹 Entry: 0.58789
🔹 Target: 0.59084 🎯
🔹 Stop Loss: 0.58634 🛑
🔑 Trade Rationale:
✅ Double Bottom Formation – Price respected key support twice, signaling potential reversal.
✅ Breakout Above Resistance – Clean breakout above horizontal resistance (blue line).
✅ 200 EMA Retest – Price is now pushing above the EMA, adding strength to the bullish case.
✅ Volume Spike – Recent surge in buying volume supports the upside move.
📊 Trade Plan:
I’m going long from 0.58789, looking for a quick move toward 0.59084. Risk is limited with a tight SL at 0.58634.
This setup offers a favorable R:R with a technical confluence of breakout + pattern confirmation.
⚠️ Disclaimer: This is not financial advice. Trade at your own risk. Always use proper risk management.
Part 3 Trading Master ClassIntroduction
Options trading is one of the most fascinating and versatile aspects of the financial markets. Unlike stocks, which give ownership in a company, or bonds, which provide fixed income, options are derivative instruments whose value is derived from an underlying asset such as stocks, indices, commodities, or currencies. They give traders the right, but not the obligation, to buy or sell the underlying asset at a predetermined price before a specific expiration date.
Because of this unique characteristic, options allow traders and investors to design strategies that suit a wide range of market conditions—whether bullish, bearish, or neutral. Through careful strategy selection, one can aim for limited risk with unlimited upside, hedge existing positions, or even profit from sideways markets where prices don’t move much.
This article explores options trading strategies in detail. We’ll cover the building blocks of options, common strategies, advanced combinations, and risk management. By the end, you’ll have a strong foundation to understand how professional traders use options to manage portfolios and generate returns.
Risk Management in Options Trading
Options carry significant risks if misused. Successful traders emphasize:
Position Sizing: Never risk too much on one trade.
Diversification: Spread across multiple strategies/assets.
Stop-Loss & Adjustments: Exit losing trades early.
Implied Volatility (IV) Awareness: High IV increases premiums; selling strategies may be better.

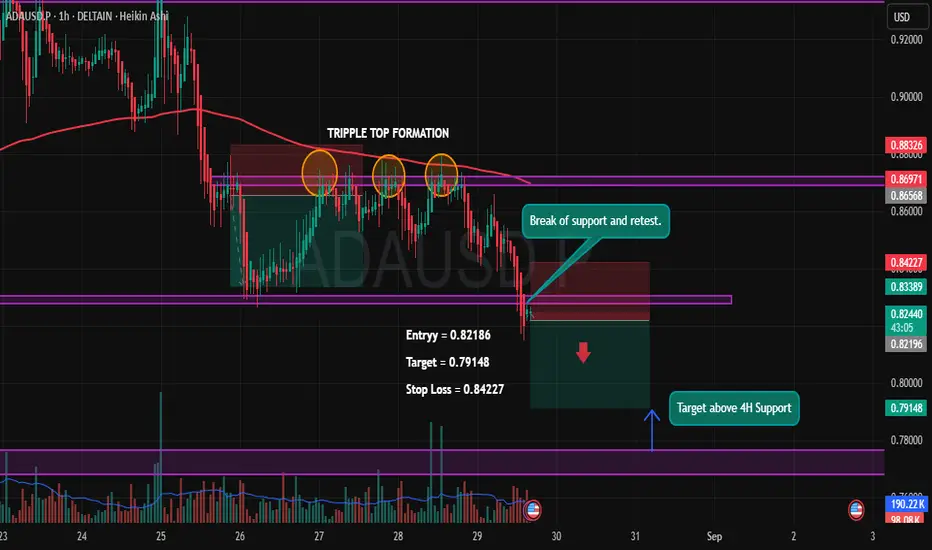
ADA/USDT – Triple Top Breakdown Play🔎 Setup Insight:
ADA has formed a Triple Top pattern near the 0.869 zone, confirming strong rejection from resistance. After multiple failed attempts to break higher, price finally broke down key support and is now retesting it, giving a clean short opportunity.
✨ Trade Plan:
Entry: 0.82186
Target: 0.79148 (Above 4H support zone)
Stop Loss: 0.84227
✅ Reasons for Short Bias:
Triple Top Formation ➝ Strong bearish reversal signal.
Break & Retest of Support ➝ Previous demand now acting as supply.
Confluence with 200 EMA rejection ➝ Trend remains bearish.
Volume Confirmation ➝ Selling volume stronger than buying.
🎯 Targeting the next major support on the 4H timeframe, with a favorable Risk-Reward setup.
⚠️ Disclaimer: This analysis is for educational purposes only and not financial advice. Always manage your risk before entering any trade.
ABDL Price ActionAs of August 29, 2025, Allied Blenders & Distillers Limited (ABDL) is trading around ₹501, showing short-term volatility with some decline from its recent high near ₹540. The stock has delivered impressive returns over the last twelve months, nearly doubling from its 52-week low of ₹279, and rising about 56% over six months and 28% in the last three months. The price-to-earnings ratio stands elevated at 59.4, and the price-to-book ratio is above 9, indicating that growth expectations are currently priced in.
Financially, ABDL maintains a market capitalization of over ₹14,200 crore, reflecting strong investor interest. The company’s quarterly earnings have been stable, but a relatively modest earnings per share means any further rally may require stronger profit growth. Technical indicators suggest the stock is trading in a neutral to slightly oversold territory, with momentum fluctuating but long-term moving averages still supporting the uptrend. Dividend yield is low, showing focus on growth over payouts. The outlook remains cautiously optimistic, with growth-oriented investors watching profitability closely for the next leg up.

Futures & Options (F&O) TradingIntroduction
Futures and Options (commonly known as F&O) are among the most exciting segments of financial markets. They fall under the category of derivatives trading, meaning their value is derived from an underlying asset such as stocks, commodities, currencies, or indices.
Unlike simple buying and selling of shares, F&O trading allows investors to hedge risks, speculate on price movements, and even leverage small capital into big trades. However, it also carries high risk and requires deep understanding.
This guide will cover:
What F&O trading is
How futures work
How options work
Key terms
Strategies used
Advantages & risks
Practical examples
Psychology of F&O trading
Regulations in India
Final thoughts for beginners
By the end, you’ll have a solid foundation in F&O trading.
Part 1: Understanding Derivatives
What are Derivatives?
A derivative is a financial contract whose value depends on the price of an underlying asset. For example, if you buy a derivative linked to Reliance Industries stock, its value will move as Reliance’s stock price moves.
Derivatives can be of many types:
Futures
Options
Forwards
Swaps
In India, the most popular are Futures and Options (F&O).
Part 2: Futures Trading
What are Futures?
A futures contract is an agreement between two parties to buy or sell an asset at a predetermined price on a future date.
Buyer of futures: Agrees to buy the asset in future.
Seller of futures: Agrees to sell the asset in future.
Both are obligated to honor the contract on expiry.
Key Features of Futures:
Standardized contracts – traded on exchanges (like NSE, BSE).
Leverage – You pay only a margin (a fraction of total value).
Settlement – Can be cash-settled or delivery-based.
Expiry dates – Futures have fixed expiry (weekly, monthly, quarterly).
Example of Futures:
Suppose Reliance stock is trading at ₹2,500.
You buy a Reliance Futures contract (lot size 250 shares).
Contract value = ₹2,500 × 250 = ₹6,25,000.
But you don’t pay full amount, only margin (say 15% = ₹93,750).
If Reliance rises to ₹2,600, your profit = (100 × 250) = ₹25,000.
If Reliance falls to ₹2,400, your loss = ₹25,000.
So, futures magnify both profit and loss.
Part 3: Options Trading
What are Options?
Options are more flexible than futures. An option gives the buyer the right, but not the obligation, to buy or sell the underlying asset at a fixed price on or before expiry.
There are two types of options:
Call Option (CE): Right to buy.
Put Option (PE): Right to sell.
Key Terms in Options:
Strike Price: Pre-decided price at which option can be exercised.
Premium: Price paid by buyer to seller of option.
Option Buyer: Has rights, limited risk (loss = premium).
Option Seller (Writer): Has obligation, unlimited risk but limited profit (premium received).
Example of Call Option:
Reliance at ₹2,500.
You buy a Call Option (CE) 2600 strike, expiring in 1 month, paying ₹20 premium.
Lot size = 250. Total premium paid = ₹5,000.
If Reliance goes to ₹2,700 before expiry:
Option value = ₹100 (intrinsic value).
Profit = (100 - 20) × 250 = ₹20,000.
If Reliance stays below ₹2,600, option expires worthless.
Loss = only premium paid (₹5,000).
So, options limit risk for buyers but sellers face higher risk.
Part 4: Comparison – Futures vs Options
Feature Futures Options
Obligation Buyer & seller both obligated Buyer has right, seller has obligation
Risk High (both sides) Limited for buyer, unlimited for seller
Cost Margin required Premium required
Profit Potential Unlimited both ways Unlimited for buyer, limited for seller
Best for Speculation & hedging Hedging, speculation, income strategies
Part 5: Why Trade F&O?
1. Hedging
Investors use F&O to protect portfolios from adverse price movements.
Example: An investor holding Reliance shares can buy a Put Option to protect against downside.
2. Speculation
Traders use leverage to bet on market movements.
3. Arbitrage
Taking advantage of price differences between cash market and F&O.
4. Income Generation
Selling (writing) options to earn premium.
Part 6: Important Concepts in F&O
Leverage & Margin – You control large value with small capital.
Mark-to-Market (MTM) – Futures contracts are settled daily.
Time Decay (Theta) – Options lose value as expiry nears.
Implied Volatility (IV) – Measures expected price swings.
Greeks in Options – Delta, Gamma, Vega, Theta, Rho – help manage risk.
Part 7: Common F&O Strategies
Futures Strategies:
Long Futures – Buy if you expect rise.
Short Futures – Sell if you expect fall.
Options Strategies:
Covered Call – Hold stock + sell call.
Protective Put – Hold stock + buy put (insurance).
Straddle – Buy call + buy put (expect big move).
Strangle – Buy out-of-money call & put.
Iron Condor – Combination to earn premium in sideways market.
Part 8: Risks in F&O Trading
High Leverage Risk – Small moves can wipe out capital.
Time Decay in Options – Value erodes with time.
Volatility Risk – Sudden moves may cause losses.
Liquidity Risk – Some contracts have low trading volume.
Psychological Pressure – High stress and emotions.
Part 9: F&O in India
Introduced in 2000 (NSE).
Most popular: Index Futures & Options (Nifty, Bank Nifty).
Also available: Stock futures, stock options, currency derivatives, commodity derivatives.
Regulated by SEBI (Securities and Exchange Board of India).
Lot Sizes in India
Each F&O contract has a fixed lot size decided by SEBI (e.g., Nifty lot = 50 units).
Expiry Cycle
Index Options: Weekly & monthly expiry.
Stock Options: Monthly expiry.
Part 10: Psychology of F&O Trading
Success in F&O is not just about knowledge, but also about mindset:
Discipline – Stick to stop-loss and plan.
Patience – Wait for right setup.
Emotional Control – Don’t let greed/fear drive decisions.
Risk Management – Never risk more than 1–2% of capital in one trade.
Conclusion
Futures & Options (F&O) trading is a double-edged sword. It offers leverage, hedging, and high profit potential, but also comes with complexity and high risk.
For beginners:
Start with options buying (limited risk).
Learn basic strategies like covered call, protective put.
Always use stop-loss.
Treat F&O as a tool for hedging first, speculation second.
With proper knowledge, discipline, and risk management, F&O can become a powerful addition to an investor’s toolkit.
Trading Psychology & DisciplineIntroduction
In the world of financial markets, traders often focus on technical analysis, fundamental research, algorithms, and news-driven events to make decisions. While these tools are essential, there is one element that is frequently underestimated yet plays a much bigger role in success: trading psychology and discipline.
Trading is not just about numbers, charts, or strategies—it is a game of emotions, mindset, and self-control. Even the most sophisticated strategies fail if the trader cannot control fear, greed, and impulsive behavior. On the other hand, an average trading system can become profitable in the hands of a disciplined and emotionally balanced trader.
This discussion will explore the psychological aspects of trading, the emotional challenges, common behavioral biases, and how discipline can transform a trader’s performance. We’ll also look at techniques and practices to build a resilient trading mindset.
1. The Role of Psychology in Trading
Trading psychology refers to the emotions and mental state that influence how traders make decisions in the market. Unlike professions where skills and experience directly translate into results, trading is unique because psychological factors often override logic.
For example:
A trader may have a solid strategy to exit a position at a 10% profit. But when the time comes, greed makes them hold longer, hoping for more, and the market reverses.
Another trader may see a perfect setup but doesn’t enter the trade because of fear after a previous loss.
This illustrates that psychology can either support or sabotage trading success. Research shows that 80–90% of retail traders lose money consistently—not always because of poor strategies, but due to a lack of discipline and emotional control.
2. Key Emotional Challenges in Trading
Let’s examine the major psychological challenges that traders face.
a) Fear
Fear is the most dominant emotion in trading. It manifests in different ways:
Fear of losing money (not taking a trade).
Fear of missing out (FOMO—jumping into a trade too late).
Fear of being wrong (holding on to losing positions).
Fear often leads to hesitation, early exits, or missed opportunities.
b) Greed
Greed drives traders to:
Overstay in profitable trades.
Over-leverage positions.
Overtrade (taking too many trades in a day).
While the market rewards patience, greed often blinds judgment.
c) Hope
Many traders fall into the trap of hope, especially with losing trades. Instead of cutting losses, they keep hoping the market will reverse in their favor. Hope replaces rational decision-making.
d) Revenge Trading
After a loss, traders sometimes feel the need to recover money immediately. This leads to impulsive trades without proper setups—often resulting in bigger losses.
e) Overconfidence
Success can be as dangerous as failure. After a winning streak, traders may become overconfident, take unnecessary risks, or abandon risk management—leading to devastating drawdowns.
3. Behavioral Biases in Trading
Trading psychology overlaps with behavioral finance, where human biases cloud rational thinking. Some common biases include:
Loss Aversion Bias – The pain of loss is psychologically stronger than the pleasure of gain. Traders avoid booking small losses, leading to bigger ones.
Confirmation Bias – Traders look only for information that supports their trade idea, ignoring opposing signals.
Anchoring Bias – Traders anchor to a certain price level (like the price they bought at) and refuse to sell below it.
Herd Mentality – Following the crowd without analysis, often during market bubbles.
Recency Bias – Giving more weight to recent outcomes rather than long-term performance.
These biases affect judgment and lead to poor decision-making.
4. The Importance of Discipline in Trading
If psychology is the foundation, discipline is the structure that holds a trader’s career together. Discipline in trading means sticking to rules, risk management, and strategies regardless of emotions.
A disciplined trader:
Enters trades only when rules align.
Exits trades at predefined stop-loss or target levels.
Maintains position sizing regardless of emotions.
Accepts losses as part of the business.
Avoids impulsive and revenge trading.
Discipline converts trading from gambling into a professional business.
5. The Mindset of a Successful Trader
Professional traders think differently from amateurs. They focus on process over outcome. Their mindset includes:
Probability Thinking
No trade is guaranteed. Each trade is just one outcome in a series of probabilities. Accepting this reduces emotional pressure.
Detachment from Money
Professionals see money as a tool, not an emotional anchor. They measure success in terms of following their plan, not short-term profits.
Adaptability
Markets change constantly. Disciplined traders adapt rather than stubbornly sticking to failing strategies.
Patience
They wait for high-probability setups rather than forcing trades.
Long-term Focus
Success is measured in months and years, not a single trade.
6. Building Trading Discipline
Discipline is not automatic—it requires conscious practice. Here’s how traders can develop it:
a) Create a Trading Plan
A trading plan defines:
Entry and exit rules.
Position sizing.
Risk-reward ratios.
Markets and timeframes to trade.
Maximum daily/weekly losses.
Without a plan, emotions take over.
b) Use Risk Management
Risk per trade should never exceed 1–2% of capital. Stop-loss orders should be predefined. This ensures survival even during losing streaks.
c) Keep a Trading Journal
A journal helps track:
Why you entered a trade.
Emotions felt during the trade.
What went right/wrong.
Over time, patterns emerge, revealing weaknesses in psychology and strategy.
d) Practice Mindfulness
Mindfulness techniques such as meditation, deep breathing, or visualization help traders stay calm during stressful market conditions.
e) Accept Losses as Normal
Even the best traders lose frequently. What matters is keeping losses small and letting winners run. Accepting losses removes emotional baggage.
f) Avoid Overtrading
Set daily/weekly limits on trades. This prevents emotional exhaustion and impulsive decisions.
7. Practical Techniques to Improve Trading Psychology
Here are actionable steps:
Pre-Market Routine – Spend 10–15 minutes visualizing scenarios, checking news, and calming the mind.
Set Daily Goals – Focus on execution (e.g., “Follow my plan”) rather than monetary goals.
Take Breaks – Step away after a loss or win streak to reset emotionally.
Limit Screen Time – Over-monitoring leads to anxiety. Check setups at predefined times.
Simulation/Backtesting – Helps build confidence in a system before using real money.
Accountability Partner – Sharing trades with another trader builds discipline.
8. Case Studies: Trading Psychology in Action
Case 1: The Fearful Trader
A new trader avoids trades after a big loss. Despite seeing good setups, fear paralyzes action. Over time, opportunities are missed, and frustration builds.
Lesson: Risk management and small position sizing reduce fear.
Case 2: The Greedy Trader
Another trader doubles account quickly during a bull run, but refuses to book profits. Overconfidence leads to leverage, and one market crash wipes out everything.
Lesson: Discipline and humility are essential.
Case 3: The Disciplined Trader
A professional trader takes 40% win rate trades but manages risk with 1:3 reward ratios. Despite losing more trades than winning, account grows steadily.
Lesson: Discipline beats emotions.
9. The Role of Technology and Psychology
Modern trading platforms provide tools like:
Automated trading systems – Reduce emotional interference.
Alerts and stop-loss automation – Enforce discipline.
Analytics dashboards – Help track performance.
But even with technology, psychology remains the deciding factor, since traders often override systems when emotions take over.
10. Long-Term Development of Trading Mindset
Trading psychology is not built overnight. It requires years of consistent practice. Key long-term practices include:
Reading trading psychology books (e.g., Trading in the Zone by Mark Douglas).
Engaging in regular self-reflection.
Accepting that markets are uncertain.
Developing resilience to handle both drawdowns and success.
The goal is to become a trader who is calm in chaos, rational under stress, and disciplined under temptation.
Conclusion
Trading psychology and discipline are the invisible forces behind every successful trader. Strategies and indicators provide the “how,” but psychology answers the “why” and “when.”
Fear, greed, and biases sabotage results.
Discipline enforces consistency and professionalism.
A strong trading mindset focuses on probabilities, risk management, and patience.
Ultimately, trading is not a battle with the market—it is a battle with oneself. Mastering psychology and discipline transforms trading from an emotional rollercoaster into a structured, profitable business.
As the saying goes:
“In trading, your mind is your greatest asset—or your biggest enemy. The choice is yours.”

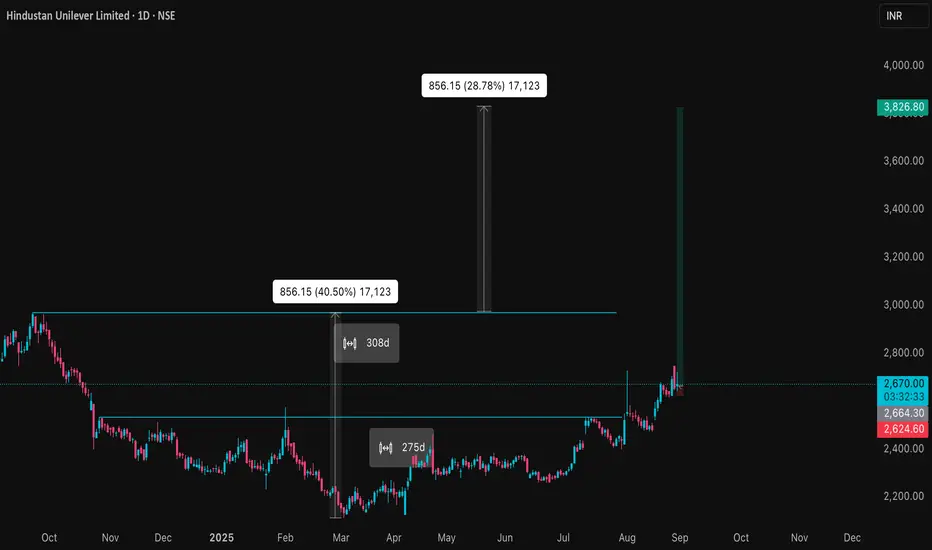
HINDUNILVR Price ActionHindustan Unilever Limited (HINDUNILVR) has exhibited a stable but range-bound price trend in late August 2025, trading near ₹2,557 per share. The stock remains a defensive favorite among institutional investors, reflecting its leadership position in the fast-moving consumer goods (FMCG) sector. Over the past few months, the price has oscillated between ₹2,445 and ₹2,630, indicating consolidation as the market weighs modest volume growth against persistent margin pressures.
Financially, HINDUNILVR continues to report robust revenues and steady profits, although volume growth has faced challenges due to subdued rural demand and inflationary impacts on input costs. The company retains a healthy balance sheet, low debt levels, and a solid dividend payout record, supporting its long-term investment appeal. Its premium valuation is driven by the brand’s market dominance and expectation of renewed growth as consumer demand normalizes.
Technically, the stock has bounced off major support levels, with moving averages indicating a neutral-to-positive bias. Momentum oscillators suggest the potential for mild upward movement if broader market sentiment improves, but significant upside may be capped unless there is a visible catalyst in earnings or sector sentiment. Overall, Hindustan Unilever remains a steady compounder suited for conservative, long-term portfolios, though near-term price appreciation may be limited without fresh growth triggers.
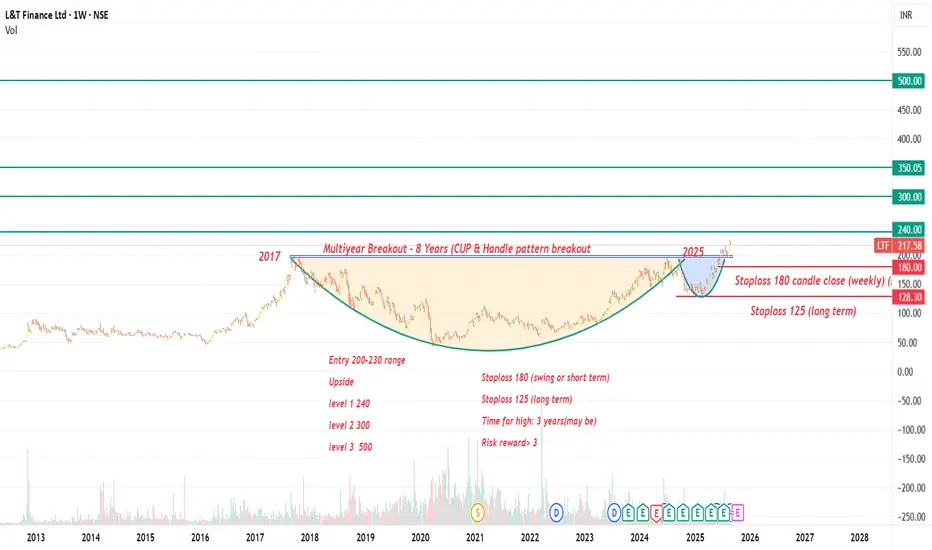
L&T Finance Multiyear breakout. good returns on card!!!After eight years of long consolidation LTF share price broke out, forming cup and handle pattern. This breakout could give good returns if it goes up
Entry- 200-230 range
Target 1 250
Target 2 300
Target 3 500
Stoploss 180 &125
BERKSHIRE HATHAWAY stock updateBERKSHIRE HATHAWAY liquidity grab on 462$. bullish scenario from. take long posistion
premium(resistance)=542$ .
target is 542$

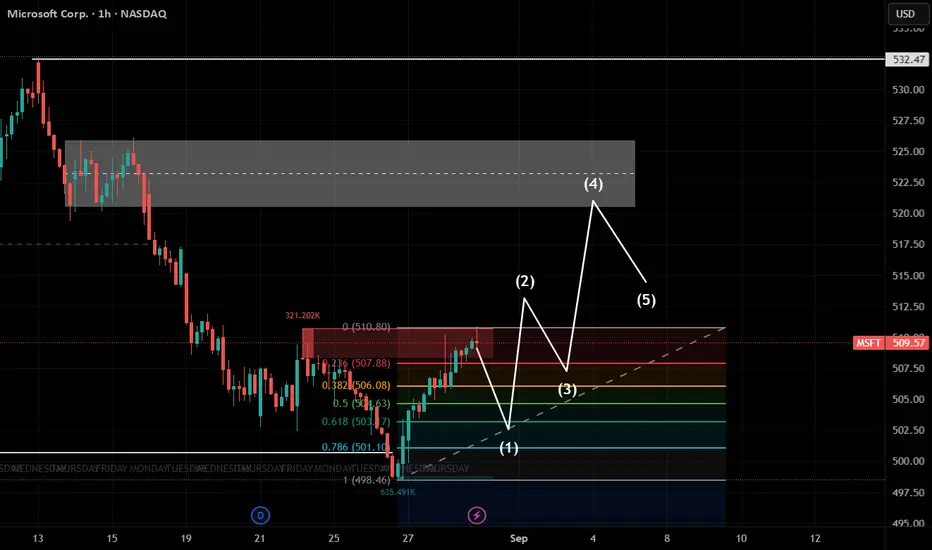
microsoft stock updatemicrosoft stock grab previous liquidity 501$. stock in demand zone aera.to take long position wait for retracement area and take. premium(resistance)area is 520$ to 532$
1st target = 520$
2nd target = 532 $
BTCUSD Long Setup – Trend Continuation Play📌 Trade Details
Entry: 113,256.5
Target: 115,317.7
Stop Loss: 111,874.4
📊 Trade Rationale
✅ Trend Continuation: Price has respected the ascending trendline multiple times, indicating strong buyer interest.
✅ Break of Structure: Recent higher highs and higher lows confirm bullish momentum.
✅ Support Flip: Zone around 113,050 acted as resistance earlier and is now being retested as support.
✅ Volume Confirmation: Rising volume supports the bullish continuation bias.
✅ Clean Risk–Reward: With SL below structure and TP near major resistance, this setup offers a favorable RRR.
🎯 Target Zone
The target aligns with the next strong supply zone at 115,300+, where sellers may re-enter.
⚠️ Risk Management
Always size positions wisely, as crypto remains highly volatile. Protect your capital first.
Disclaimer:
This idea is for educational purposes only and not financial advice. Do your own research before entering any trade.

SBI Price Action & Option Opportunity State Bank of India (SBI) is once again respecting its well-defined range on the daily chart, with price consolidating between the ₹780 and ₹840 support-resistance zone. Today, SBI closed at ₹807.85, down -1.05%, continuing its oscillation within this horizontal channel.
The chart shows potential for a bounce from the lower boundary near ₹800, with a dotted path illustrating a possible move back toward resistance. Traders may look for confirmation of reversal before initiating new long trades as the range continues to hold.
On the options side, the 30 SEP 2025 PUT 810 contract surged 41.67% today, closing at ₹13.60. This strike has given a move of ₹2.75 (over 20%) recently. This sudden spike suggests rising bearish sentiment or hedging activity, but also hints at possible premium profit-taking if SBI holds above support.
Trading Plan
Monitor SBI near ₹800 for signs of reversal or breakdown.
Long positions can target ₹840 if support holds, with stops below ₹780.
PUT options holders should watch for profit booking if a bounce appears.

Part 2 Master Candlestick PatternAdvanced Strategies for Experienced Traders
If you’ve mastered the basics, here are some advanced setups:
Bull Call Spread → Buy 1 Call, Sell higher strike Call.
Bear Put Spread → Buy 1 Put, Sell lower strike Put.
Butterfly Spread → Profit from low volatility (range-bound market).
Calendar Spread → Buy long-term option, sell short-term option.
These strategies help balance risk vs reward.
SEBI Regulations & Margins
In India, SEBI ensures options trading is safe:
Option sellers must keep high margins.
Brokers must collect upfront premiums.
Intraday exposure limits are monitored.
This protects retail traders from excessive risks.

Part 6 Institutional Trading The Greeks: The Math Behind Options
Advanced traders use Greeks to understand risks.
Delta → Sensitivity of option price to stock price movement.
Gamma → Rate of change of Delta.
Theta → Time decay (how much option loses daily).
Vega → Sensitivity to volatility.
Rho → Sensitivity to interest rates.
Example:
A Call with Delta = 0.6 → If stock rises ₹10, option rises ₹6.
Theta = –5 → Option loses ₹5 daily as time passes.
Options vs Futures
Both are derivatives, but with a key difference:
Futures → Obligation to buy/sell at a price.
Options → Right, not obligation.
Example:
Futures are like booking a hotel room—you must pay whether you stay or not.
Options are like paying for a movie ticket—if you don’t watch, you lose only ticket price.

Part 3 Institutional Trading Types of Option Traders
There are mainly four types of participants:
Option Buyers (Long Call / Long Put)
Pay premium.
Limited loss (premium), unlimited profit.
Usually retail traders.
Option Sellers (Short Call / Short Put)
Receive premium.
Limited profit (premium), unlimited loss.
Usually big institutions (because margin required is high).
This is why buyers dream, sellers earn is often said in option markets.
Why Trade Options?
Options are powerful because they allow:
Leverage → Small premium controls large value.
Hedging → Protect portfolio from crashes (insurance).
Speculation → Bet on direction, volatility, or time decay.
Income → Selling options to earn steady premium (if managed wisely).

Waaree Energies Limited - Near BreakoutIncorporated in December 1990, Waaree Energies Limited is an Indian manufacturer of solar PV modules with an aggregate installed capacity of 12 GW. WEL has five solar module manufacturing facilities in India, with international presence.
Fundamentals:
Market Cap: ₹ 97,343 Cr.
Promoter holding: 64.3 %
FII holding: 2.68 %
DII holding: 2.86 %
Public holding: 30.2 %
Debt: ₹ 1,199 Cr.
Debt 3Years back: ₹ 363 Cr.
Stock looks good on long term holding. Above 3740, All time high breakout and can give more upside movement. Targets are in the chart.

BNB/USDT – Bullish Breakout Trade Idea✅ Entry: 871.564
🎯 Target: 890.455
⛔ Stop Loss: 862.304
🔎 Trade Rationale:
Ascending Triangle Breakout – Price has respected the rising trendline and finally broken above the neckline resistance, signaling bullish continuation.
Volume Confirmation – A notable increase in buying volume supports the breakout strength.
Resistance Flip – The previous supply zone around 870 has turned into support, adding confluence.
📊 With a strong bullish structure and favorable RRR, this setup aims to capture the next push towards 890 zone.
⚠️ Disclaimer: This is not financial advice. Always do your own research and manage risk before trading.
