S Chand & Company Ltd. ---- Deep Analysis (On Subscriber's Demand)
S Chand & Company Ltd. ----Deep Analysis (Weekly & Daily Outlook) + Fundamental Outlook
===========================================================
1. Technical Outlook---------
This analysis is made on Higher Time frame Combined (Weekly & Daily)
I have used Weekly Time Frame chart for showing analysis (I will update Daily chart on Note.)
My Observation ----
1. Market Structure Shift (MSS) --
--Clear Shift from bearish to bullish around late 2020, with break of sturcuture (BOS)
and formation of idm (Inducement)
-- there we saw a trendline liquidity sweep and Institutional BUying Zone near 148-160 levels.
2. Current Price Acttion ---
-- Price currently reacting around 209-210 as former resistance and now becoming potential support.
-- Price has entered previou supply zone, targeting for High Probability POi zone near 260-300 levels.
3. Long Term Institutional Accumulation Zone --
-- Accumulation range and Institutional buy Zone are identified (you can check, i have marked in bold grey.)
-- The Bullish FVG(Fair Value Gap) and Order Blocks zone are respected buy price which means it follows Smart Money.
Short Term Bias (3-4 weeks ) ---- Bullish Outlook
Entry ZOne -- CUrrent Price zone around 210 can act as a base for short term long.
Immediate Target -- 270-280 Levels (A Minor Supply ZOne)
Pullback Possibility -- If market needs liquidity then it may test back towards 200-205 zone (Demand Flip Zone)
SL Zone -- If price breaks below 195-200 on strong volume then it voids the Bullish move for short run.
Mid term Bias (1-3 Months) --- Same Bullish Outlook
Price is gearing up to revisit the High Probability POI around 300-320 levels (Marked in Bold)
Weekly Sturcture is clean and following --
Accumulation >> Expansion >> Pullback >> Re-accumulation >>> Expansion
For Entry module --- Always follow lower time frame and check the Structure shift and displacement for Entry purpose.
IMP --- I will also share (on Note) Daily Time Frame chart and Lower Time Frame chart for Entry module Education purpose. Just Check that also on time when price reaches the demand zone marked in bold.
======================================================================
2. Fundamental Outlook ----------- (Source - Screener)
-- Company is engaged in publishing educational books with products ranging from schools books
, higher academic books, competition and reference books etc.
-- S chand & company is on 2nd position according to Market Cap in its peers and key competitor is Navneet Education.
-- Company has a diverse portfolio with over 11000 titles and has sold over 50 million books in past year.
-- Latest News on S chand reports Highest 5-year revenues.
---Compounded Sales Growth
10 Years: 4%
5 Years: 11%
3 Years: 14%
TTM: 9%
---Return on Equity
10 Years: 3%
5 Years: 4%
3 Years: 5%
Last Year: 6%
FY25 Projections ---
1. The Company Expects their Operating Revenues to grow in double digits.
2. EBITDA margin band upgraded to 17%-19% (up from 16%-18% in the last year).
3. Company aims to remain net debt-free for at least three quarters during FY25.
(Source -- Screener website for Fundamental information)
==========================================================================
(Traders and Analysts or Anyone, Your views or observations and comments are most welcome.)
Disclaimer -- This analysis is made for Educational purpose only. Do not consider it as any Investment idea. Consult your financial advisor before any investments.
Fundamental Analysis

Investment Trading Setup - Growth & Wealth✅ Investment Trading Setup – “GARP + RSI” Model
🧠 Step 1: Fundamental Filter (GARP - Growth at Reasonable Price):-
Use screeners or research reports to filter stocks with:
• Revenue Growth: > 12% CAGR (3–5 yrs)
• PAT Growth: > 15% CAGR (3–5 yrs)
• ROCE: > 15%
• Debt/Equity: < 0.5 (or < 1 for capital-intensive sectors)
• PEG Ratio: < 1.5 (Growth at a Reasonable Price)
• Institutional Holding: Rising trend over last 2–3 quarters
✅ Example sectors: Specialty Chemicals, Private Banks, IT Product, Pharma APIs, Auto Ancillaries.
I strongly advise you all to go for most mid cap and some small cap segments as major growth is expected from this 2 verticals.
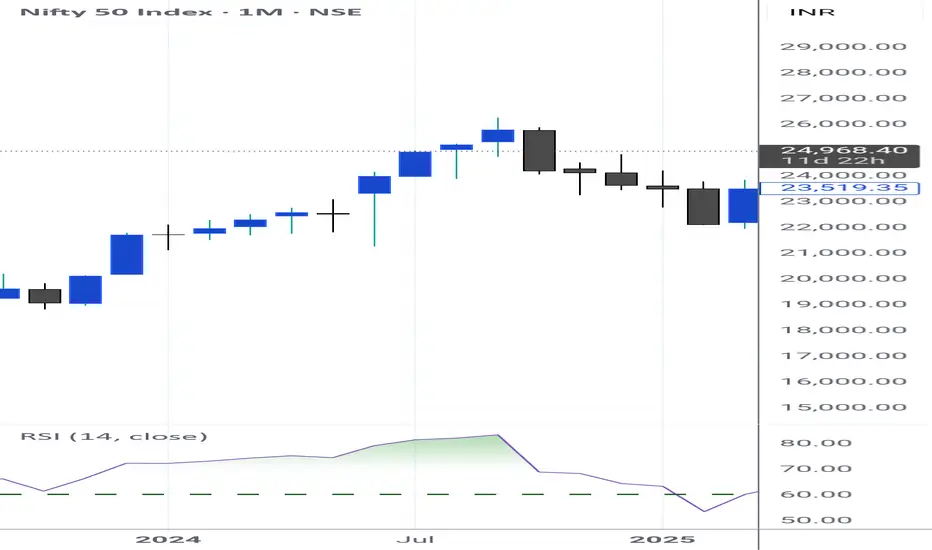
📈 Step 2: Technical Entry (Monthly + Weekly RSI Confirmation)
Once fundamentals are strong, check charts:
On Monthly chart:
• RSI(14) > 60 or crossing above 60
• Price breaking out of multi-month resistance or cup & handle/base
On Weekly chart:
• RSI(14) > 55 and trending higher
• Volume > 20-week average during breakout week
🔁 Optional Add-On: Use 200 DMA and 50 DMA Golden Cross for extra confirmation.
🎯 Entry & Risk Management
• Buy Zone: After breakout on weekly chart with confirmation of RSI
• Stop Loss: Below recent swing low (weekly or monthly)
• Pyramid/Add: On every 15–20% dip if fundamentals remain intact
🏁 Exit Rules
• Major fundamental deterioration (falling ROCE, rising debt)
• Technical breakdown below 200 DMA with heavy volume
• Stock becomes significantly overvalued (e.g. P/E > 3x sector average + RSI > 80)
🧾 Example Stocks That May Fit This Model (as of mid-2025)
✅ Mid Cap Growth Stocks (₹10,000 Cr to ₹50,000 Cr Market Cap)
Suprajit EngineeringAuto AncillariesHigh ROCE, consistent profit growth, global exportsKPI Green EnergyRenewable EnergyStrong revenue CAGR, solar EPC + IPP modelKEI IndustriesCables/WiresScalable, infra theme, strong profit marginsSona BLW PrecisionEV & Auto TechEV-ready, global OEM exposureJ.B. ChemicalsPharmaConsistent earnings, margin expansion, clean balance sheetNarayana HrudayalayaHospitals/HealthcareAsset-light model, expanding RoCE, high promoter skinSansera EngineeringAuto EngineeringDiversified clientele, improving marginsPolycab IndiaWires & CablesStrong infra push, leader in B2C wire segmentTriveni TurbineEngineering/Clean TechHigh margin niche business, export growtheMudhra Ltd.IT/Digital SignatureFast growth, unique niche (cybersecurity theme)
🚀 Small Cap Growth Stocks (< ₹10,000 Cr Market Cap)
Ksolves IndiaIT Services/NicheDebt-free, high RoE, software exportsNGL Fine ChemPharma APIsHigh margins, good growth visibilityGensol EngineeringSolar EPCEV + Solar + Infra theme, fast-growingShivalik BimetalSpecialty AlloysHigh-tech materials, strong RoEHLE GlascoatSpecialty Chem/EquipLeader in glass-lined equipment, capex doneIndia PesticidesAgrochemClean books, exports-led growthGNA AxlesAuto ComponentsPickup in CV/Tractor cycle, strong balance sheetLa Opala RGConsumer DurablesHigh margins, niche player in opalwareDynacons SystemsIT Infra ServicesNiche contracts, high profitabilityZen TechnologiesDefence TechDefence theme, order book visibility
📊 Suggested Metrics You Can Track:
• Revenue CAGR (3Y): >15%
• PAT CAGR (3Y): >20%
• ROCE: >18%
• D/E Ratio: <0.5
• Promoter Holding: >50% (or rising trend)
• Cash Flows: Positive from operations
Note - I have provided you all with my best 4 setups used by big firm and I can assure you they are working for us for the past 18 years.
Check my post in the profile -
Setup provided were:-
Positional Trading Setup
Swing Trading Setup
Stock Options Buying Setup
And Investment Trading Setup above.
I wish you all the best and am sure and confident that you will reflect and ponder on how simple techniques work.
At Last, KISS - Keep it Simple and Systematic.
Happy Trading!
Faraaz T
Sr. Ex. Financial and Equity Analyst
Stockholm Securities
Liquidity Concepts & Smart Money Trading💧 What is Liquidity in the Stock Market?
In simple terms, liquidity means how easily you can buy or sell a stock (or any asset) without affecting its price too much.
📌 Imagine This:
You're at a crowded market and want to sell 10 bags of rice. If there are many buyers, you’ll sell quickly at your price. That’s high liquidity.
But if only 1 buyer is there, you’ll need to lower the price—or wait. That’s low liquidity.
✅ High Liquidity Stocks:
Easy to enter and exit
Tight bid-ask spread
High volume and interest
Examples: Reliance, HDFC Bank, TCS, Infosys
🚫 Low Liquidity Stocks:
Wide spread
May not execute large orders fast
Often in smallcap or SME segments
Prone to manipulation
So, as a trader or investor, liquidity matters because it affects:
Speed of your trades
Slippage (difference between expected and executed price)
Risk of getting trapped in illiquid counters
🧠 Who is “Smart Money”?
“Smart Money” refers to the big, institutional players who move the market silently.
🧱 Types of Smart Money:
FIIs (Foreign Institutional Investors)
DIIs (Domestic Institutional Investors)
Mutual Funds, Pension Funds
Hedge Funds
Prop Desks (Proprietary traders of large brokers or banks)
These players do not trade like retail traders. They have:
Huge capital
Access to better research
Advanced tools and algorithms
Patience to accumulate or distribute over days/weeks
The power to create or absorb liquidity
They don’t chase stocks. They build positions strategically.
🎯 The Relationship Between Liquidity & Smart Money
This is where it gets interesting.
Smart Money doesn’t want you to know what they’re doing. So they operate in stealth mode, using liquidity zones to enter/exit.
Let’s break this down in real terms.
💡 Real Example: How Smart Money Uses Liquidity
Scenario: Let’s say a mutual fund wants to buy ₹500 crore worth of a midcap stock.
If they suddenly place a large buy order, the price will shoot up.
So what do they do?
They wait for panic selling, like during news, results, or false breakdowns.
They create liquidity pools—zones where many stop-losses are triggered.
Retail traders sell in panic, creating supply.
Smart money absorbs quietly.
This is called accumulation.
Similarly, when they want to sell, they:
Push price up with breakout candles
Attract retail buyers chasing the move
Slowly distribute their holdings
Leave small players trapped at the top
🔄 Concepts You Must Know
1. Accumulation Zone
Where smart money buys silently
Flat or range-bound price action
Volume slowly rising
No major breakout yet
2. Distribution Zone
Where smart money sells quietly
Price looks strong, but momentum slows
Volumes stay high
Sudden rejections from resistance
3. Liquidity Grab / Stop Hunt
A deliberate move to trigger stop-losses and create liquidity
Often seen before real trend begins
Can be traps for retail traders
Example: Price breaks below support, then sharply reverses
📊 How to Track Liquidity & Smart Money Moves
Here are tools and techniques used by traders:
📌 1. Volume Profile
Shows where most trading has happened
High Volume Nodes (HVN): Liquidity zones
Low Volume Nodes (LVN): Price moves quickly
Watch for consolidation near HVNs—could be accumulation/distribution
📌 2. Order Book / Market Depth
For intraday traders
Shows how many buy/sell orders exist at various levels
Spikes in orders may signal liquidity traps or fake pressure
📌 3. Open Interest (OI) in Options
Rising OI + flat price = buildup
Long unwinding or short covering signals smart money behavior
📌 4. FII/DII Data
Track daily net buy/sell figures
Sectoral trends from mutual fund holdings
FII selling = market weakness, especially in large caps
📌 5. Wyckoff Method (Optional but powerful)
Focuses on market cycles
Accumulation → Markup → Distribution → Markdown
Helps understand the intent behind price action
🔥 Common Smart Money Setups
✅ 1. False Breakout Trap
Price breaks above resistance
Retail traders enter long
Smart money sells into strength
Price reverses
How to Spot:
Check volume
See if candle closes above or within resistance
Confirm with next bar’s reaction
✅ 2. Stop-Loss Hunting
Price dips below support
Retail SLs get hit
Price reverses sharply with strong volume
How to Spot:
Sudden wick below major swing low
Sharp V-shaped recovery
Volume spike + reversal candle
✅ 3. Liquidity Sweep Before Rally
Sideways phase ends with a big red candle
Then reversal and trend begins
This is smart money loading positions
🛠️ How to Use This in Trading (With Practical Tips)
✅ For Swing Traders:
Identify consolidation zones with rising volume
Wait for breakout or breakdown with volume
Add volume profile to spot high-activity zones
Check if OI is building around a strike in options
✅ For Intraday Traders:
Track OI buildup + price action around round numbers
Use Market Profile or VWAP to understand liquidity zones
Watch for traps near open or just before close
✅ For Investors:
Watch mutual fund buying sectors
Use MF/ETF monthly reports for accumulation patterns
Avoid chasing rallies—enter during base formation
✅ Final Thoughts
Most retail traders lose money not because their analysis is wrong—but because they don’t understand the rules smart money plays by.
In 2025’s market, where FIIs, algorithms, and institutions dominate, understanding liquidity and smart money behavior is not optional—it’s essential.
You don’t need millions to trade like smart money. You just need the right mindset, tools, and the patience to wait for clean setups.
📌 Remember: “Volume reveals the truth. Price tells the story. Liquidity is the language smart money speaks.
Syngene International Price Action## Current Price and Trend Overview
- The stock is currently trading near ₹657, having pulled back considerably from its 52-week high close to ₹961, but still above the 52-week low around ₹600.
- Price movement has been mixed, with recent gains of about 2% over the last week but a decline of nearly 10% in the past three months. Over six months, the stock is down close to 20%. The longer-term gain (three-year basis) is about 5%.
- The stock remains within a broad horizontal range, with prices fluctuating between about ₹600 and ₹735 in recent months. Price volatility is moderate.
## Technical and Market Structure
- A short-term bounce occurred from a May low, but overall momentum remains sideways. Both short- and long-term moving averages are generally positive, offering some technical support.
- Key support levels are seen at ₹645–₹650, with stronger support near ₹600. Immediate resistance is around ₹670–₹680; a break above could indicate further upward momentum.
## Valuation and Financial Perspective
- The price-to-earnings (P/E) ratio is in the mid-50s, relatively high for the sector, signaling a premium valuation.
- Price-to-book (P/B) value is above 5, suggesting the company trades at more than five times its book value.
- Market capitalization is about ₹26,500 crore, making Syngene a significant but not leading player in its industry.
- Return on equity is modest at around 12%, and dividend payout remains low relative to profits.
## Recent Performance Factors
- Promoter holding is stable, which is generally regarded as a sign of confidence.
- The latest quarterly earnings showed a minor upside surprise, with earnings per share coming slightly above market expectations.
- Revenue is expected to show a steady uptrend in the coming quarters, but overall growth rates have moderated compared to earlier years.
## Outlook and Sentiment
- The prevailing sentiment is cautious, with the stock recently upgraded by some analysts from “Hold” to “Buy Candidate,” based largely on improved moving average signals and a rare technical “Golden Star” event that often precedes positive moves.
- Option chain analysis indicates a wide range, reflecting indecision among market participants.
- Analysts’ 12-month price targets generally center around ₹712, with a bullish scenario up to ₹825 and a downside floor near ₹570.
## Summary
- Syngene International’s share price is consolidating with no clear breakout, but several technical and fundamental factors are turning slightly positive.
- Upside potential exists if key resistance levels are crossed, while failure to hold current support could lead to further downside.
- The stock remains in focus for longer-term investors looking for stable growth in the contract research and biopharma segment, though near-term trading is likely to remain range-bound unless a new catalyst emerges.

Support and ResistenceWhat is Support?
Support refers to a price level where a downtrend tends to pause or reverse due to increased buying interest. When price drops to a support level, traders and investors see it as a “discounted” price, which attracts buying activity. This buying demand causes the downtrend to slow down or reverse.
Key Points About Support:
It acts as a floor in the market.
Support levels are created when buyers are willing to purchase at a certain price level.
The more times price touches a support level and bounces back, the stronger the support becomes.
Once broken, support can become resistance, meaning that if the price breaks below support, it may face difficulty moving back up past that level.
What is Resistance?
Resistance refers to a price level where an uptrend tends to pause or reverse due to increased selling pressure. When price rises to a resistance level, traders see it as an “expensive” price and tend to sell, causing the price to stall or drop.
Key Points About Resistance:
It acts as a ceiling in the market.
Resistance levels are formed when sellers dominate and prevent the price from moving higher.
The more times price touches resistance and fails to break through, the stronger the resistance is.
If price breaks above resistance, it can become support, known as a support-resistance flip.
Why Support and Resistance are Important
✅ Identifies High-Probability Trade Zones – Helps you spot where to enter and exit trades.
✅ Improves Risk Management – Lets you place stop-loss orders around logical areas.
✅ Confirms Market Direction – Breakouts and rejections from these zones signal potential trend continuations or reversals.
✅ Works Across All Timeframes – Support and resistance can be applied to intraday trading, swing trading, and long-term investing.
Types of Support and Resistance
🔹 Horizontal Levels
Flat, horizontal price areas where the market reverses multiple times. This is the simplest and most common form.
🔹 Dynamic Support and Resistance
Levels that change with price movement, usually identified using moving averages like the 50-day or 200-day MA.
🔹 Trendlines
Diagonal support and resistance lines that connect higher lows in an uptrend or lower highs in a downtrend.
🔹 Zones Instead of Exact Lines
Professional traders focus on zones, not exact price points, because the market often reacts within a range.
How Professionals Use Support and Resistance
Institutions use these levels to accumulate positions quietly.
Smart traders wait for confirmation (candlestick patterns, volume increase) before entering trades.
Breakouts of these levels often lead to big moves because many stop-loss orders are triggered, creating momentum.
False breakouts or liquidity grabs are used by big players to trap retail traders before reversing the market.
Final Thoughts
Understanding support and resistance is fundamental to becoming a successful trader. It helps you anticipate market behavior, manage risk, and trade with confidence. Whether you are a beginner or an experienced trader, continuously refining your ability to identify and trade these key levels will improve your consistency and profitability.
Support and resistance are not just lines on a chart — they are the battle zones where market decisions are made. Master them, and you will master the market.

Support and Resistence Part-2✅ The True Meaning of Support and Resistance
At the core, support and resistance levels are psychological price areas where supply and demand dynamics shift. However, in institutional trading, these levels are engineered by large players to trigger retail reactions — such as false breakouts, stop hunts, and liquidity grabs.
Institutions use these levels to:
Accumulate large positions without moving the market.
Manipulate price to create breakout traps.
Trigger liquidity pools where retail stop-losses and pending orders are stacked.
✅ Types of Advanced Support and Resistance
1. Liquidity-Based Zones
Institutions seek liquidity to fill their large orders. They target zones where retail traders:
Place stop losses.
Have pending buy/sell orders.
Expect breakout continuations.
These zones are rarely clean horizontal lines but broader zones where price can spike in and quickly reverse.
2. Order Blocks
Order blocks are the last bullish or bearish candles before a significant price move caused by institutional orders. These are key institutional support/resistance levels where price often returns for mitigation or re-entry.
Bullish Order Block = Support Zone
Bearish Order Block = Resistance Zone
3. Breaker Blocks
When support breaks and flips to resistance (or vice versa), institutions often retest breaker blocks to add positions or induce liquidity.
4. Fibonacci Confluence Zones
Advanced traders use Fibonacci retracement and extension levels in combination with support and resistance zones to identify high-probability trade setups. Common levels like 61.8% and 78.6% often align with key order blocks.
5. Dynamic Support & Resistance (Moving Averages, VWAP)
Institutions monitor:
200 EMA/SMA on higher timeframes as dynamic resistance/support.
VWAP (Volume Weighted Average Price) as an institutional support/resistance during intraday moves.
These dynamic levels often act as price magnets during trend days.
✅ Institutional Manipulation Around Support/Resistance
🔹 Liquidity Grabs (Fake Breakouts):
Price breaks a key level (support or resistance), triggers stops, grabs liquidity, and violently reverses.
Common in forex, indices, and crypto markets.
🔹 Stop Loss Hunting:
Institutions drive price into known stop zones to fill large orders cheaply, especially during low-volume sessions.
🔹 Re-Tests and Confirmations:
Professional traders wait for confirmation after breakouts.
A common method: Break – Retest – Continuation setup, especially around higher timeframe support/resistance.
✅ How to Trade Support and Resistance Like an Institution
Mark Zones, Not Lines: Use zones (20-50 pip zones in forex or 1-2% zones in stocks), not fixed lines.
Use Multi-Timeframe Confluence: Identify higher timeframe levels (Daily, Weekly) and trade based on lower timeframe confirmations (M15, M30, H1).
Wait for Confirmations: Avoid blind entries. Wait for:
Rejection Candles (Pin Bar, Engulfing, Doji)
Break of Structure (BOS) or Change of Character (CHoCH) after grabbing liquidity.
Target Imbalance Zones: Combine support/resistance with fair value gaps (FVG) or imbalances where price is likely to revisit.
Track Volume Reaction: Volume spikes at support/resistance zones often indicate institutional activity.
✅ Pro Tips for Mastering Support and Resistance
Never chase price. Let the market come to your zones.
Higher timeframe levels = stronger reaction zones.
Watch for ‘fakeouts’ during news releases – institutions use volatility to create liquidity spikes.
Learn to recognize exhaustion (long wicks, low momentum) after liquidity grabs to confirm reversals.
Institutional levels often align with market sessions – London Open, New York Open tend to respect these zones more than Asian session.
✅ Final Thoughts
At an advanced level, support and resistance aren’t simple price levels — they are strategic zones used by institutions to trap uninformed traders. Once you start recognizing these patterns, you’ll stop reacting emotionally and start anticipating market behavior like a professional. You’ll know when to stay patient, when to avoid traps, and when to capitalize on market inefficiencies with high-probability, low-risk trades.

Trade Like Istitution Why Learn to Trade Like Institution?
Financial markets are not random. They are highly manipulated and structured systems, controlled by major financial entities. When you trade like institution, you stop guessing and start understanding:
Where the big players place their orders.
How liquidity zones work.
Why certain price levels are targeted before major moves.
How you can identify smart money footprints and follow the dominant trend.
This approach teaches you to trade strategically, patiently, and professionally — eliminating the emotional rollercoaster most traders experience.
What You Will Learn in “Trade Like Institution”
✅ Smart Money Trading Concepts
Understand how institutions manipulate markets, create liquidity, and trap retail traders. Learn the basics of accumulation, manipulation, and distribution phases.
✅ Market Structure and Order Flow
Read the market from an institutional perspective using pure price action and market structure analysis. Identify break of structure (BOS) and change of character (CHoCH) signals that reveal when the market is about to move.
✅ Order Block Identification
Learn to locate order blocks, where institutions place their large orders. These zones are often the key areas where price reverses or explodes in a specific direction.
✅ Liquidity Zones and Stop-Loss Hunting
Discover how to identify liquidity pools, understand stop-loss hunting techniques, and position yourself for trades after liquidity grabs.
✅ Risk Management Like Institutions
Master the art of risk management, learning how big players manage risk efficiently to stay profitable long-term, even after losses.
✅ High-Probability Trade Setups
Get access to reliable entry techniques with precise stop-loss placement and optimal reward-to-risk setups that minimize risk and maximize returns.
✅ Live Market Application
Learn through real-world market examples, live sessions, and chart analysis to see how institutional concepts apply in active markets like forex, stocks, indices, and crypto.
Who Should Learn to Trade Like Institution?
This course is designed for:
📊 New traders who want to start the right way without falling into retail traps.
💡 Intermediate traders who have experience but struggle with consistency.
💼 Full-time or part-time traders who wish to level up their skills.
📈 Investors who want to actively manage and grow their wealth.
🎯 Ambitious traders who want to make trading a serious and professional income source.
Benefits of Trading Like Institution
✅ Stop being a victim of market manipulation and start trading with the market movers.
✅ Eliminate confusion, follow clean price action, and trade with confidence.
✅ Avoid low-probability trades by understanding where the real market action happens.
✅ Build strong discipline and follow a professional trading process.
✅ Achieve long-term profitability by managing risk like professionals.
✅ Become a confident, independent trader capable of thriving in any market condition.
Trading success comes from learning the truth behind market movements and following the professional path. This course will completely transform your approach to the markets. With Trade Like Institution, you’ll stop guessing, start predicting, and trade with an edge just like the top institutional traders do every single day

Learn Institutional TradingWhy Learn Institutional Trading?
The financial markets are not random; they are highly structured environments controlled by large financial players who leave visible footprints on the chart. Most retail traders don’t see these footprints and end up on the wrong side of the market. By learning institutional trading, you will finally understand:
Why the market moves the way it does.
How to spot liquidity traps and avoid stop-loss hunting.
Where smart money enters and exits trades.
How to trade with confidence instead of fear and guesswork.
This course focuses on the real mechanics of price movement, not on unreliable indicators or random trade signals.
What You Will Learn in Institutional Trading
✅ Smart Money Concepts (SMC):
Learn how institutional traders accumulate and distribute orders, using liquidity to their advantage. Understand the true story behind price action.
✅ Liquidity and Order Blocks:
Master the art of identifying liquidity pools, order blocks, and market manipulation zones. Understand where smart money enters the market and how you can follow their lead.
✅ Market Structure Mastery:
Learn to read market structures with precision, identify internal and external structures, and capitalize on market shifts with high-probability trade setups.
✅ Entry and Exit Strategies:
Get access to professional-grade entry methods, including refined confirmation entries, break-of-structure (BOS) trades, and optimal risk-reward setups.
✅ Risk Management Techniques:
Understand how institutions manage risks and protect their capital. Implement strong risk management rules to protect your trading account from unnecessary losses.
✅ Live Market Sessions and Mentorship:
Participate in live market discussions, chart breakdowns, and Q&A sessions with expert traders who trade institutional concepts every day.
Who Can Learn Institutional Trading?
This course is suitable for:
📌 Beginners who want to start with professional strategies from day one.
📌 Intermediate traders who are tired of inconsistent results.
📌 Advanced traders who want to refine their understanding of market manipulation.
📌 Investors who wish to add active trading as an income source.
📌 Aspiring professionals who aim to make trading a serious career path.
Benefits of Learning Institutional Trading
✅ Trade with clarity and confidence, knowing you are on the side of smart money.
✅ Stop chasing trades and start trading with high-probability setups.
✅ Learn to avoid retail traps and false breakouts.
✅ Build a sustainable trading career with proper risk management and psychological discipline.
✅ Apply your skills to any market: stocks, forex, crypto, indices, or commodities.
✅ Experience real growth as a professional trader, thinking several steps ahead of the market.
Learn Institutional Trading is more than just a course — it’s a complete professional transformation. It equips you with the skills, mindset, and strategies to succeed in modern financial markets. Stop trading blindly and start trading with purpose, accuracy, and confidence.

Trading Master Class With ExpertsWhy Choose the Trading Master Class With Experts?
In the world of trading, there’s a fine line between success and failure. The financial markets are full of opportunities but also come with significant risks. The key difference between winning traders and losing traders is education, discipline, and strategy. This masterclass is not just about learning how to trade; it’s about developing a professional trading mindset, learning proven techniques, and practicing high-probability setups under the guidance of industry experts.
This is a result-oriented program designed to give you a complete transformation from a confused trader to a disciplined market participant.
Key Highlights of the Master Class
In-Depth Market Knowledge: Learn the complete fundamentals of financial markets, including market structure, how different asset classes work, and what drives market movements.
Technical Analysis Mastery: From candlestick patterns to advanced indicators, understand how to read charts like a pro. Learn key technical tools like moving averages, RSI, MACD, Fibonacci retracements, and more.
Professional Trading Strategies: Master multiple trading styles including day trading, swing trading, scalping, and positional trading. Get access to expert-verified strategies used by institutional traders.
Options and Derivatives Trading: Understand the power of options trading, futures contracts, hedging techniques, and options strategies like iron condor, spreads, straddles, and strangles.
Institutional Trading Insights: Discover how big players operate in the market. Learn about smart money concepts, liquidity traps, stop loss hunting, and how to trade in alignment with market movers.
Risk Management and Trading Psychology: Learn how to protect your capital using strict risk management rules. Understand the psychological side of trading and how to build emotional discipline for consistent success.
Live Trading Sessions: Participate in live market analysis and live trading sessions with experts who explain their trades in real-time, helping you understand their decision-making process.
Community and Mentorship: Join a supportive community of traders where you can share ideas, discuss setups, and receive continuous guidance from mentors.
Who Should Attend This Master Class?
This masterclass is suitable for:
Aspiring traders who are looking for a solid foundation to start their trading journey.
Intermediate traders who are struggling with consistency and need structured guidance.
Investors who want to learn active trading techniques to multiply their returns.
Working professionals who want to trade part-time with smart strategies.
Full-time traders who want to sharpen their skills and expand their market knowledge.
What You Will Achieve After This Master Class
✅ You will be able to independently analyze charts and identify profitable trading opportunities.
✅ You will develop professional risk management habits that protect you from heavy losses.
✅ You will gain the confidence to trade any market condition — bullish, bearish, or sideways.
✅ You will have clear strategies to trade with discipline, eliminating guesswork and emotional mistakes.
✅ You will build a trader’s mindset focused on growth, patience, and long-term profitability.
This is not just another trading course. It is a complete transformation program that helps you think, act, and succeed like a professional trader. Step into the world of high-probability trading and change your financial future with the Trading Master Class With Experts.

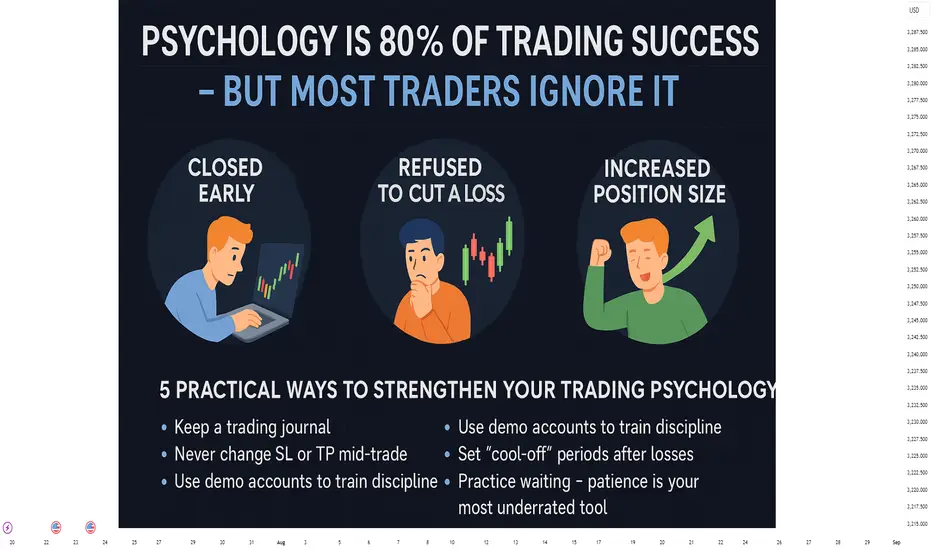
Psychology Is 80% of Trading Success But Most Traders Ignore ItPsychology Is 80% of Trading Success – But Most Traders Ignore It
“Have you ever entered a perfect trade… and still lost?”
Right direction.
Clear technical setup.
Trend confirmation was there.
Yet you closed early.
Or held a losing trade too long.
Or jumped back in out of revenge after a loss.
It wasn’t your system’s fault.
It was your psychology.
💡 Most traders don’t fail because of bad analysis – they fail because of poor emotional control
Let’s walk through some common real-life situations every trader has experienced at least once:
🎯 1. You closed your trade early – afraid the market might reverse
Case study:
A trader entered a long position on XAUUSD at a support zone (2360), aiming for TP at 2375.
But when price reached 2366, he closed out early – afraid to “lose profits.”
The market later hit his original TP perfectly.
➡️ This is classic loss aversion – the fear of losing what you’ve already gained.
🎯 2. You refused to cut a loss – hoping the price would come back
Case study:
A trader shorted EURUSD expecting a pullback, but price broke resistance and continued up.
Instead of cutting the loss, he widened his stop loss, holding onto hope.
The result? A bigger loss than planned.
➡️ This is denial – a refusal to accept you’re wrong, leading to emotional attachment to the trade.
🎯 3. You increased your position size after a winning streak
Case study:
After two strong wins, a trader feels confident and increases position size on the next trade…
Even though the setup isn’t as strong.
That trade ends in a loss – wiping out earlier profits.
➡️ This is overconfidence bias – a dangerous psychological state after wins.
📊 Technical skills only account for 20% – the remaining 80% is mastering yourself
You might:
Understand price structure
Use advanced indicators
Follow a solid trading system
But if you:
Break your stop loss rules
Scale up recklessly
Enter trades impulsively
Then your edge vanishes.
Success becomes inconsistent.
🧠 5 Practical Ways to Strengthen Your Trading Psychology
✅ Keep a trading journal – especially track your emotions
Ask: “Did I follow my plan? Or was I trading to ‘feel better’?”
✅ Never change SL or TP mid-trade
Stick to your original plan. Discipline builds consistency.
✅ Use demo accounts to train discipline, not to prove profitability
Treat each demo trade as if real money is at stake.
✅ Set mandatory “cool-off” periods after consecutive losses
For example: 2 losses = no trades for 24 hours.
✅ Practice waiting – patience is your most underrated tool
Pro traders often wait days for a valid setup. That’s not inactivity – that’s control.
🔁 Trading is not a search for the perfect system – it’s a journey of mastering your own mind
A strategy with only 55% win rate can still be highly profitable
…if paired with discipline, risk management, and emotional control.
But…
A system with 70% accuracy can still blow your account
…if your psychology breaks down under pressure.
🎯 Final Thoughts:
The financial markets reward those who can control themselves – not just those who analyze well.
You don’t need to be smarter than others.
You don’t need to master 10 indicators.
But you must be able to stay calm, act rationally, and follow your rules.
Knowledge lets you see the opportunity – but psychology determines if you survive it.
DOGE Long Swing Setup – Institutional Narrative Heating UpThe Dogecoin narrative is back in focus! Bit Origin ( NASDAQ:BTOG ) is raising $500M to build one of the world’s largest DOGE treasuries—becoming the first U.S.-listed company to treat CRYPTOCAP:DOGE as a core asset. With institutional interest rising, DOGE could see renewed momentum. Our last trade surged 50%—here’s the next entry:
📌 Trade Setup:
• Entry Zone: $0.20 – $0.21
• Take Profit Targets:
o 🥇 $0.23 – $0.24
o 🥈 $0.27 – $0.28
• Stop Loss: Daily close below $0.18
#crypto #DOGE #BTOG

Dell Technologies Inc (DELL) – Accelerating Toward AI LeadershipCompany Snapshot:
NYSE:DELL is transforming from a traditional hardware player into an AI-driven, high-margin solutions provider, underpinned by strategic GPU partnerships and a shift toward recurring software revenue.
Key Catalysts:
AI Data Center Momentum 🔌
Deep collaborations with NVIDIA and AMD enable Dell to deploy cutting-edge GPUs across its server portfolio—critical infrastructure for AI workloads and enterprise compute.
Recurring Revenue Growth 💼
Double-digit gains in software and services are reducing cyclicality, driving margin expansion, and making the business model more resilient and predictable.
Capital Return Strength 💰
Dell returned $1B+ to shareholders last quarter, including a 20% dividend increase, backed by $2.2B in free cash flow—demonstrating strong capital discipline and confidence.
Investment Outlook:
Bullish Entry Zone: Above $108–$110
Upside Target: $175–$180, supported by Dell’s AI-enabled pivot, margin tailwinds, and shareholder-friendly capital strategy.
🧠 Dell’s AI infrastructure push and software-driven transformation position it as a top-tier tech compounder.
#Dell #DELL #AIInfrastructure #DataCenters #NVIDIA #AMD #TechStocks #RecurringRevenue #Dividends #Buybacks #GrowthStock #AIComputing

Earnings in Focus Companies in the Spotlight
Reliance Industries (RIL)
Reliance’s results are among the most awaited in the Indian market. It touches almost every Indian household through its telecom (Jio), retail, and oil-to-chemicals arms.
In Q1, analysts expected strong year-on-year growth in profit, partly helped by a one-time gain from a stake sale.
Retail and digital segments were projected to post steady growth.
Oil-to-chemicals margins were expected to remain stable due to global energy price stabilization.
Since Reliance has a significant weight in both Nifty and Sensex, even a 2–3% move can swing the broader indices.
JSW Steel
JSW Steel posted stronger-than-expected operating profits. The volume growth was robust and pricing held steady despite global uncertainties.
Steel performance is considered a proxy for infrastructure and housing demand.
Better margins mean improved profitability outlook, which often lifts peer stocks like Tata Steel and SAIL too.
Wipro
Wipro surprised the street with a better-than-expected net profit growth and steady revenue.
This came after a few muted quarters, giving confidence to IT investors.
The firm also secured some large deals, which improved guidance.
When a Tier-1 IT company beats expectations, it often leads to a short-term sector-wide rally.
Axis Bank
Axis Bank reported a small decline in net profit due to an increase in provisions and asset quality slippage.
Markets reacted negatively, with the stock dropping more than 5%.
This raised some concerns for the entire banking sector, especially around retail loan delinquencies.
Bank earnings are carefully tracked for signs of economic health since they’re the first to show stress in the system.
Hindustan Zinc
Despite a year-on-year drop in profit, Hindustan Zinc beat market expectations.
The metal segment held up well.
Higher cost efficiency offset pricing pressure.
It shows that even in commodity-heavy businesses, efficiency and scale can drive earnings resilience.
3. 📈 How Markets React During Earnings
Earnings are one of the biggest catalysts for short-term market movements. Here’s how different market participants respond:
Retail Traders: Look for quick intraday or swing opportunities based on the reaction to earnings.
Institutional Investors: Focus more on guidance, margin outlook, and strategic plans.
FIIs & DIIs: Use results to rebalance portfolios across sectors.
This week, markets opened flat with mixed sector movements. Financials remained under pressure due to Axis Bank, while energy and metals were relatively stronger.
4. 🎯 Trading Strategies During Earnings Season
🔹 Intraday Traders:
Monitor stock-specific results.
A strong beat often results in gap-up opens, followed by either a continuation rally or profit-booking.
Misses often result in sharp selling pressure.
🔹 Swing Traders:
Look for strong earnings + bullish technical setup for 3–5 day momentum trades.
Weak earnings can be played with bearish options like puts or bear spreads.
🔹 Investors:
Focus on long-term stories where earnings confirm improving fundamentals.
Use dips in strong businesses as buying opportunities.
5. 💼 Sectoral Trends from Current Earnings
✅ IT Sector:
Wipro’s good performance and deal wins have created optimism.
If the rest of the IT majors follow suit, it may indicate a bottom in the tech cycle.
✅ Metals:
JSW Steel’s strong numbers confirm ongoing industrial demand.
Infra push and China’s restocking are adding tailwinds to global metal prices.
❌ Financials:
Axis Bank’s weaker asset quality is a concern.
Market will now look toward HDFC Bank, SBI, and ICICI Bank to see if this is a one-off or an emerging trend.
⚖️ FMCG & Consumer:
Awaited earnings from major players like HUL, Dabur, and Nestlé will show how rural and urban consumption are shaping up.
Margin expansion through easing input costs will be closely monitored.
6. 📊 Impact on Broader Indices
Nifty:
Reliance alone has over 10% weight in the index. A positive surprise there can lift Nifty meaningfully.
IT and metals also have significant representation, so results from Wipro and JSW Steel are important.
Bank Nifty:
Axis Bank’s fall dragged the index.
A recovery depends on upcoming results from ICICI Bank and HDFC Bank.
Sector Indices:
Nifty Metal may outperform if positive surprises continue.
Nifty IT needs more broad-based strength to reverse the downtrend.
7. 🧠 What Smart Money Is Watching
Institutional investors are focusing on:
Guidance for the rest of FY25
Cost management: Are companies protecting or growing their margins?
Volume growth: Are revenues rising due to real demand or just price hikes?
Loan growth and credit quality: Especially in the banking space
These insights help long-term investors identify early winners and avoid laggards.
8. 🧾 Key Takeaways for Traders & Investors
Earnings are the strongest short-term trigger in markets.
Reliance results can tilt the entire Nifty one way or the other.
IT is stabilizing, Metals are strong, Financials are shaky—sector rotation is visible.
Stay stock- and sector-specific rather than going fully index-based during earnings season.
9. ✅ Final Words
“Earnings in Focus” isn’t just a headline—it’s the heartbeat of market sentiment right now.
In a market driven by uncertainty (inflation, interest rates, global slowdown), real numbers from real companies matter more than ever. This is the time when:
Traders can catch powerful moves based on short-term surprises
Investors can spot trends and leaders early
Portfolio rebalancing decisions can be guided by facts, not emotions
Whether you’re in for a quick trade or a long-term position, understanding earnings and their market impact is essential.
Bitcoin (BTC/USD) – 1D Timeframe✅ Closing Summary:
Closing Price: ~$119,138 USD
Change: +$836 (+0.7%)
Opening Price: ~$118,302
Intraday High: ~$120,714
Intraday Low: ~$117,715
Bitcoin continued to show resilience by holding above the crucial $118,000 support level, despite facing overhead resistance near its previous high. The price action reflects bullish consolidation following recent surges above $120,000.
🔍 Key Reasons Behind the Price Action:
Institutional Demand Strengthening:
Bitcoin ETFs in the U.S. are witnessing rising inflows.
Hedge funds and family offices are seen increasing allocations, especially as digital assets gain legitimacy post-regulation discussions.
Regulatory Momentum:
U.S. Congress is pushing clearer frameworks around crypto taxation and stablecoins.
Global regulatory certainty (from EU & Japan) boosts confidence among investors and traders.
Weakening U.S. Dollar Index (DXY):
The DXY declined slightly, indirectly aiding BTC’s upward momentum.
Bitcoin remains a favored alternative store of value during fiat uncertainty.
Limited Miner Selling:
On-chain data shows a decline in miner distribution, meaning less sell-side pressure.
Miners seem optimistic about long-term prices and are holding reserves.
📈 Technical Outlook (Short-Term):
Support Zone: $117,500 to $118,000
Price found strong buyers in this range. It’s crucial that Bitcoin holds this level to maintain bullish structure.
Resistance Zone: $120,700 to $122,500
Previous highs around $122K serve as the next resistance. A daily candle close above this may trigger momentum buying.
Indicators:
RSI (Relative Strength Index): ~62 (bullish but not overbought)
MACD: Bullish crossover confirmed
Volume: Moderate, but above 20-day average
📆 Recent Trend Performance:
1-Day Return: +0.7%
1-Week Return: +2.1%
1-Month Return: +12.8%
3-Month Return: +35.4%
YTD Return: +61.2%
Bitcoin continues to outperform traditional asset classes, showing strong long-term growth despite short-term volatility.
🧠 What Traders & Investors Should Know:
Short-Term Traders: Consider range trading between $118K–$122K. Breakout above $122K may signal fresh upside potential.
Swing Traders: Watch for bullish continuation patterns (bull flags or cup-and-handle). Enter long if price closes above $121.5K on high volume.
Long-Term Investors: Accumulation at current levels could be ideal before the next halving cycle and broader adoption via ETFs and institutions.
🛠️ Chart Behavior and Candlestick Analysis:
Candle Type: Bullish candle with long lower wick, indicating buying pressure near support.
Pattern: Minor flag formation with potential breakout above $121K on next daily move.
🧭 Macro-Level Catalysts to Watch:
U.S. Bitcoin ETF weekly flows (Friday updates)
Fed interest rate guidance (next FOMC meeting)
Crypto regulation developments in U.S., EU, and APAC
On-chain metrics: exchange inflow/outflow, whale accumulation
💬 Conclusion:
BTC/USD is showing solid structure in the 1D chart. With strong institutional demand, improving global regulation, and technical support holding, Bitcoin is in a healthy uptrend. The short-term outlook remains bullish as long as BTC holds above $118K. A breakout above $122K could fuel the next leg towards $125,000–$130,000.

Advance Option Trading✅ What is Advanced Options Trading?
At the advanced level, traders use option combinations, multi-leg strategies, and hedging techniques to:
Maximize profits
Minimize risks
Take advantage of market volatility and time decay (Theta)
You don’t just predict direction; you trade direction, volatility, and time decay together.
✅ Core Concepts in Advanced Options Trading
1. Greeks Mastery
Delta: Measures how much the option price moves with the underlying asset.
Gamma: Rate of change of Delta.
Theta: Time decay — how much the option loses value every day.
Vega: Sensitivity to volatility changes.
Rho: Impact of interest rate changes (used less by retail).
Understanding Greeks helps you manage profits and risks more precisely
3. Volatility Trading
Institutions trade implied volatility (IV), not just price direction. Advanced traders use tools like IV Rank and IV Percentile to:
Sell options when IV is high (premium rich)
Buy options when IV is low (cheap options)
4. Hedging Techniques
Use options to protect your portfolio from major losses.
Example: Holding stocks and buying Protective Puts to limit downside risk.
Example: Selling Covered Calls to generate monthly income on stock holdings.
✅ Benefits of Advanced Options Trading
💸 Profit in Any Market Condition (up, down, sideways)
⏳ Earn from Time Decay (Theta Decay)
🛡️ Control Risk with Defined Risk Strategies
🎯 Higher Probability of Consistent Returns
📉 Less Capital, More Leverage
✅ Who Should Learn Advanced Option Trading?
✅ Traders with basic options knowledge
✅ Investors wanting to hedge portfolios
✅ Intraday or positional traders
✅ Those seeking consistent monthly income
✅ Final Thoughts
Advanced Options Trading transforms you from a simple buyer/seller to a strategic trader who uses market forces smartly. You don’t chase trades — you set up calculated, high-probability positions and let the market work for you.

Sagility India Limited Trade Information
Traded Volume (Lakhs) 194.42
Traded Value (₹ Cr.) 87.90
Total Market Cap (₹ Cr.) 21,019.16
Free Float Market Cap (₹ Cr.) 6,857.12
Impact cost 0.87
% of Deliverable / Traded
Quantity 47.47 %
Applicable Margin Rate 17.77
Face Value 10
Price Information
52 Week High (30-Dec-2024) 56.40
52 Week Low (13-Nov-2024) 27.02
Upper Band 50.09
Lower Band 40.98
Price Band (%) 10
Daily Volatility 2.22
Annualised Volatility 42.41
Tick Size 0.01
Adjusted P/E 41.25
Symbol P/E 41.25
Index NIFTY 500
Basic Industry IT Enabled Service

Gold’s Next Move After False Headlines & Liquidity sweepXAUUSD 17/07 – MMF Insights: Gold’s Next Move After False Headlines & Liquidity Sweep
🧭 Market Sentiment: Macro Distractions Fuel Uncertainty
The gold market remains under pressure as conflicting geopolitical news and central bank rumors stir volatility. The week opened with rumors that Donald Trump might fire Fed Chair Jerome Powell, sending temporary fear across markets. While Trump later denied the claim, the damage was already done – sentiment remains fragile.
Other active drivers:
Israel’s airstrikes in Syria increase global tension.
EU proposes tariffs on US imports, adding trade friction.
BlackRock warns of delayed inflation pressure as tariffs begin impacting electronics & consumer goods.
💡 All these elements support gold’s potential role as a hedge, but technical signals suggest the market remains undecided.
🔍 MMF Technical Flow Outlook
According to MMF analysis, price structure is unfolding in line with expected liquidity sweeps and order block reactions:
Price rejected from key supply zones near 3,342 – 3,344 (OB + CP structure).
Current bounce around 3,330 – 3,320 signals possible accumulation.
If buyers hold above 3,310, we may see price test the upper OB/VPOC zones again.
Break below 3,310 opens the door toward the MMF liquidity trap zone at 3,296 – 3,294.
🎯 Trade Plan – Precision Entries
🟩 Buy Zone
Entry: 3,312 – 3,310
Stop Loss: 3,306
Take Profits:
→ 3,316 → 3,320 → 3,324 → 3,328 → 3,335 → 3,340 → 3,350
✅ This zone aligns with MMF liquidity retention and H1 continuation structure. Watch for bullish confirmation candles before entry.
🟥 Sell Zone
Entry: 3,362 – 3,364
Stop Loss: 3,368
Take Profits:
→ 3,358 → 3,354 → 3,350 → 3,345 → 3,340
⚠️ Ideal for short-term scalping or reversal confirmation setups. Rejection at VPOC or CP structure validates this zone.
⚠️ Key Notes for Indian Traders
Today’s sentiment is fragile and can shift fast with any unexpected statement from US Fed or geopolitical update.
Apply MMF structure in lower timeframes (M15/H1) for cleaner confirmation.
Avoid early entries. Wait for reaction signals near the marked zones.
💬 What Do You See Ahead?
Will MMF signals lead the market toward the deep FVG zone around 3,296?
Or are bulls getting ready to reclaim 3,360+ zones?
👇 Share your view and let’s trade smarter together with MMF precision.

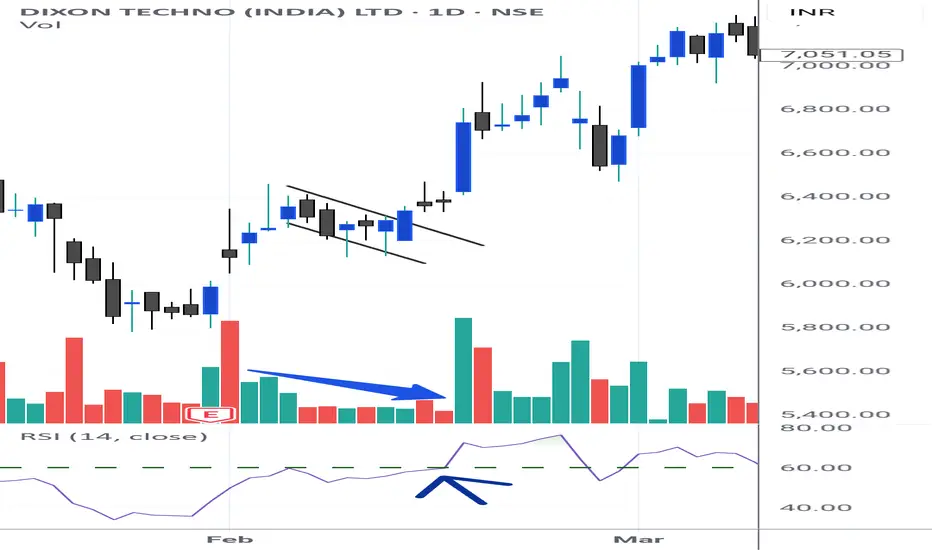
Triangle formationThangamayil Jewellers – Glistening with Opportunity
The overall sentiment in the jewellery sector has turned positive, supported by strong fundamentals and global tailwinds.
Gold and silver prices are on a consistent uptrend, hitting new highs almost daily, driven by both safe-haven demand and global metal rallies.
Thangamayil Jewellers, a Tamil Nadu-based company, has established a strong presence among the middle class, with steady growth in both sales and revenue.
Technically, the stock shows a clear bullish triangle formation on the monthly chart, while also exhibiting low-price accumulation patterns on the daily timeframe.
This setup offers a compelling combination of fundamental strength and technical breakout potential, making it a stock to watch closely in the current metals rally.

undevalued muftiTrend Reversal - #MUFTI (Credo Brands)
🔹CMP: ₹169
🔹Supports: ₹160 / ₹155
🔹Bullish Signs:
• Trend reversal
• Golden crossover
• Above all major EMAs
• Strong quarterly results
• PE at 16 – undervalued!
💡 Fair PE ~35 → Fair Price = ₹370+
📈 Value + Momentum = Potential Re-rating!

Swing Trading - Pullback and Volume contraction setup - PROA pullback entry with volume contraction is a powerful setup used by swing traders and position traders to enter strong trends at low-risk points. Here's how you can identify and trade this setup:
✅ Concept:
• A pullback is a temporary decline in price within an established uptrend.
• Volume contraction during this pullback shows reduced selling pressure, indicating that the correction is healthy and likely to resume upward.
📊 Technical Setup:
1. Trend Filter
• Uptrend confirmation using:
• Monthly RSI > 60
• Weekly RSI > 60
• 50 EMA above 200 EMA on Daily chart (optional confirmation)
2. Price Action
• Stock is making higher highs and higher lows
• After a sharp rally, price pulls back 3–5 candles on the Daily chart
• Pullback should be orderly (no panic selling or wide candles)
3. Volume Contraction
• Volume decreases gradually during the pullback
• Look for lowest volume near the end of the pullback
• Indicates sellers are drying up and big players are not exiting
4. Entry Trigger
• Entry when price breaks above previous day's high with:
• Spike in volume on breakout
• Optional: bullish candlestick (Marubozu, Bullish Engulfing, or Hammer)
5. Stop Loss
• Just below the pullback low or
• Below the 10 EMA on daily chart
6. Target
• First target = previous swing high
• Trail SL using ATR or 20 EMA if trend extends
📘 Example:
Let’s say you’re watching Tata Motors:
• Monthly RSI = 68
• Weekly RSI = 65
• Daily chart: Stock rallied from ₹800 to ₹860, then pulls back to ₹840 with 3 red candles
• Volume during pullback: 12M → 10M → 7M → 5M
• On Day 4, price forms a bullish hammer and breaks ₹845 on higher volume
📈 Entry = ₹845
🛑 Stop Loss = ₹835
🎯 Target = ₹865+ (prior high), trail after that
🔍 Bonus Filters (Optional):
• Inside bar formation
• Fibonacci retracement (38.2%–50% zone)
• Near support from moving averages (20 EMA / 50 EMA)
Check my previous post in understanding full concept in detail. Support and follow for PRO level understanding. Share with as many retail traders as possible.
God Bless you All!
Faraaz T
Sr. Equity Research Analyst
Stockholm Securities - UK
Stovekraft can it resume it's uptrend?Stovekraft – Growth-Focused Kitchen Appliance Play
Stovekraft is an aggressive kitchen appliances player with a solid 5/10-year sales CAGR of 17%/16% (organic). Its non-core portfolio (excluding cookers, cooktops, etc.) grew 38% in FY25 to ₹602 Cr (vs ₹342 Cr in FY22), now contributing ~42% of revenue.
The company has scaled EBOs 5x in 2 years (52 → 262), leading to higher lease liabilities and depressed reported PAT (FY24 ₹35 Cr, FY25 ₹38 Cr) due to upfront depreciation and interest costs. However, adj. OCFs remain strong (FY24 ₹103 Cr, FY25 ₹105 Cr), implying healthy cash generation (~19x OCF).
At ₹1950 Cr market cap (~1.3x trailing P/S), valuation looks attractive considering:
95% in-house manufacturing with aggressive pricing strategy
-Scope for price hikes without major churn
-IKEA cookware export deal starting 2026 via dedicated plant
-Export push can drive ~25% revenue in 3 years
-Sufficient capacity to double sales without major capex
Disclosure - Invested and biased.

EIHA (hotel space looks promising) buyBreakout might fail for one more time but poised to go up eventually. Enter with 5% stoploss, supertrend and moving average are around same price.
PE of this hotel stock is quite reasonable for outperforming growth.
Target - 15% and trailing, for next quarter

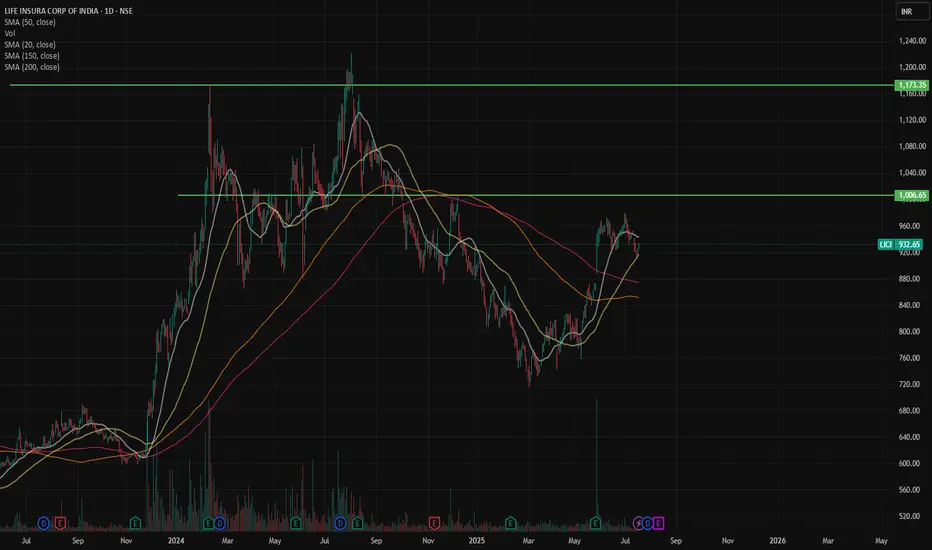
Cup with handle pattern.Eight months cup with handle is forming.
Best buy when stock crosses 1000 with higher volume than usual.
As company has good fundamentals and quarterly results may help stock got to higher highs.
Target 1 - 1170
Target 2 - 1300
Target 2 3- 1500.