Hindalco: Strong Recovery Powers Fresh Uptrend🔍 Technical Analysis
Hindalco Industries created its all-time high at ₹772 by October 2024, establishing a significant resistance level. From this peak, the stock experienced a sharp correction falling to ₹550 levels, representing a substantial 29% decline from the highs.
The turnaround moment came with positive FY25 results that sparked renewed investor interest. The stock has since recovered strongly and is now trading at ₹695, marking a solid 26% bounce from the ₹550 lows.
The current price action suggests the stock is attempting to reclaim higher levels with momentum building up. Key resistance lies around the ₹710 zone, which needs to be decisively crossed for further upside.
Entry Strategy: Wait for confirmation above ₹710 level before initiating positions.
Targets:
🎯 Target 1: ₹730
🎯 Target 2: ₹750
🎯 Target 3: ₹770
Stop Losses:
🚫 Major Stop: ₹650 (below current support zone)
If the stock trades below ₹710, no more expectations on this stock.
💰 Q1 FY26 Financial Highlights (vs Q4 FY25 & Q1 FY25)
Total Income: ₹64,232 Cr (↓ -1% QoQ from ₹64,890 Cr; ↑ +13% YoY from ₹57,013 Cr)
Total Expenses: ₹56,326 Cr (↑ +0% QoQ from ₹56,054 Cr; ↑ +14% YoY from ₹49,510 Cr)
Operating Profit: ₹7,906 Cr (↓ -11% QoQ from ₹8,836 Cr; ↑ +5% YoY from ₹7,503 Cr)
Profit Before Tax: ₹5,676 Cr (↓ -13% QoQ from ₹6,550 Cr; ↑ +17% YoY from ₹4,848 Cr)
Profit After Tax: ₹4,004 Cr (↓ -24% QoQ from ₹5,284 Cr; ↑ +30% YoY from ₹3,074 Cr)
Diluted EPS: ₹17.82 (↓ -24% QoQ from ₹23.51; ↑ +30% YoY from ₹13.68)
🧠 Fundamental Highlights
Hindalco sustained growth momentum in Q1 FY26 with consolidated PAT surging 30% YoY to ₹4,004 crore, driven by robust aluminum operations in India. The stock surged 6% post Q1 results with Axis Securities retaining 'Buy' rating.
India Aluminium Upstream business delivered standout performance with EBITDA at ₹4,080 crore (up 17% YoY) and industry-best margins of 44%. Aluminium Downstream achieved record quarterly EBITDA of ₹229 crore, surging 108% YoY demonstrating operational excellence.
Market cap stands at ₹1,56,238 crore (up 9.6% in 1 year) with promoter holding at 34.6%. The stock climbed 29% from its 52-week low of ₹546.25, showing strong recovery momentum. Shares rose over 10% in the past six months.
Revenue climbed 13% to ₹64,232 crore while consolidated EBITDA rose 9% to ₹8,673 crore. Combined upstream and downstream aluminium operations contributed ₹4,241 crore in total aluminium EBITDA, maintaining significant share of overall earnings.
Management expects sustained demand growth for aluminium and copper in India driven by surging infrastructure and housing sector requirements. Strong expansion pipeline including Aditya FRP project positions company for future growth.
✅ Conclusion
Hindalco's strong 30% YoY PAT growth and 26% recovery from ₹550 lows demonstrates resilient business fundamentals. The industry-leading 44% upstream margins and record downstream EBITDA growth of 108% validate operational excellence. Technical setup requires breakout above ₹710 for sustained uptrend toward ₹770 all-time high retest. Critical support at ₹650 must hold for bullish continuation.
Fundamental Analysis

HBL Engineering: Q1 Surge Powers Resistance Breakout🔍 Technical Analysis
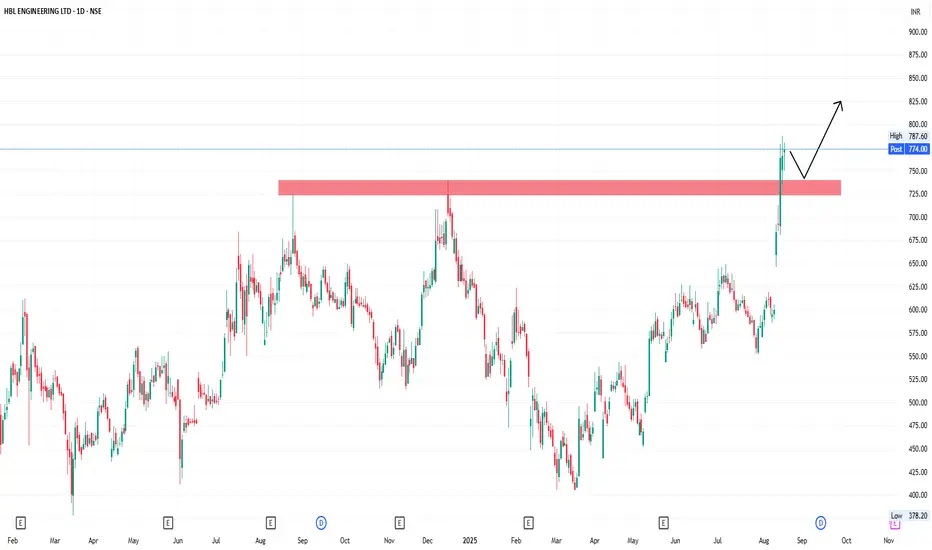
HBL Engineering has showcased remarkable technical progression over the past 2+ years. The stock crossed ₹100 levels in June 2022 and embarked on an extraordinary journey, surging directly to ₹724 by August 2024 - representing a phenomenal 7.2x growth in just over 2 years.
The ₹724 all-time high level acted as formidable resistance multiple times, causing the stock to correct sharply to ₹400 levels. However, the game-changing moment arrived with the announcement of massive strong Q1 FY26 results, which triggered a powerful breakout.
The stock shot up decisively, breaking above the stubborn ₹724 resistance level and is now trading at ₹765. With bullish candlestick patterns emerging and the previous resistance potentially acting as new support, the technical setup appears highly favorable.
Entry Strategy: Enter on any dips toward ₹724-₹740 range, ensuring the old resistance holds as new support.
Targets:
🎯 Target 1: ₹800
🎯 Target 2: ₹850
🎯 Target 3: ₹900
Stop Losses:
🚫 Critical Stop: ₹724 (previous resistance, now key support)
If ₹724 resistance doesn't sustain as support, no more expectations on this stock.
💰 Q1 FY26 Financial Highlights (vs Q4 FY25 & Q1 FY25)
Total Income: ₹602 Cr (↑ +26% QoQ from ₹476 Cr; ↑ +16% YoY from ₹520 Cr)
Total Expenses: ₹410 Cr (↑ +4% QoQ from ₹396 Cr; ↑ +0% YoY from ₹410 Cr)
Operating Profit: ₹192 Cr (↑ +143% QoQ from ₹79 Cr; ↑ +75% YoY from ₹110 Cr)
Profit Before Tax: ₹191 Cr (↑ +169% QoQ from ₹71 Cr; ↑ +85% YoY from ₹103 Cr)
Profit After Tax: ₹143 Cr (↑ +218% QoQ from ₹45 Cr; ↑ +79% YoY from ₹80 Cr)
Diluted EPS: ₹5.17 (↑ +219% QoQ from ₹1.62; ↑ +79% YoY from ₹2.89)
🧠 Fundamental Highlights
HBL Engineering delivered record-breaking Q1 FY26 performance with PAT surging an exceptional 218% QoQ and 79% YoY to ₹143 crore, driven by strong Electronics division growth. The company posted record Q1 profits triggering a 14% stock price surge.
Market cap stands at ₹21,223 crore (up 19.8% in 1 year) with stable promoter holding of 59.1%. Annual revenue of ₹2,049 crore with profit of ₹340 crore demonstrates consistent business growth. Stock trades at 14.3 times book value indicating reasonable valuation.
The Electronics division has emerged as a key growth driver, contributing significantly to the exceptional quarterly performance. Company's mission-critical electronics systems and solutions business is well-positioned for sustained growth.
Operating profit margins expanded dramatically from 21% in Q1 FY25 to 32% in Q1 FY26, showcasing superior operational efficiency. The company gained 67% from March lows, indicating strong recovery momentum.
Cost management excellence reflected in flat expense growth while revenue surged 26% QoQ, demonstrating operational leverage benefits. Strong balance sheet fundamentals support the technical breakout thesis.
✅ Conclusion
HBL Engineering's spectacular 218% QoQ PAT surge and successful breakout above ₹724 resistance creates a compelling technical and fundamental convergence. The record Q1 profits triggering 14% stock surge validates the breakout momentum. With Electronics division growth driving performance and strong operational leverage, the stock appears well-positioned for the ₹900 target zone. Critical support at ₹724 must hold for sustained bullish trajectory.
Alkem Labs: Recovery from Demand Zone Powers New Rally🔍 Technical Analysis
Alkem Laboratories has demonstrated a remarkable 10-year growth trajectory, steadily climbing from ₹1,100 levels to reach an all-time high of ₹6,440 by September 2024. This represented an exceptional 5.8x growth over the decade.
Post the peak, the stock witnessed a sharp correction falling to ₹4,500 levels - a critical juncture that proved to be a strong demand zone. The ₹4,500 level acted as robust support, triggering an immediate bounce back following the announcement of super positive Q1 FY26 results.
Currently trading at ₹5,300, the stock has recovered strongly from the demand zone, representing a 17.8% bounce from the lows. This technical recovery is now backed by fundamental strength.
Entry Strategy: Enter on any dips toward ₹5,000-₹5,200 range with strict adherence to the ₹4,500 support level.
Targets:
🎯 Target 1: ₹5,800
🎯 Target 2: ₹6,200
🎯 Target 3: ₹6,500
Stop Losses:
🚫 Critical Stop: ₹4,500 (strong demand zone)
Breach of ₹4,500 level would completely invalidate the bullish thesis and signal no further expectations on this stock.
💰 Q1 FY26 Financial Highlights (vs Q4 FY25 & Q1 FY25)
Total Income: ₹3,371 Cr (↑ +7% QoQ from ₹3,144 Cr; ↑ +11% YoY from ₹3,032 Cr)
Total Expenses: ₹2,632 Cr (↓ -4% QoQ from ₹2,752 Cr; ↑ +9% YoY from ₹2,423 Cr)
Operating Profit: ₹739 Cr (↑ +89% QoQ from ₹391 Cr; ↑ +21% YoY from ₹609 Cr)
Profit Before Tax: ₹771 Cr (↑ +95% QoQ from ₹396 Cr; ↑ +25% YoY from ₹619 Cr)
Profit After Tax: ₹668 Cr (↑ +107% QoQ from ₹322 Cr; ↑ +21% YoY from ₹550 Cr)
Diluted EPS: ₹55.56 (↑ +117% QoQ from ₹25.58; ↑ +22% YoY from ₹45.60)
🧠 Fundamental Highlights
Alkem Labs delivered exceptional Q1 FY26 performance with consolidated net profit surging 107% QoQ and 21.45% YoY to ₹668 crore, demonstrating remarkable operational recovery. Revenue growth of 11.2% YoY to ₹3,371 crore reflects strong business momentum across segments.
The company is India's fifth-largest pharmaceutical company with market cap of ₹63,937 crore and promoter holding of 53.0%. Post-results announcement, the stock jumped 7.5% reflecting market confidence in the turnaround story.
EBITDA growth of 21% YoY showcases improved operational efficiency and margin expansion. The company maintains FY26 guidance and expects India business to outpace IPM growth by 100-150 basis points, indicating sustained market share gains.
Strategic expansion plans include incorporating a subsidiary in international markets, positioning for global growth opportunities. Analyst target price of ₹5,700 supports the technical target zone, with forecast models projecting potential upside to ₹6,207 levels.
Management remains optimistic about sustained growth trajectory driven by strong domestic performance and strategic initiatives in key therapeutic segments.
✅ Conclusion
Alkem Labs' spectacular 107% QoQ PAT recovery from the ₹4,500 demand zone, combined with 21% YoY growth and strong operational metrics, validates the technical bounce-back thesis. The current trading level of ₹5,300 offers attractive entry for targeting ₹6,500 levels. Critical support at ₹4,500 must hold for continued bullish momentum. The convergence of technical recovery and fundamental turnaround makes this a compelling pharma sector play.

BUY TODAY SELL TOMORROW for 5%DON’T HAVE TIME TO MANAGE YOUR TRADES?
- Take BTST trades at 3:25 pm every day
- Try to exit by taking 4-7% profit of each trade
- SL can also be maintained as closing below the low of the breakout candle
Now, why do I prefer BTST over swing trades? The primary reason is that I have observed that 90% of the stocks give most of the movement in just 1-2 days and the rest of the time they either consolidate or fall
Trendline Breakout in JSLL
BUY TODAY SELL TOMORROW for 5%
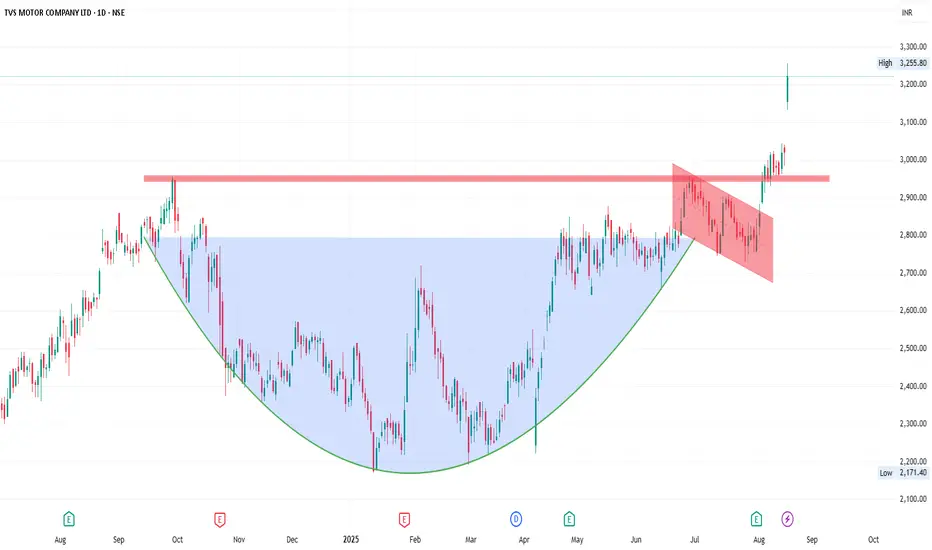
TVS Motor: Breakout Beyond All-Time Highs Signals Fresh Rally🔍 Technical Analysis
TVS Motor has delivered an extraordinary multi-decade performance journey. From trading around ₹250 during COVID-2020, the stock staged a phenomenal super bullish rally reaching ₹2,958 by September 2024 - its previous all-time high that acted as strong resistance.
Post this peak, the stock corrected to ₹2,200 levels before making another attempt at the resistance zone. The crucial breakout moment came with strong Q1 FY26 results showing significant YoY net profit growth, propelling the stock above ₹2,958 resistance and currently trading at ₹3,020.
Entry Strategy: Only enter on confirmed breakout sustainability above ₹2,958 (previous resistance now support).
Targets 🎯:
🎯 Target 1: ₹3,100
🎯 Target 2: ₹3,200
🎯 Target 3: ₹3,300
Stop Losses:
Minor Stop: ₹2,958 (previous resistance, now key support)
Major Stop: ₹2,700-₹2,800 (strong demand zone)
Breach of ₹2,700 zone would completely invalidate the bullish thesis and signal no further expectations.
💰 Q1 FY26 Financial Highlights (vs Q4 FY25 & Q1 FY25)
Total Income: ₹12,210 Cr (↑ +6% QoQ from ₹11,542 Cr; ↑ +18% YoY from ₹10,314 Cr)
Total Expenses: ₹10,407 Cr (↑ +8% QoQ from ₹9,638 Cr; ↑ +17% YoY from ₹8,884 Cr)
Operating Profit: ₹1,803 Cr (↓ -5% QoQ from ₹1,904 Cr; ↑ +26% YoY from ₹1,431 Cr)
Profit Before Tax: ₹977 Cr (↓ -3% QoQ from ₹1,004 Cr; ↑ +32% YoY from ₹738 Cr)
Profit After Tax: ₹643 Cr (↓ -8% QoQ from ₹698 Cr; ↑ +33% YoY from ₹485 Cr)
Diluted EPS: ₹12.84 (↓ -6% QoQ from ₹13.64; ↑ +32% YoY from ₹9.70)
🧠 Fundamental Highlights
TVS Motor crossed the historic ₹10,000 crore revenue milestone in Q1 FY26 with 20% YoY growth, achieving highest-ever EBITDA, PBT, and sales volumes. Consolidated net profit surged 35% YoY to ₹643 crore despite sequential dip from Q4.
Company benefited from strong exports surge, EV sales growth of 35%, premium bikes performance, and finance segment expansion. Strategic initiative to reduce China dependence while expanding global footprint positions TVS favorably for sustainable growth.
Market cap stands at ₹1,43,491 crore (up 16.2% in 1 year) with promoter holding stable at 50.3%. Current trading levels around ₹3,018 with recent high of ₹3,049.7 confirm the technical breakout above historical resistance.
The electric scooter segment showing 35% volume growth demonstrates company's successful transition strategy. Finance business and premium motorcycle segments providing additional revenue diversification.
✅ Conclusion
TVS Motor's breakout above ₹2,958 all-time high resistance, backed by record Q1 revenue crossing ₹10,000 crore and 33% YoY PAT growth, signals the start of a fresh multi-year rally. The 2+ decade resistance break with strong fundamental support makes this a compelling long-term investment opportunity targeting ₹3,300+ levels. Key is sustaining above ₹2,958 support zone.
SUDARSHAN, ALL TIME HIGH BREAKOUTBuy Sudarshan chemical 830 till 770 for 890/965 and 1050 in short to medium term. Invalid below 725 on weekly closing basis. All time high breakout happening in the sector which is mostly the laggard sector. Their chemical is in big demand after closure of many global plants.

SML ISUZU, A PERFECT BUYBUY SML ISUZU 1080, till 950 for 1180,1300 and 1620. Weekly charts suggesting perfect rounding structure heading towards its previous all time highs. Volume data after strong results suggesting good trading and investment returns for taken. Invalid below 920 on weekly closing basis.

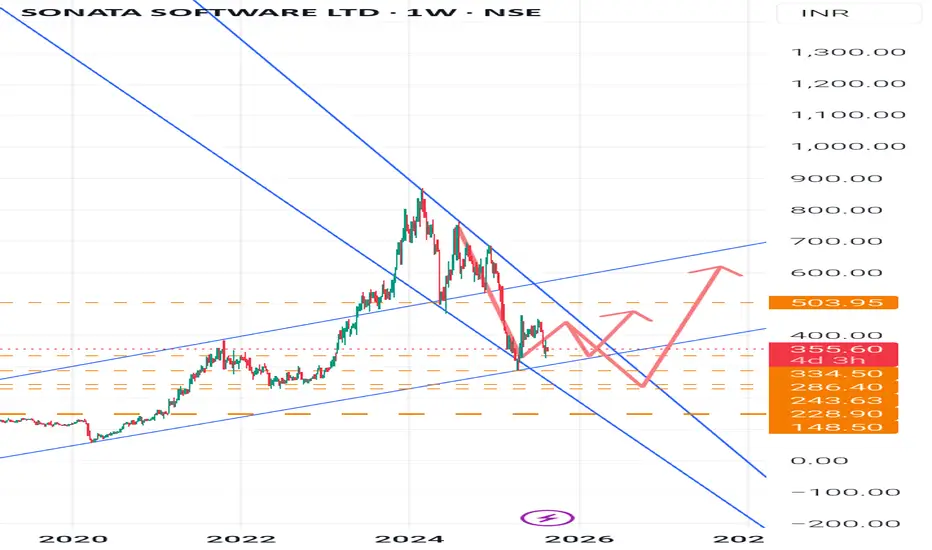
Sonata Software Ltd- Trend and chart pattern analysisSonata Software Ltd-
technical + fundamental analysis based on chart and industry outlook 👇
Technical Chart Analysis (Weekly Chart)
Current Price: 356.40
Trend: The stock had a steep rally till 1,200 and then corrected sharply into a downtrend channel. Now it is stabilizing and attempting a base formation.
- Support Levels
334 - immediate support
286 - strong support zone
243 - medium-term support
228 - long-term crucial base
148 - major bottom support
- Resistance Levels
400 - near-term hurdle
503 - key weekly resistance (breakout confirmation if crossed)
600 - medium-term target if trend sustains
700+ - only after strong momentum breakout
- Chart Pattern
Stock is currently consolidating between 330-400.
Possible formation of a W-bottom / double bottom, if 330-334 holds.
A sustained move above 503 could trigger a trend reversal rally toward 600-700.
If it breaks below 286, weakness may extend to 243/228 zone.
🏢 Business & Competition
Sonata Software operates in IT services, cloud, and digital transformation. It earns revenues from export-oriented IT services, particularly in Microsoft ecosystem solutions.
- Key Competitors
Mid-cap IT peers: Mphasis, L&T Technology, Persistent Systems, Coforge, Birlasoft, Mindtree (merged into LTIMindtree).
Sonata is relatively smaller in scale compared to peers but has a niche in Microsoft Dynamics 365 solutions.
📈 Fundamental Ratios (Latest available FY24 data)
Market Cap: 9,500 Cr
P/E Ratio: 27 (mid-cap IT avg. 30-35) - slightly undervalued compared to peers
ROE (Return on Equity): 25% - very strong
ROCE (Return on Capital Employed): 30% - efficient capital use
Debt-to-Equity: 0.05 - virtually debt-free
Dividend Yield: 1.5% - decent payout for investors
Revenue Growth (3Y CAGR): 15-18%
EPS Growth (3Y CAGR): 20%
👍 Investment View
Technicals: Base building in progress. Sustaining above the 400-503 zone is crucial for the next uptrend.
Fundamentals: Strong ROE/ROCE, debt-free, consistent dividend payer. Attractive in mid-cap IT basket.
Risks: Global IT slowdown, client concentration risk, strong USD-INR dependency.
👉Disclaimer
This analysis is for educational & informational purposes only.
It is not financial advice or a buy/sell recommendation.
Stock markets are subject to risks - please consult your financial advisor before making any investment decisions.
#sonatasoftware #trendanalysis #chartpattern
Psychology of Trading in the AI EraIntroduction
Trading has always been a game of numbers, patterns, and probabilities—but at its heart, it has always been a game of human psychology. From the floor traders of the 1980s to the retail traders of today clicking buy and sell on their mobile apps, emotions like fear, greed, hope, and regret have consistently shaped market behavior.
However, we are now living in an era where artificial intelligence (AI) is no longer just an experimental tool but a daily companion in the trading world. Advanced algorithms, neural networks, sentiment analysis engines, and automated bots can scan millions of data points, process global news in milliseconds, and predict price movements with uncanny accuracy.
This raises critical questions:
How does the presence of AI change human trading psychology?
Do traders still rely on instincts, or are they surrendering to machines?
What emotional challenges arise when humans compete against algorithms?
In this essay, we will explore these dimensions in depth, examining how trading psychology is being reshaped by AI, what new biases are emerging, and how traders can adapt their mindset to thrive in this new era.
1. The Foundations of Trading Psychology
Before diving into AI’s impact, let us revisit the basics of trading psychology. Historically, traders have always battled with three core emotions:
Fear – The fear of losing money, missing out on opportunities (FOMO), or getting left behind.
Greed – The desire for outsized gains, which often pushes traders to take irrational risks.
Hope & Regret – Holding onto losing trades out of hope they’ll recover, or regretting missed opportunities.
These emotions create well-known cognitive biases:
Confirmation bias (seeking data that supports an existing view).
Overconfidence bias (believing one’s strategy is infallible).
Loss aversion (feeling losses more intensely than equivalent gains).
Herd mentality (following what the majority is doing).
The battle against these psychological forces defined much of traditional trading education: building discipline, sticking to rules, and detaching emotionally.
2. How AI is Changing the Trading Landscape
With AI, trading is no longer just human versus human—it’s human versus machine or sometimes human alongside machine. Some key shifts AI has introduced include:
Algorithmic trading: High-frequency trading (HFT) algorithms execute thousands of trades in microseconds, leaving humans behind in speed and efficiency.
AI-powered analysis: Machine learning models now forecast trends using complex data like satellite imagery, social media sentiment, or even weather patterns.
Robo-advisors & bots: Retail traders use AI-driven bots to automate their strategies, removing much of the manual decision-making.
Predictive analytics: Platforms suggest when to enter or exit trades, almost acting as "psychological crutches" for traders.
This technological revolution is not just changing markets—it’s fundamentally altering the psychological environment of trading.
3. New Psychological Challenges in the AI Era
a) The “Human vs. Machine” Anxiety
Traders often feel they are competing against soulless algorithms that can predict moves faster than they can blink. This creates a psychological inferiority complex, leading some to second-guess their strategies, abandon intuition, or feel powerless.
b) Over-Reliance on AI
Paradoxically, some traders swing to the opposite extreme: they blindly trust AI recommendations. This leads to automation bias, where traders follow machine-generated signals without applying critical thinking. When the AI is wrong, it can result in catastrophic losses.
c) Information Overload
AI tools generate massive amounts of insights—charts, predictions, probability scores. Traders often become overwhelmed by data, leading to analysis paralysis, where fear of making the wrong choice prevents timely action.
d) Emotional Detachment vs. Overconfidence
On one hand, automation can help remove emotions from decision-making. On the other, traders may become overconfident, believing that access to AI gives them a guaranteed edge, only to be humbled by market uncertainty.
e) Fear of Missing Out (FOMO) on Tech
Many traders worry: “If I’m not using AI, I’ll be left behind.” This tech-driven FOMO fuels constant subscription purchases of new tools, often without mastering them.
4. The Double-Edged Sword of AI in Trading Psychology
AI is neither a pure blessing nor a curse—it’s a double-edged sword.
Benefits for Trading Psychology:
Reduced emotional bias: Automated execution can prevent impulsive trades.
Increased discipline: AI-enforced rules help traders stick to strategies.
Faster learning: AI backtesting and simulations accelerate experience-gathering.
Confidence boost: Access to predictive models reduces uncertainty.
Risks for Trading Psychology:
Dependency risk: Traders may lose the ability to make independent decisions.
Blame-shifting: Traders might avoid responsibility, blaming AI for losses.
Skill erosion: Over time, traders may neglect learning fundamentals.
Complacency: Believing AI always wins can dull risk management instincts.
Thus, AI reshapes psychology in both empowering and weakening ways, depending on how it is used.
5. Case Studies: Psychological Shifts in AI Trading
Case 1: Retail Trader with AI Bots
A beginner trader using a pre-built AI bot on their brokerage platform may feel confident and relaxed—until the bot hits a losing streak. At that point, panic sets in, and the trader either over-tweaks the system or abandons it entirely, exposing their underlying lack of psychological resilience.
Case 2: Professional Trader in AI-Dominated Markets
Institutional traders face the constant stress of competing with AI-powered hedge funds. This creates performance pressure, leading to burnout and decision fatigue, even when the trader’s strategy is fundamentally sound.
Case 3: Hybrid Human-AI Collaboration
Some traders use AI purely for signal generation but maintain human discretion for execution. This balance tends to foster psychological confidence, as traders feel supported but not fully dependent on AI.
6. Emerging Cognitive Biases in the AI Era
Beyond traditional biases, new AI-driven psychological traps are emerging:
Automation bias – Blind trust in AI recommendations.
Algorithm aversion – Distrust of AI after seeing a single failure.
Techno-FOMO – Constantly chasing the latest AI tool.
Data illusion – Believing more data = better decisions, even if irrelevant.
Delegated responsibility bias – Blaming AI instead of accepting accountability.
Traders must recognize these new biases to navigate the modern environment effectively.
7. Building a Healthy Trading Psychology in the AI Era
a) Use AI as a Tool, Not a Master
AI should augment, not replace, human judgment. Think of it as a co-pilot, not the pilot.
b) Maintain Emotional Awareness
Even with automation, emotions still influence decision-making (e.g., when to override AI, when to switch tools). Traders must practice mindfulness, journaling, or stress-management techniques.
c) Focus on Process, Not Just Outcomes
AI can make mistakes. Traders who anchor their psychology on process discipline (risk management, journaling, position sizing) rather than profits remain more stable.
d) Embrace Continuous Learning
Instead of blindly trusting AI, traders should understand at least the basics of how their tools work. Knowledge reduces both overconfidence and fear of failure.
e) Develop “AI Literacy”
The psychological edge in the AI era comes from understanding both the strengths and weaknesses of AI models, such as overfitting, reliance on historical data, and vulnerability to black swan events.
8. The Future: Psychology of AI-Integrated Markets
As AI continues to evolve, the psychology of trading will move in three directions:
Greater Human-AI Synergy – Traders who adapt psychologically to work with AI, not against it, will thrive.
New Emotional Battles – Future challenges may include fear of AI dominance, distrust after algorithmic crashes, and identity crises for human traders.
Shift in Market Behavior – If most trades are AI-driven, human psychology may play out more in meta-layers (how humans react to AI-driven moves, rather than direct price action).
Conclusion
The psychology of trading in the AI era is not about eliminating human emotions—it is about redefining the relationship between human psychology and machine intelligence.
AI is a powerful ally that can reduce emotional mistakes, enforce discipline, and accelerate learning. Yet it also introduces new psychological challenges: dependency, overconfidence, data overload, and fear of irrelevance.
Ultimately, successful traders in the AI era will be those who cultivate self-awareness, emotional discipline, and AI literacy, striking the right balance between human intuition and machine precision.
Trading has always been 80% psychology and 20% strategy. In the AI era, that ratio still holds true—only now, the psychology involves not just markets, but our relationship with intelligent machines.

Sustainability & ESG Investing TrendsIntroduction
Over the past two decades, the financial world has experienced a massive transformation in how investments are analyzed, structured, and valued. Traditional investment strategies focused almost exclusively on financial metrics such as revenue growth, earnings per share, P/E ratios, and cash flows. But today, a new dimension has been added: Sustainability and ESG (Environmental, Social, and Governance) investing.
Investors, institutions, governments, and even retail traders are no longer looking at financial returns in isolation. They are increasingly asking:
Is this company environmentally responsible?
How does it treat its employees and communities?
Are its governance practices transparent and ethical?
This movement is more than just a trend—it represents a structural shift in how capital is allocated globally. Sustainability and ESG investing is about aligning profits with purpose. It’s about creating wealth while ensuring that companies contribute positively to society and the planet.
In this article, we’ll explore the evolution, importance, drivers, challenges, and future of sustainability & ESG investing trends, breaking it down in an easy-to-understand and comprehensive way.
1. Understanding Sustainability & ESG
What is Sustainability Investing?
Sustainability investing refers to investment strategies that prioritize companies or assets contributing to long-term environmental and social well-being. Instead of short-term financial gains, the focus is on sustainable value creation.
What is ESG Investing?
ESG stands for:
Environmental – How a company manages its environmental impact (climate change, carbon footprint, renewable energy use, waste management).
Social – How a company treats people (employees, customers, communities, human rights).
Governance – How a company is managed (board structure, executive pay, transparency, shareholder rights).
An ESG-focused investor doesn’t just look at profit margins—they also ask: Is this company ethical? Is it sustainable in the long run?
Why ESG Matters
Climate change is now a financial risk.
Consumers prefer sustainable brands.
Regulators demand transparency.
Younger investors want purpose-driven investments.
2. Evolution of ESG & Sustainability Investing
Early Stage (1960s–1980s)
The origins can be traced back to socially responsible investing (SRI), where investors avoided “sin stocks” (alcohol, tobacco, gambling, weapons).
Religious and ethical considerations played a big role.
Growth Stage (1990s–2000s)
The 1990s saw globalization and rising awareness about corporate social responsibility.
Companies began publishing sustainability reports.
The UN launched initiatives like the Principles for Responsible Investment (PRI) in 2006.
Modern Stage (2010s–2020s)
Climate change, global warming, and social justice movements accelerated ESG awareness.
The Paris Climate Agreement (2015) reinforced global commitments to sustainability.
ESG assets under management (AUM) skyrocketed to $40+ trillion globally by 2025.
3. Key Drivers of ESG & Sustainability Investing
Climate Risks – Extreme weather, rising sea levels, and resource scarcity directly affect business operations and valuations.
Consumer Preferences – Millennials and Gen Z prefer eco-friendly and socially conscious brands.
Regulations & Policies – Governments mandate disclosures (EU’s SFDR, India’s BRSR, SEC proposals in the US).
Capital Flows – Global funds and pension plans increasingly allocate capital based on ESG scores.
Corporate Reputation – Companies with poor ESG practices face backlash, loss of trust, and higher costs.
4. Global ESG Investment Trends
Trend 1: Surge in ESG Assets
As of 2025, global ESG assets are projected to cross $50 trillion, representing nearly a third of total AUM worldwide.
Europe leads the charge, followed by North America and Asia.
Trend 2: Renewable Energy Boom
Solar, wind, and green hydrogen projects attract heavy investments.
Fossil fuel divestment is accelerating.
Trend 3: ESG ETFs & Index Funds
ESG-focused exchange-traded funds (ETFs) have exploded in popularity.
Major indices like the MSCI ESG Leaders Index guide institutional investors.
Trend 4: Technology & ESG Data
AI, blockchain, and big data help assess ESG scores more transparently.
ESG rating agencies (MSCI, Sustainalytics, Refinitiv) play a growing role.
Trend 5: Green Bonds & Sustainable Financing
Green bonds (funds raised for eco-projects) have surpassed $2 trillion issuance globally.
Social bonds and sustainability-linked loans are also gaining traction.
5. ESG in India: The Emerging Market Story
India, as one of the fastest-growing economies, is experiencing its own ESG wave.
Regulation: SEBI (Securities and Exchange Board of India) has mandated the Business Responsibility and Sustainability Report (BRSR) for top listed companies.
Investor Demand: Indian mutual funds are launching ESG-focused schemes.
Corporate Adoption: Firms like Infosys, Tata, and Wipro are global ESG leaders.
Green Finance: India issued its first sovereign green bonds in 2023.
Challenges in India:
Lack of standardized ESG reporting.
Limited awareness among retail investors.
Trade-off between growth and sustainability in a developing economy.
6. Sectoral ESG Trends
1. Energy
Fossil fuels are being replaced with renewables.
Oil & gas companies are investing in carbon capture.
2. Technology
Big tech faces scrutiny on data privacy and energy usage in data centers.
Tech firms lead in transparency reporting.
3. Banking & Finance
Banks integrate ESG into lending decisions.
Green finance and ESG loans are rising.
4. Healthcare & Pharma
Focus on ethical drug pricing, access to healthcare, and sustainable production.
5. Manufacturing
Supply chain sustainability is a big issue.
ESG compliance is crucial for exports.
7. Benefits of ESG Investing
Risk Management – ESG factors identify hidden risks (climate lawsuits, governance failures).
Long-Term Returns – ESG-compliant firms often outperform peers over the long run.
Investor Confidence – Transparency builds trust with stakeholders.
Competitive Advantage – Sustainable firms attract better talent and customers.
Global Alignment – Aligns with SDGs (UN Sustainable Development Goals).
8. Challenges in ESG Investing
Greenwashing – Companies exaggerate or falsely claim ESG compliance.
Data Inconsistency – ESG ratings differ widely across agencies.
Short-Term Costs – ESG transition requires heavy investments.
Lack of Awareness – Many retail investors still prioritize quick profits.
Policy Differences – No uniform global ESG standard.
9. Future of ESG & Sustainability Investing
Prediction 1: Stricter Regulations
Governments worldwide will enforce mandatory ESG disclosures.
Prediction 2: ESG in Emerging Markets
India, China, Brazil, and Africa will see exponential ESG adoption.
Prediction 3: Integration with Technology
AI-driven ESG scoring, blockchain-based supply chain tracking, and carbon credit markets will become mainstream.
Prediction 4: Mainstream Adoption
In the near future, ESG will not be a separate category—it will be the default way of investing.
Prediction 5: Retail ESG Investing
Just like mutual funds became mainstream, ESG-focused products will attract retail participation in India and abroad.
10. Practical Guide: How to Invest in ESG
Mutual Funds & ETFs – Invest in ESG-themed funds.
Direct Stocks – Pick companies with strong ESG ratings.
Green Bonds – Support eco-projects while earning fixed returns.
Thematic Portfolios – Build portfolios around sustainability themes (renewables, EVs, water management).
Due Diligence – Verify ESG claims; avoid greenwashing traps.
Conclusion
Sustainability & ESG investing is not a passing fad—it’s a megatrend shaping the future of finance. The world is moving towards a system where profit and purpose must co-exist.
For investors, this means:
ESG is becoming a risk management tool.
ESG compliance improves long-term performance.
Early adopters stand to benefit from the global shift in capital flows.
India, being at the cusp of massive economic growth, is perfectly positioned to ride the ESG wave. The government’s push for clean energy, digital governance, and responsible corporate practices will only accelerate this trend.
In short, the future of investing is sustainable investing. Capital is no longer blind; it is conscious, responsible, and forward-looking.

Trading Master Class With ExpertsRisks in Options Trading
Time decay eats premium if direction isn’t quick.
Volatility crush reduces premium post-events (like RBI policy).
Unlimited risk for sellers if market moves sharply.
Liquidity issues in some stock options.
Options Trading Psychology
Requires discipline & patience—most beginners lose by overtrading.
Emotions like fear of missing out (FOMO) or greed destroy capital.
Successful option traders often specialize in 1–2 instruments (e.g., Bank Nifty weekly options).
Role of Retail vs Institutional Traders
Retail traders mostly buy options (lottery-ticket approach).
Institutions & HNIs dominate selling (because they can hold margins).
Data shows: retail traders lose premium, institutions earn it—but smart retail traders can also make money by following disciplined strategies.

Paer 6 Learn Institutional Trading Options Trading Strategies
Basic Strategies
Long Call → Buy call, bullish.
Long Put → Buy put, bearish.
Covered Call → Own stock + sell call for income.
Protective Put → Own stock + buy put for protection.
Intermediate Strategies
Straddle: Buy Call + Put at same strike (bet on volatility).
Strangle: Buy Call (higher strike) + Put (lower strike).
Bull Call Spread: Buy low strike call + sell higher strike call.
Bear Put Spread: Buy put + sell lower strike put.
Advanced Strategies
Iron Condor: Range-bound strategy selling OTM call + put spreads.
Butterfly Spread: Profit from low volatility near strike.
Ratio Spreads: Adjust risk/reward with multiple options.
Margin Requirements & Leverage
Option buyers: Pay only premium (small capital).
Option sellers (writers): Need large margin (higher risk).
NSE SPAN + Exposure margin system determines requirements.
For example, selling 1 lot of Bank Nifty option may require ₹1.5–2 lakh margin depending on volatility.

Paer 4 Learn Institutional Trading Options Trading Strategies
Basic Strategies
Long Call → Buy call, bullish.
Long Put → Buy put, bearish.
Covered Call → Own stock + sell call for income.
Protective Put → Own stock + buy put for protection.
Intermediate Strategies
Straddle: Buy Call + Put at same strike (bet on volatility).
Strangle: Buy Call (higher strike) + Put (lower strike).
Bull Call Spread: Buy low strike call + sell higher strike call.
Bear Put Spread: Buy put + sell lower strike put.
Advanced Strategies
Iron Condor: Range-bound strategy selling OTM call + put spreads.
Butterfly Spread: Profit from low volatility near strike.
Ratio Spreads: Adjust risk/reward with multiple options.
Margin Requirements & Leverage
Option buyers: Pay only premium (small capital).
Option sellers (writers): Need large margin (higher risk).
NSE SPAN + Exposure margin system determines requirements.
For example, selling 1 lot of Bank Nifty option may require ₹1.5–2 lakh margin depending on volatility.

Part 2 Master Candle PatternKey Terms in Options Trading
Strike Price: The price at which you can buy/sell the underlying.
Premium: The cost paid to buy the option.
Expiry Date: Last day the option is valid (weekly/monthly in India).
Lot Size: Minimum tradable quantity (e.g., Nifty options = 25 units per lot).
ITM (In the Money): Option has intrinsic value.
ATM (At the Money): Strike price = underlying price.
OTM (Out of the Money): Option has no intrinsic value.
How Options Work (Indian Example)
Let’s take an example with Nifty 50 trading at ₹22,000:
Suppose you buy a Nifty 22,200 Call Option for a premium of ₹100 (lot size = 25).
Total cost = 100 × 25 = ₹2,500.
Case 1: Nifty goes up to 22,400
Intrinsic value = 22,400 – 22,200 = ₹200
Profit per lot = (200 – 100) × 25 = ₹2,500
Case 2: Nifty stays at 22,000 or falls
Option expires worthless.
Loss = Premium paid = ₹2,500
This asymmetry—limited risk, unlimited reward—is what attracts many retail traders to options.

Part 1 Master Candle PatternIntroduction to Options Trading
Options trading has become one of the fastest-growing segments of the Indian financial market. Once considered a playground only for institutions and advanced traders, options are now widely accessible to retail investors thanks to online trading platforms, mobile apps, and reduced brokerage costs.
In India, the NSE (National Stock Exchange) is the world’s largest derivatives exchange in terms of contracts traded, with Bank Nifty and Nifty 50 options leading the charge. For retail traders, options present opportunities for hedging, speculation, and income generation, making them versatile instruments.
But options are also complex. Unlike stocks, where you directly own a piece of a company, options are derivative contracts—their value depends on the price of an underlying asset. This makes them both powerful and risky if not understood properly.
What are Options?
An option is a financial contract that gives the buyer the right, but not the obligation, to buy or sell an underlying asset at a predetermined price (strike price) before or on a specific date (expiry).
Call Option → Right to buy an asset at a strike price.
Put Option → Right to sell an asset at a strike price.
Unlike futures contracts, option buyers are not obligated to execute the trade. They can choose to let the option expire worthless if the trade doesn’t go their way.

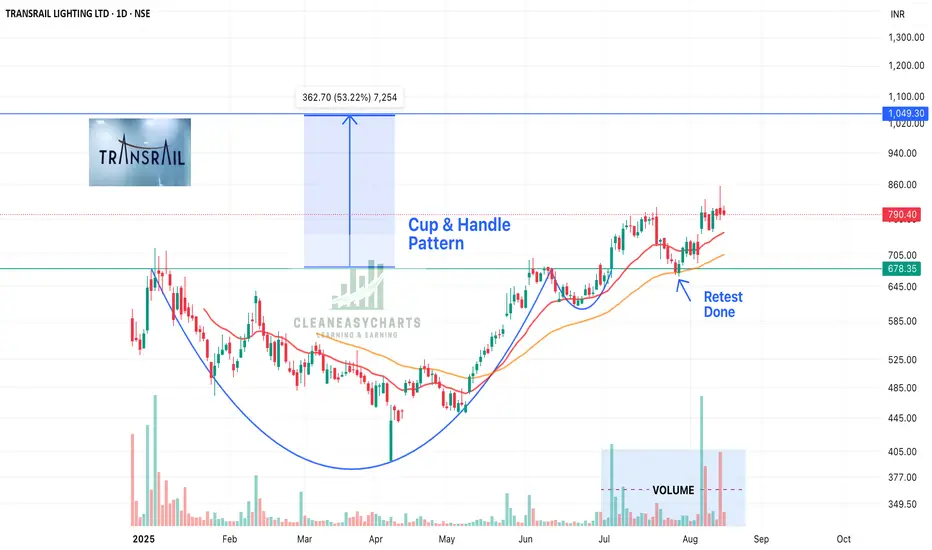
Transrail Lighting: Cup & Handle Pattern- Breakout & Retest DoneTransrail has made a cup & handle pattern and is looking for 50% jump. Other factors:
1. It got listed in Dec 2024 and has crossed that price, made a Cup & Handle Pattern - Breakout & Retest done.
2. 15000 crores order book
3. Recently got 700 crore order
4. Perform orders in 59 countries
5. Profitability is increasing
6. 25% growth rate
Transrail is solid fundamental & technical stock. This should be in your portfolio.
Right Stocks at Right Time at Right Price !!!
Keep following @Cleaneasycharts
Cheers!!
Zydus Lifesciences LtdDate 17.08.2025
Zydus Lifesciences
Timeframe : Day Chart
Business Segments
(1) US Formulations 51%
(2) India Business 37%
(3) International Markets Formulations 9%
(4) API 2%
(5) Alliances & Others 1%
Key Points
(1) Distributes over 200 generic products in the U.S. market
(2) 5th largest generic company in the U.S.
(3) Offers branded formulations for Cardiology, Anti-Diabetes, Respiratory, Gynaecology, GastroIntestinal, Dermatology , Oncology and Nephrology.
(4) Consumer Wellness brands in India are Nycil, Everyuth, Glucon-D, Sugar Free, Complan, and Nutralite
(5) It has a market share of 7.4% in Sri Lanka with 30 brands
(6) It is also the 2nd largest company in South Africa and the 9th largest in the Philippines
Supply Chain
(1) Covers over 4,500 SKUs across 12 dosage forms
(2) Supplied to over 75 countries
(3) It has a demand of over 2,500 finished goods per month
Manufacturing
(1) 18 formulation manufacturing units
(2) 6 API units
(3) 1 animal health unit
(4) 3 biologics units
(5) 5 vaccine units
(6) 4 consumer product facilities
R&D
(1) The company has 8 R&D centers.
(2) It invests approximately 7 to 8% of its annual revenues in R&D
Debt Reduction
(1) Company’s gross debt has declined from Rs. 2,662 Cr to Rs. 768 Cr
Valuations
(1) Market Cap = ₹ 99,496 Cr
(2) Stock P/E = 21.4
(3) Book Value = 4X
(4) ROCE = 24.3 %
(5) ROE = 21.2 %
(6) Operating Profit Margin = 30% (YoY)
(7) Sales Growth = 15% (YoY)
Shareholding Pattern
(1) Promoters = 75.00%
(2) FIIs = 7.13%
(3) DIIs = 11.09%
(4) Government = 0.04%
(5) Public = 6.74%
Regards,
Ankur

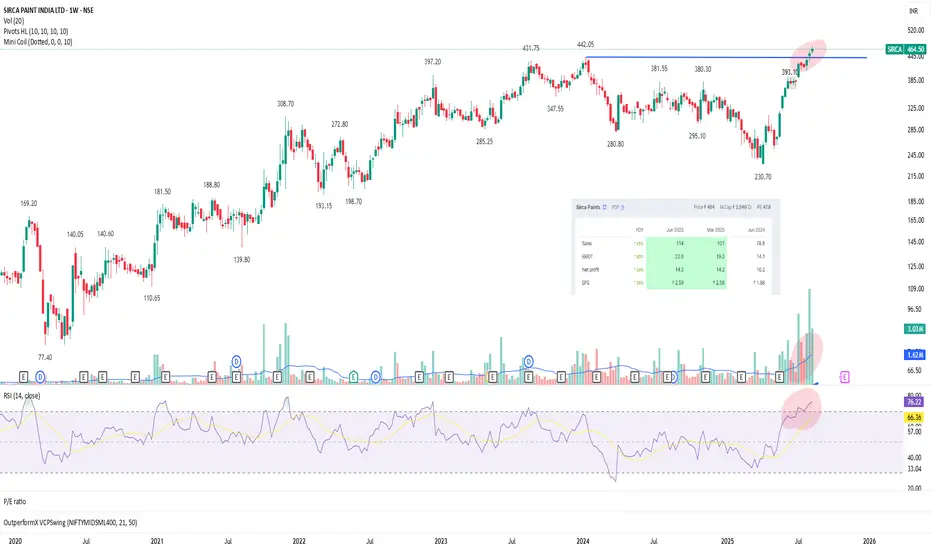
Sirca Paints - Crossed the last Resistance with Volume and RSIFundamental Q1 - Good Sales(45%) Growth & EPS (60%) - YOY
Technical -Crossed the resistance (443) with good volume.
Now in ATH (Blue Sky Zone)
FII- June Quarter - Holding - 5.18% compared to 4.28% March Quarter.
Good entry for long term bet.
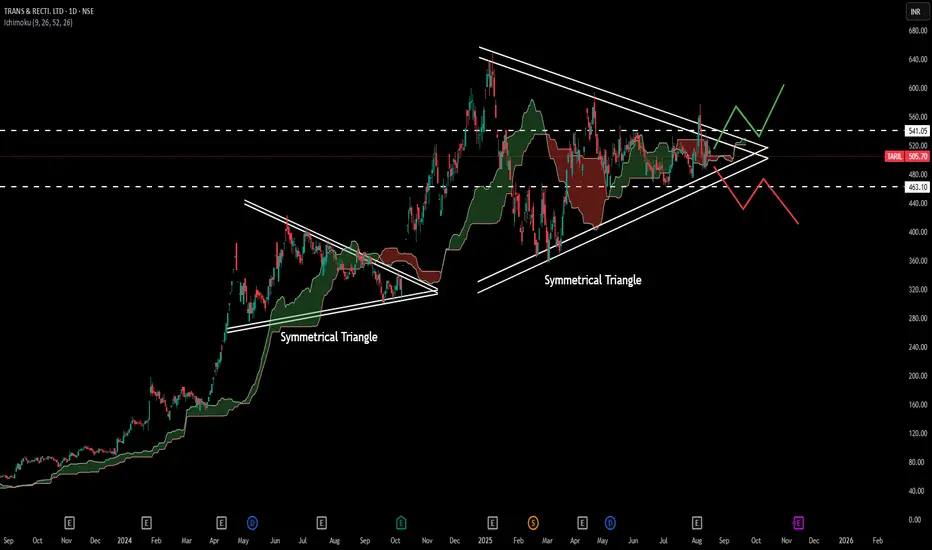
Transformers & Rectifiers India LtdDate 16.08.2025
Transformers & Rectifiers
Timeframe : Day Chart
About
(1) Company is a manufacturer of Power, Furnace and Rectifier Transformers.
(2) Single-phase power transformers up to 500MVA & 1200kV Class
(3) Furnace Transformers, Rectifier & Distribution Transformers, Specialty Transformers
(4) Series & Shunt Reactors, Mobile Sub Stations, Earthing Transformers
(5) It operates on a B2B model, catering to power generation, transmission, distribution, & industrial sectors
(6) The company has a global footprint in 25+ countries.
Geographical Split
(1) Domestic: 92% in FY24 vs 85% in FY22
(2) Exports: 8%
Clientele
Powergrid, NTPC, TATA Power, Torrent Power, Siemens Energy, Bluestar, Hindustan Zinc, JSW, Getco
Order Book
(1) As of 9M FY25, the company has a total order book of Rs. 3,686 Cr.
(2) It also has orders worth Rs. 19,000+ Cr under negotiation.
(3) Total market cap at 15179 cr
Order Book Mix
Product-Wise :
(1) Power Transformer: 66%
(2) Reactor: 27%
(3) Special Duty Transformers: 7%
Customer-Wise :
(1) Industrial Customers: 47%
(2) Central Utilities: 43%
(3) State Utilities: 10
Manufacturing Capabilities
(1) The company is India's 2nd-largest transformer manufacturer by capacity
(2) Operating 3 plants in Ahmedabad, Gujarat, with a combined capacity of 40,000 MVA
Capex
(1) The company is expanding its capacity by 15,000 MVA to manufacture transformers for the renewable energy sector
(2) with order bookings for the new capacity set to begin in Q4 FY25
Valuations
(1) Market Cap = ₹ 15,179 Cr
(2) Stock P/E = 58.6
(3) Book Value = 12X
(4) ROCE = 28.0 %
(5) ROE = 23.4 %
(6) Sales Growth = 56% (YoY)
(7) Operating Profit Margin = 17%
Note*
(1) Debtor days have improved from 142 to 84.8 days.
(2) Company's working capital requirements have reduced from 73.6 days to 34.2 days
Regards,
Ankur
Part 2 Support And ResistanceHow Options Work in Trading
Imagine a stock is trading at ₹1,000.
You believe it will rise to ₹1,100 in a month. You could:
Buy the stock: You need ₹1,000 per share.
Buy a call option: You pay a small premium (say ₹50) for the right to buy at ₹1,000 later.
If the stock rises to ₹1,100:
Stock profit = ₹100
Call option profit = ₹100 (intrinsic value) - ₹50 (premium) = ₹50 net profit (but with much lower capital).
This leverage makes options attractive but also risky — if the stock doesn’t rise, your premium is lost.
Categories of Options Strategies
Options strategies can be divided into three main categories:
Directional Strategies – Profit from price movements.
Non-Directional (Neutral) Strategies – Profit from sideways markets.
Hedging Strategies – Protect existing positions.

How Pros Plan Their Trades (Before Entering the Market)Introduction
In trading, the difference between professionals and amateurs doesn’t lie in who can predict the future—no one can—but in how they plan their trades before entering the market. Professionals treat trading like a business. Every position is carefully designed, risk is pre-calculated, and contingencies are set in advance. They know that planning is where the real “edge” lies, not in gut feelings or random speculation.
This article will explore how professional traders plan their trades—step by step—covering everything from market analysis, risk management, and entry/exit strategies, to psychology and record-keeping.
1. The Foundation: Trading Philosophy & Edge
Before professionals even open their charts, they have a trading philosophy that guides all their decisions. This philosophy is built around an edge—a repeatable method that provides higher probability setups over time.
Clarity of Method: A pro doesn’t jump between indicators or strategies every week. They master one or two setups and refine them.
Edge Definition: For some, the edge lies in volume profile analysis; for others, it’s price action, options strategies, or mean reversion.
Statistical Advantage: The edge doesn’t guarantee every trade wins, but over a large number of trades, it produces consistent results.
Example:
A price-action trader may specialize in breakouts with volume confirmation. They won’t trade anything that doesn’t fit this mold.
2. Pre-Market Preparation
Planning begins before the market opens. Professionals treat this like a pilot’s pre-flight checklist.
a) Economic Calendar
Check scheduled news: Fed meetings, RBI policies, inflation data, corporate earnings.
Avoid entering trades right before high-impact events unless news trading is part of the strategy.
b) Global Market Overview
Review overnight moves in U.S., European, and Asian markets.
Check GIFT Nifty, Dow futures, crude oil, bond yields, and currency moves.
These set the tone for local market sentiment.
c) Sectoral & Stock Scanning
Identify which sectors are strong or weak (banks, IT, energy, etc.).
Spot stocks near breakout levels or with unusual volume.
d) Mental Readiness
Professionals ensure they are calm, rested, and focused. Emotional imbalance leads to poor execution.
3. Trade Idea Generation
Once the groundwork is done, pros filter potential trades. They don’t chase random moves—they prepare a watchlist of high-probability setups.
a) Technical Analysis
Chart patterns: breakouts, pullbacks, double bottoms/tops.
Volume confirmation: rising volume on entry levels.
Key levels: support, resistance, moving averages, VWAP.
b) Fundamental Catalysts
Earnings beats/misses.
Mergers, acquisitions, product launches.
Policy changes or macro triggers.
c) Market Structure & Order Flow
Pros often use volume profile, order book, and liquidity zones to identify where big players are positioned.
Result: By this stage, they’ve shortlisted 2–5 potential trades for the session.
4. Defining the Trade Setup
A trade idea becomes a planned trade only when every detail is defined before entry.
a) Entry Criteria
Exact price level (e.g., breakout above ₹1,200).
Conditions (e.g., must have 20% higher-than-average volume).
Confirmation (e.g., wait for candle close above resistance).
b) Stop-Loss Placement
Always defined before entering.
Logical placement: below support, ATR-based, or volatility-adjusted.
Never random points.
c) Position Sizing
Based on risk management, not emotions.
Example: If risking 1% of capital per trade, calculate lot size accordingly.
d) Profit Target / Exit Plan
Define take-profit levels (e.g., risk-reward ratio of 1:3).
Partial exits if momentum slows.
Trail stop-loss as trade moves in favor.
5. Risk Management Blueprint
Professionals survive because they respect risk more than reward.
a) Risk per Trade
Usually 0.5%–2% of capital per trade.
Keeps account safe from drawdowns.
b) Risk-Reward Ratio
Minimum 1:2 or 1:3 setups.
If the target doesn’t justify the risk, they skip the trade.
c) Diversification & Correlation
Avoid overexposure in the same sector or correlated instruments.
d) Daily/Weekly Loss Limits
If daily loss exceeds a certain limit, they stop trading.
This prevents emotional revenge trading.
6. Psychological Preparation
Even the best plan fails if emotions take over. Pros prepare mentally before entry.
a) Neutral Mindset
They don’t “hope” or “fear”—they execute.
Losing trades are accepted as part of the game.
b) Visualization
Before entry, they visualize both winning and losing scenarios.
This avoids shock when markets move against them.
c) Detachment
They trade the setup, not the money.
Focus remains on following the process.
7. Executing the Plan
Once the trade is planned, execution is mechanical.
Place stop-loss immediately after entry.
Set alerts for key price levels.
Stick to the plan—no impulsive changes.
Golden Rule: Professionals never enter a trade without knowing exactly:
Why they’re entering.
Where they’ll exit if wrong.
Where they’ll exit if right.
8. Trade Review & Journaling
Planning doesn’t stop after entry or exit—it extends into review.
a) Journaling
Every trade is recorded: entry, exit, rationale, screenshots.
Notes on psychology (“I felt anxious”, “I overtraded”).
b) Performance Analysis
Weekly/monthly reviews of win rate, risk-reward, mistakes.
Identify which setups work best.
Eliminate low-probability trades.
c) Continuous Improvement
Plans evolve as the trader grows.
Strategies are refined based on data, not feelings.
9. Example of a Professional Trade Plan
Stock: Infosys (NSE)
Trade Idea: Breakout above ₹1,650 resistance.
Entry Criteria: Enter long only if price closes above ₹1,650 with 1.5x average volume.
Stop-Loss: ₹1,620 (below nearest support).
Target 1: ₹1,700 (partial booking).
Target 2: ₹1,750 (full exit).
Risk-Reward: 1:3.
Position Size: 1% risk of capital.
Exit Plan: Trail stop-loss after ₹1,700 is hit.
Notes: Avoid entry if global markets are negative.
This is how pros pre-define everything before touching the buy/sell button.
10. Common Mistakes Amateurs Make (That Pros Avoid)
Entering without stop-loss.
Trading based on tips or news without analysis.
Risking too much capital on one trade.
Shifting stop-losses out of fear.
Overtrading without a plan.
11. The Professional Mindset
Ultimately, pros see trading as a business of probabilities. Every trade is a bet with defined risk, like a casino operating with a statistical edge. They don’t need every trade to win—they just need consistency.
Discipline > Prediction.
Process > Outcome.
Risk Control > Profit Hunting.
Conclusion
Professional traders don’t enter the market blindly. Every move is backed by preparation, structured planning, and strict risk control. They design trades like an architect draws blueprints—nothing is left to chance.
For aspiring traders, the lesson is clear: spend more time planning your trades than placing them.
Planning is where pros win the game—execution is just following the script.

GIFT Nifty TradingIntroduction
India has always been at the center of global investor attention. With a rapidly growing economy, strong demographic advantage, and increasing financial market maturity, India is becoming a major hub for global capital flows. To strengthen this position, the Gujarat International Finance Tec-City (GIFT City) was established as India’s first International Financial Services Centre (IFSC).
One of the most important steps in making GIFT City globally relevant was the introduction of GIFT Nifty, a trading platform that connects global investors to India’s equity markets in real time. Replacing the Singapore Exchange (SGX) Nifty, GIFT Nifty represents India’s move to bring back offshore Nifty trading volumes to Indian territory.
In this comprehensive guide, we’ll cover everything about GIFT Nifty trading, including its background, structure, importance, strategies, risks, and its role in shaping the future of Indian and global financial markets.
1. Background of GIFT Nifty
1.1 The SGX Nifty Era
Before GIFT Nifty, foreign investors who wanted exposure to Indian equities largely used SGX Nifty, a derivative contract listed on the Singapore Exchange. SGX Nifty mirrored India’s Nifty 50 index, providing offshore traders the ability to hedge or speculate on Indian markets without registering in India.
For years, SGX Nifty was highly popular because:
It offered almost 16 hours of trading time, including when Indian markets were shut.
Foreign investors avoided compliance with Indian regulations.
It provided liquidity and easy entry/exit.
But this created a problem for India. A large portion of trading in Indian indices was happening outside the country, meaning India lost out on liquidity, market depth, and revenue.
1.2 The Transition to GIFT Nifty
To bring this trading activity back to India, the NSE International Exchange (NSE IX) at GIFT City was launched. After years of negotiations, SGX Nifty trading officially shifted to GIFT Nifty on July 3, 2023.
Now, instead of trading in Singapore, foreign investors access Nifty futures through GIFT City, keeping the ecosystem within India’s borders.
2. What is GIFT Nifty?
GIFT Nifty is the international version of India’s Nifty index futures, traded on the NSE IX at GIFT City. It allows global and domestic investors to trade, hedge, and speculate on Indian equities in a globally accessible financial environment.
2.1 Key Features
Underlying index: Nifty 50
Contracts available: GIFT Nifty 50, GIFT Nifty Bank, GIFT Nifty Financial Services, GIFT Nifty IT
Trading hours: Nearly 21 hours (6:30 AM IST to 2:45 AM IST next day), overlapping with Asian, European, and US markets
Currency denomination: USD, making it attractive to global investors
Taxation benefits: IFSC offers favorable tax regimes compared to onshore markets
2.2 Why It Matters
Strengthens India’s financial sovereignty
Brings liquidity back from offshore to onshore
Provides global investors with near-continuous access to Indian markets
Enhances India’s role in global trading ecosystems
3. Structure of GIFT Nifty
3.1 Contract Specifications
Lot Size: Each contract has a fixed multiplier (usually 50 units per contract, like SGX Nifty).
Expiry: Monthly and quarterly contracts available.
Settlement: Cash-settled in USD, based on Nifty 50 closing value.
Margin Requirements: Traders need to maintain margins similar to global exchanges.
3.2 Participants
Foreign Portfolio Investors (FPIs)
Domestic Institutional Investors
Hedge Funds and Asset Managers
Retail (through IFSC brokers)
3.3 Trading Ecosystem at GIFT City
The GIFT IFSC provides:
Low taxation (no securities transaction tax, commodity transaction tax, or stamp duty).
100% foreign ownership allowed in IFSC brokers.
Liberalized rules for foreign currency accounts.
Global-standard clearing and settlement infrastructure.
4. Why GIFT Nifty is Important
4.1 For India
Revenue retention: Trading volumes and fees stay in India.
Market depth: Strengthens domestic derivatives market.
Global status: Puts India on the map as a global trading hub.
4.2 For Global Investors
Extended trading hours: Easier to trade in Indian markets across different time zones.
USD contracts: Reduces currency risk for international traders.
Access to India’s growth story: India is one of the fastest-growing economies, and GIFT Nifty gives direct access.
4.3 For Traders
More opportunities: Nearly round-the-clock trading enables reaction to global events.
Arbitrage: Traders can arbitrage between onshore NSE Nifty and offshore GIFT Nifty.
Liquidity: Strong foreign participation ensures volumes.
5. How GIFT Nifty Works in Practice
Imagine a scenario:
The US Fed announces a surprise interest rate hike at 10 PM IST.
Indian stock markets are closed, but GIFT Nifty is live until 2:45 AM.
Global traders immediately react, selling GIFT Nifty contracts.
This provides a real-time indication of how Indian equities may open the next day.
Thus, GIFT Nifty acts as a barometer of global sentiment towards India, even outside normal Indian trading hours.
6. Trading Strategies in GIFT Nifty
6.1 Hedging
Foreign investors holding Indian portfolios can hedge overnight or global risks by taking opposite positions in GIFT Nifty.
6.2 Arbitrage
Onshore vs Offshore Arbitrage: Price differences between NSE Nifty and GIFT Nifty create opportunities.
Cross-market Arbitrage: Traders arbitrage between GIFT Nifty and other indices (like S&P 500, Nikkei).
6.3 Speculation
Day traders and institutions speculate on short-term moves, just like in regular futures markets.
6.4 Event Trading
Events like Budget, RBI policy, or global announcements can create sharp moves in GIFT Nifty, offering trading opportunities.
7. Risks in GIFT Nifty Trading
7.1 Market Risks
Like any derivative, GIFT Nifty is highly leveraged. Sudden volatility can wipe out margins.
7.2 Currency Risks
Although contracts are USD-based, Indian investors face INR-USD conversion risks.
7.3 Liquidity Risks
While volumes are growing, some contracts may still lack liquidity compared to NSE Nifty.
7.4 Regulatory Risks
Any change in IFSC or SEBI regulations may affect participation.
8. Taxation & Regulatory Framework
Tax advantages: No capital gains tax for non-residents, no stamp duty, no STT/CTT.
IFSC Authority: The unified regulator for GIFT City ensures global standards.
Foreign Investors: Allowed to directly trade via IFSC brokers without needing SEBI FPI registration.
9. Future of GIFT Nifty
9.1 Growth Potential
More contracts (Midcap, sectoral indices) likely to be introduced.
Potential for options trading in addition to futures.
Increasing participation from global hedge funds, asset managers, and even retail investors.
9.2 India as a Global Hub
If successful, GIFT Nifty will make GIFT City a financial hub comparable to Dubai, Singapore, and Hong Kong.
9.3 Integration with Global Markets
Longer trading hours and global recognition will ensure GIFT Nifty becomes the benchmark for Indian equities worldwide.
10. Practical Guide for Traders
Step 1: Open an IFSC Trading Account
Traders must open accounts with NSE IX-registered brokers in GIFT City.
Step 2: Fund Account in USD
Trading is USD-denominated, so funding is done in dollars.
Step 3: Understand Margin & Risk
Maintain adequate margins to avoid forced liquidation.
Step 4: Build Strategies
Use GIFT Nifty to hedge portfolios.
Trade during overlapping hours with Europe/US for maximum volatility.
Step 5: Monitor News
Global events significantly impact GIFT Nifty. Keep track of US Fed, crude oil, geopolitical tensions, etc.
Conclusion
GIFT Nifty trading is more than just a financial product – it is a symbol of India’s growing financial power. By bringing offshore Nifty trading back home, India has strengthened its sovereignty, deepened its markets, and provided global investors with seamless access to its growth story.
For traders, it offers nearly round-the-clock opportunities, arbitrage, hedging, and speculation in USD terms. For India, it positions GIFT City as a global financial hub.
As volumes rise and new contracts are introduced, GIFT Nifty is set to become the global benchmark for Indian equities, bridging India with the world’s markets like never before.

Quarterly Results Trading in BanksIntroduction
Banking stocks hold a special place in the financial markets. Whether in India, the U.S., or any other part of the world, banks act as the backbone of the economy. Their quarterly earnings are closely tracked by investors, traders, regulators, and even policymakers because banks represent the health of credit growth, liquidity, interest rate transmission, and corporate activity.
Quarterly results trading in banks is a niche yet powerful strategy where traders position themselves before, during, or after the announcement of bank earnings. The volatility surrounding these results often creates opportunities for both short-term and swing traders. However, this is not a simple “buy on results day” strategy—success depends on understanding earnings drivers, market expectations, macroeconomic context, and technical setups.
This guide explores quarterly results trading in banks in-depth—covering how to analyze reports, predict moves, trade around volatility, and manage risks.
1. Why Bank Quarterly Results Matter
Banks are interest-rate-sensitive and macro-sensitive businesses. Their results reflect not just their own performance but also the broader economy. Let’s break down why they matter:
1.1 Indicators of Economic Health
Banks’ loan growth signals demand from businesses and consumers.
Non-Performing Assets (NPAs) show stress in corporate and retail borrowers.
Net Interest Margins (NIMs) indicate efficiency in lending vs borrowing costs.
1.2 Policy and Liquidity Sensitivity
RBI (or Fed in the U.S.) interest rate decisions directly impact banks’ earnings.
Liquidity conditions affect treasury gains/losses.
1.3 Heavyweights in Indices
In India, banks form a large chunk of Nifty 50 and Bank Nifty. Thus, quarterly results of major banks (HDFC Bank, ICICI Bank, SBI, Axis Bank, Kotak Bank) can swing the entire index.
1.4 Investor and FII Interest
Foreign Institutional Investors (FIIs) actively trade banking stocks, making them liquid and volatile during results season.
2. Anatomy of a Bank’s Quarterly Results
Unlike manufacturing or IT companies, banks have unique reporting metrics. Traders must understand these before making moves.
2.1 Key Metrics to Track
Net Interest Income (NII): Interest earned from loans minus interest paid on deposits.
Net Interest Margin (NIM): Profitability of lending.
Loan Growth: Total advances YoY and QoQ.
Deposit Growth: CASA (Current Account Savings Account) ratio is crucial.
Non-Performing Assets (NPA): Gross NPA and Net NPA indicate asset quality.
Provision Coverage Ratio (PCR): Measures buffer against bad loans.
Fee Income & Treasury Gains: Non-interest revenue streams.
Return on Assets (ROA) & Return on Equity (ROE): Profitability indicators.
2.2 Segment-Wise Performance
Retail vs Corporate lending.
Infrastructure/SME lending trends.
Digital banking adoption.
2.3 Market Expectations
Results are judged not in isolation but against analyst expectations and guidance. Example:
If HDFC Bank posts 20% profit growth but analysts expected 25%, the stock may fall.
A small improvement in NPAs can trigger a rally even if profits are flat.
3. Market Psychology Around Quarterly Results
Quarterly results trading is less about numbers and more about expectations vs reality.
3.1 Pre-Result Rally (Speculation Phase)
Traders anticipate strong/weak results and position themselves early.
Stocks often run up 5–10% before results, only to correct after the announcement (“buy the rumor, sell the news”).
3.2 Result Day Volatility
Options premiums shoot up due to high implied volatility (IV).
Directional moves are sharp but unpredictable.
3.3 Post-Result Trends
The first reaction may be wrong; big players (FIIs, mutual funds) enter gradually, leading to multi-day trends.
Example: A bank stock might dip on profit miss but later rally when analysts highlight improved asset quality.
4. Trading Strategies Around Quarterly Results
Now comes the actionable part—how traders actually make money from quarterly results.
4.1 Pre-Result Trading
4.1.1 Momentum Play
Look for stocks showing strong buildup in price and volume before results.
Example: If ICICI Bank is rising steadily with delivery-based buying, traders may ride the momentum expecting strong numbers.
4.1.2 Options Straddle/Strangle
Since results bring volatility, traders use long straddles/strangles (buying both call and put options) to benefit from big moves.
Works best if IV is not too high.
4.1.3 Sectoral Sympathy Play
If HDFC Bank posts strong results, peers like Axis and Kotak may also rally even before their results.
4.2 Result Day Trading
4.2.1 Intraday Reaction Trading
Trade the immediate move after numbers are announced.
Example: Profit beats + lower NPAs = bullish candle = intraday long.
4.2.2 Fade the Overreaction
Sometimes the market overreacts.
Example: Stock falls 4% on slightly weak profit but asset quality improved—smart traders buy the dip.
4.2.3 Options IV Crush Strategy
Results announcement causes implied volatility to collapse.
Traders can sell straddles/strangles just before results to capture premium decay.
4.3 Post-Result Trading
4.3.1 Trend Following
Strong results often lead to multi-week rallies.
Example: SBI after strong quarterly results in 2023 kept rising for weeks.
4.3.2 Analyst Upgrade/Downgrade Reaction
Monitor brokerage reports. Stocks move sharply when Goldman, CLSA, or Nomura revise targets.
4.3.3 Pair Trading
Go long on strong-result bank and short on weak-result peer.
Example: Long ICICI Bank (good results), short Kotak Bank (disappointing results).
5. Case Studies: Quarterly Results Trading in Indian Banks
5.1 HDFC Bank Q1 FY24
Profit grew 30%, NII rose strongly.
Stock initially fell due to merger concerns but rallied later as analysts upgraded.
Lesson: First-day reaction is not always final.
5.2 SBI Q3 FY23
Record profits + lowest NPAs in decades.
Stock rallied 8% in 2 days.
Lesson: Asset quality improvement drives big moves.
5.3 ICICI Bank Q2 FY23
Strong NIMs, digital growth.
Stock jumped 10% in a week, leading Bank Nifty higher.
Lesson: Market rewards consistency.
6. Risk Management in Quarterly Results Trading
6.1 Position Sizing
Never go all-in on result day. Limit exposure to 2–5% of portfolio.
6.2 Volatility Protection
Use options to hedge positions. For example, buy puts if holding large long positions.
6.3 Avoid Overtrading
Many traders burn capital chasing every tick. Results volatility is sharp; patience pays.
6.4 Macro Factors
Even if bank results are strong, global factors (Fed hikes, crude oil, FII outflows) may drag stocks down.
7. Tools and Analysis Methods
7.1 Technical Analysis
Support/Resistance Levels for pre-result positioning.
Volume Profile to track accumulation/distribution.
Candlestick Patterns post-results for confirmation.
7.2 Fundamental Analysis
Compare QoQ and YoY trends.
Peer comparison to judge relative performance.
7.3 Sentiment Analysis
Track news, social media, and analyst expectations.
7.4 Options Data
Open Interest (OI) buildup signals trader positioning.
PCR (Put-Call Ratio) indicates sentiment.
8. Opportunities & Pitfalls
8.1 Opportunities
Volatility-driven profits.
Strong trending moves after results.
Options strategies like IV crush trading.
8.2 Pitfalls
Overestimating results impact.
Ignoring macro/global triggers.
Getting trapped in whipsaws.
Holding naked option positions.
9. Quarterly Results Trading vs Other Earnings Plays
Banks: Highly macro-driven, sensitive to RBI/Fed.
IT Sector: More dependent on U.S. client spending and forex.
FMCG: Stable, less volatile.
Thus, bank results trading = high risk, high reward.
10. Long-Term Implications of Quarterly Results
While traders focus on short-term gains, quarterly results also help investors:
Identify consistent compounders like HDFC Bank or ICICI Bank.
Spot early signs of stress (like Yes Bank before its collapse).
Gauge sectoral shifts—retail vs corporate lending trends.
Conclusion
Quarterly results trading in banks is not just about reacting to numbers—it’s about interpreting expectations, economic signals, market psychology, and technical setups. The volatility around earnings gives traders multiple opportunities: pre-result speculation, result-day intraday plays, and post-result trend following.
But it is also one of the riskiest forms of trading because moves can be unpredictable. Success depends on discipline, risk management, and a balanced approach combining fundamentals with technicals.
In India, where banking stocks dominate indices like Nifty and Bank Nifty, mastering quarterly results trading can give traders a serious edge. The key is not just to chase profits but to understand the story behind the numbers.