Bullish on BinanceBullish View on Binance
Binance has recently experienced a liquidity sweep, which typically indicates a period of market consolidation and the removal of weaker hands. This event often sets the stage for a more stable and sustained upward movement. Here are a few reasons to maintain a bullish outlook on Binance:
Strong Market Position: Binance remains one of the largest and most trusted cryptocurrency exchanges globally. Its extensive user base and high trading volumes provide a solid foundation for future growth.
Innovative Offerings: Binance continues to innovate with new products and services, such as Binance Smart Chain (BSC), which has gained significant traction in the DeFi space. This innovation attracts more users and increases the platform's utility.
Regulatory Compliance: Binance has been proactive in addressing regulatory concerns and enhancing its compliance measures. This approach not only mitigates risks but also builds trust among users and regulators.
Strategic Partnerships: Binance's strategic partnerships and acquisitions expand its ecosystem and enhance its market presence. These collaborations often lead to new opportunities and increased adoption.
Market Sentiment: Following the liquidity sweep, the market sentiment around Binance appears to be stabilizing. With the weaker hands out, the remaining investors are likely more committed, which can lead to a more gradual and sustained price increase.
This perspective highlights the strengths and potential of Binance, suggesting that the platform is well-positioned for future growth despite recent market fluctuations. What are your thoughts on this outlook?
Fundamental Analysis

Aptus Value HousingAptus Value consolidating from 2022, currently available at good price for short term movement
Not a recommedation/Not suggested

Gold (XAUUSD) | 4H Triangle Breakout SetupPrice is consolidating inside a symmetrical triangle with clear compression. We've just seen a breakout toward the upside, now testing a minor supply zone (3,355–3,365).
I'm watching two scenarios:
Bullish Case: Break and close above 3,393 confirms continuation toward 3,445–3,460 major supply.
Bearish Case: Rejection from 3,355–3,365 zone could send price back to 3,300 or even to the 3,180 demand zone.
Key Confluences:
Triangle breakout
Clean supply/demand zones
Price structure support below
Let’s see how price reacts.
#gold #xauusd #priceaction #supplydemand #orderblock #technicalanalysis #breakout #forex

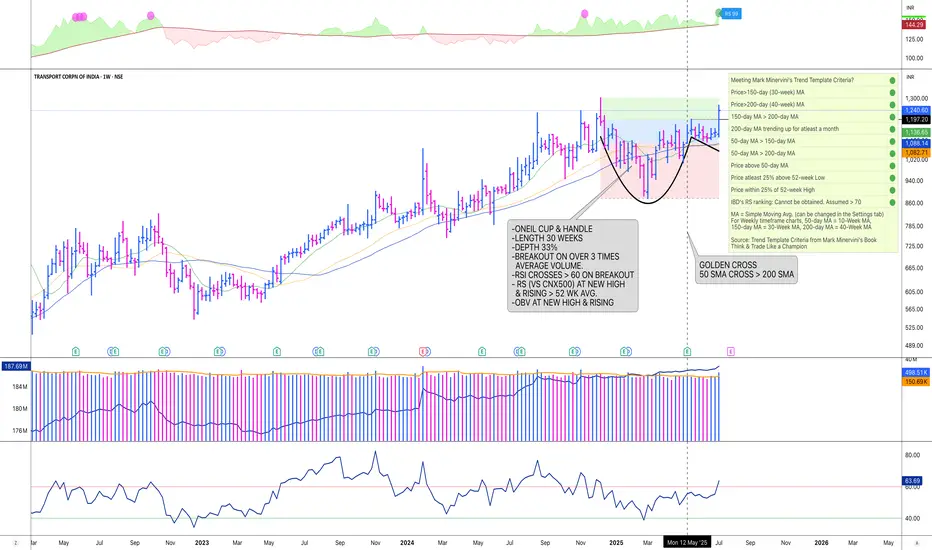
TCI BROKE OUT FROM A 30-WEEK CUP WITH HANDLE ON HUGE VOLUMETCI (Transport corp. of India) has just broken-out from an O’Neil Cup & Handle pattern on weekly chart, on over 3 times average volume.
The pattern meets O’Neil requirements as:
(1) there was a 2-year rally (Dec’22 to Dec’24) of over 100%,
(2) with substantial increase in volume (over 3 to 7 times) at some points prior to the pattern,
(3) pattern length of 30 weeks,
(4) pattern depth of 33%.
(5) During the period NIFTY corrected by 17%, & CNX 500 by 20%. Thus,
(6) the correction of 33% for TCI is well within the 2.5 times general market correction (as detailed by O’Neil).
(7) The Handle is formed in the upper half of the pattern (as per prescription), between 50% & 75% of the pattern range,
(8) volume in the Handle area is substantially low. Also,
(9) the Handle is formed on the support of 10-week (50-day) Moving Average,
(10) with Handle depth of 8.5%.
(11) The BUY Point (‘Pivot Point’ or ‘Line of Least Resistance’ as per Livermore) is 1197.2, the High of the Handle.
(12) on the Breakout Day it recorded a volume of over 12 times its 50-day average.
Coming to fundamentals, TCI has growing revenues over the last 8 quarters, & last 4 years. Also, it has growing EPS 7 out of the last 8 quarters (Dec’23 quarter was flat), & over the last 5 years.
It has 143 institutions (Funds) (increased by 3% in the last quarter) invested in 119 lakh shares (out of 238 lakhs free float) in the company.
Further health of Fundamentals of the company may be looked into as desired.
Currently, the stock is trading about 3.6% from the breakout level.
The overall picture indicates the stock has good fundamentals and strong technical strength.
DISCLAIMER: This publication is purely a personal analysis and is meant to be for informational and educational purposes. It is not intended to be any advice, suggestion, or inducement to buy, sell, or hold any stock, or any other financial instrument. Please conduct your own research and consult your financial advisor for any decision to buy, sell, hold, or otherwise deal with financial instruments, as they are prone to substantial financial risks.
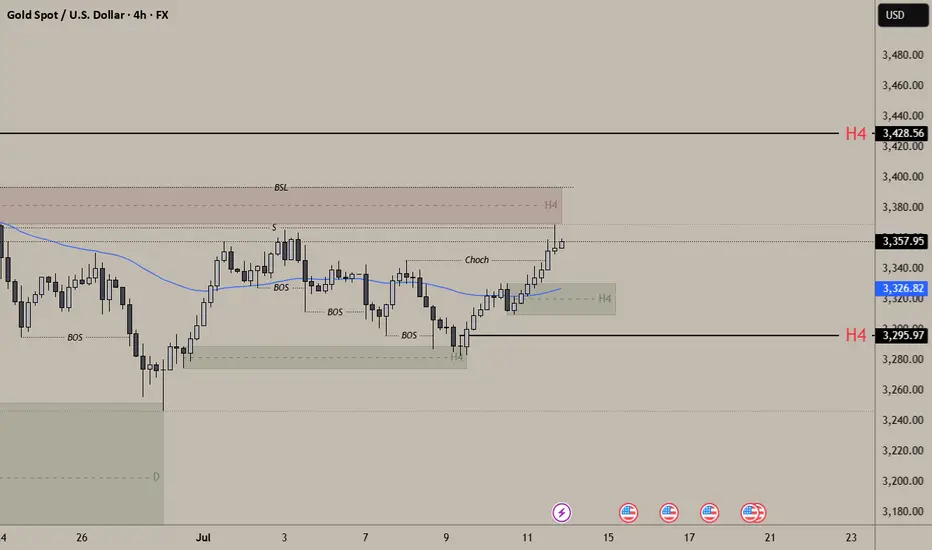
GOLD ANALYSIS AS PER THE MARKET MAKER PERSPECTIVEThis is a gold 4 hour analysis for upcoming week
Gold This week target is 3428 (H4 Supply) in term of bullish
In term of Bearshish (which is low probability) target can be 3296 (H4 demand)
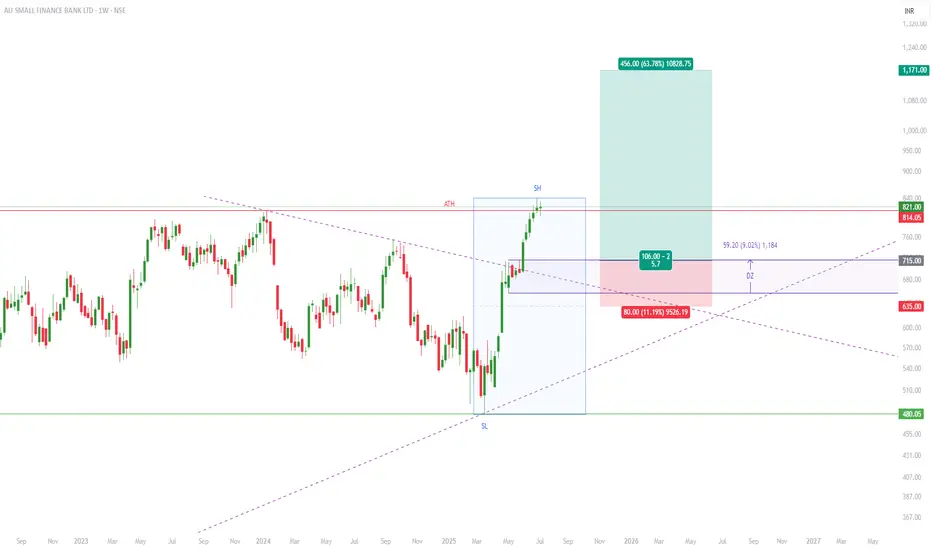
AUBANK | Potential pullback trade at the Demand Zone
STOCK TREND - BULLISH
MULTI TF ANALYSIS
==================
MONTHLY - Price trading near ATH
WEEKLY - Recent TL breakout after consolidation
DAILY - NA
TECHNICAL ANALYSIS
===================
Stock Price is trading above SMAs
RSI >
Support/Resistance Zone - NA
Demand Zone -
Observation - Recent TL breakout has been confirmed along with RSI and Volume confirmation on WEEKLY chart.
FUNDAMENTAL ANALYSIS
======================
Compounded Sales Growth -
Compounded Profit Growth -
Stock Price CAGR -
Return on Equity -
Note: The stock is currently fairly valued as Stock PE(29.05) > Industry PE(19.66) with good fundamentals.
TRADE DESIGN
=============
ENTRY -
SL -
TARGET -
RRR - +
Disclaimer: This chart study is for educational purpose only. Kindly trade at your own risk.
TRADER PSYCHOLOGY - Overtrading The Silent Killer of ConsistencyTRADER PSYCHOLOGY | EPISODE 1: Overtrading – The Silent Killer of Consistency
In the dynamic world of forex trading, success doesn't come from doing more — it comes from doing right. Yet many traders, especially full-time traders in India, unknowingly fall into a common psychological trap that slowly erodes both their capital and confidence: Overtrading.
Let’s break it down — what overtrading is, why it happens, and most importantly, how to stop it before it burns through your progress.
🧠 What Is Overtrading in Forex?
Overtrading refers to excessive trading – opening too many positions without clear signals or justification based on your strategy. In most cases, it’s driven by emotion, not logic.
It usually shows up in two forms:
Trading out of boredom or the urge to “do something”
Trying to recover from previous losses (a.k.a. revenge trading)
Over time, this behavior becomes a habit — and like most bad habits in trading, it’s expensive.
⚠️ Signs You Might Be Overtrading
If you answer "yes" to any of these, it’s time to check your discipline:
Do you feel uncomfortable when you’re not in a trade?
Do you enter trades even when your system says “no trade”?
Do you keep switching charts hoping to “find a setup”?
After a losing trade, do you jump right back in to recover?
Have you lost more to fees/spread than actual price movement?
🧩 Why Indian Traders Often Fall Into Overtrading
🔹 The Action Bias
Traders often feel they must "do something" to be productive. In reality, sitting out is a strategy — especially when markets are flat or unclear.
🔹 Pressure to Perform Daily
Many traders in India try to generate consistent income from trading — and assume they must win every day. That pressure leads to forcing trades just to “hit targets.”
🔹 Overconfidence After a Winning Streak
Success leads to confidence — but too much confidence without structure leads to impulsive trading. One good day shouldn’t convince you that you’ve mastered the market.
🔥 Consequences of Overtrading
Overtrading doesn’t just hurt your account — it breaks your mindset.
Capital Depletion: Small losses + transaction costs = big drawdown over time
Mental Burnout: You feel drained, frustrated, and reactive
Lack of System Trust: You abandon good strategies because you never followed them properly
Emotional Instability: You start making decisions based on fear or revenge, not analysis
✅ How to Control Overtrading – Practical Steps
1. Limit the Number of Trades Per Day
Set a clear rule — e.g., “Maximum 3 trades per day.” This forces you to choose the best setups and ignore mediocre ones.
2. Keep a Simple Trading Journal
Write down:
Why you took the trade
Whether it matched your plan
Your emotional state
Reviewing this weekly will reveal patterns you never noticed in real time.
3. Block Out Non-Active Trading Hours
For Indian traders, this might mean avoiding low-volume periods like mid-Asia session. Focus on London or US overlap hours — when liquidity and volatility are high.
4. Understand: Not Trading Is Still Trading
Being flat (no position) is a strategic decision. Markets reward patience, not impatience.
🎯 Final Thoughts
Overtrading is not a technical issue — it’s a mindset issue.
When you feel the urge to “do something,” remind yourself: the best traders don’t trade all the time. They wait, they observe, and they only act when everything aligns.
"The market doesn’t pay you for activity — it pays you for accuracy."
If you want to grow consistently, you must master the art of waiting, filtering, and executing with purpose.
📌 Next in the Series:
TRADER PSYCHOLOGY | EPISODE 2: FOMO – How Fear of Missing Out Destroys Good Decisions
Follow this page to get notified when it drops!

Fundamental Analysis – Gold Outlook - 14th to 20th JulyFundamental Drivers for the Week Ahead
U.S. CPI (Consumer Price Index) – July 16, 2025
A softer print will increase Fed rate-cut bets, boosting gold.
Fed Chair Powell’s Comments – July 18, 2025
Any dovish tilt can ignite safe-haven buying.
India's Rupee Trend & Monsoon Update
Weak rupee = higher MCX gold; strong rupee = some pressure.
Monsoon progress may also influence rural gold demand sentiment.
AFFLE India: Breakout Backed by Earnings📉Technical Overview
Post-COVID Surge: From INR 400 pre-COVID, AFL India climbed steadily, forming higher highs and higher lows.
Recent Breakout: Just two days ago, it exceeded its recent high and spiked to ₹2,080, now consolidating near ₹1,990.
Next Move: If it clears ₹2,080 and sustains above that level, targets are:
🎯Target 1: ₹2,200
🎯Target 2: ₹2,300
🎯Target 3: ₹2,400
Support Zones:
✅ Recent higher-low stop loss near ₹1,800
✅ If ₹1,800 fails, the next support lies between ₹1,330–₹1,400. A breakdown below this would invalidate the current bullish setup.
💰Q4 FY24 Financial Highlights (vs Q3 FY24 & Q4 FY23)
Total Income: ₹602 Cr (→ vs ₹602 Cr; ↑+19% vs ₹506 Cr)
Total Expenses: ₹468 Cr (↓–0.4% vs ₹470 Cr; ↑+9% vs ₹430 Cr)
Operating Profit: ₹134 Cr (↑+2% vs ₹131 Cr; ↑+37% vs ₹98 Cr)
Profit Before Tax: ₹124 Cr (→ vs ₹124 Cr; ↑+24% vs ₹100 Cr)
Profit After Tax: ₹103 Cr (↑+3% vs ₹100 Cr; ↑+18% vs ₹87 Cr)
Diluted EPS: ₹7.34 (↑+3% vs ₹7.13; ↑+18% vs ₹6.24)
✅ Strong YoY growth across key profitability metrics, especially operating and net profit—good sign of resilient operations.
🔍Fundamental Insights
Steady Margin Expansion: Operating margin expanded sequentially and year-over-year, indicating improving operational efficiency.
Healthy Balance Sheet: Company maintains a solid cash position with no significant debt—boosting financial flexibility.
Dividend History: Announced interim/final dividend (check exchange filings) reflecting steady shareholder returns.
Product & Market Position: Strong market presence in polyvinyl chloride (PVC) coatings and insulation materials, catering to growing infrastructure and auto sectors.
📝Conclusion
AFL India has demonstrated a classic breakout from a bullish price structure, supported by solid Q4 earnings. The stock now needs to clear and hold above ₹2,080 to confirm upside momentum. If successful, it may rally toward ₹2,400, keeping an eye on strict stop-loss near ₹1,800 or the ₹1,330–₹1,400 zone if support falters.
Disclaimer: lnkd.in

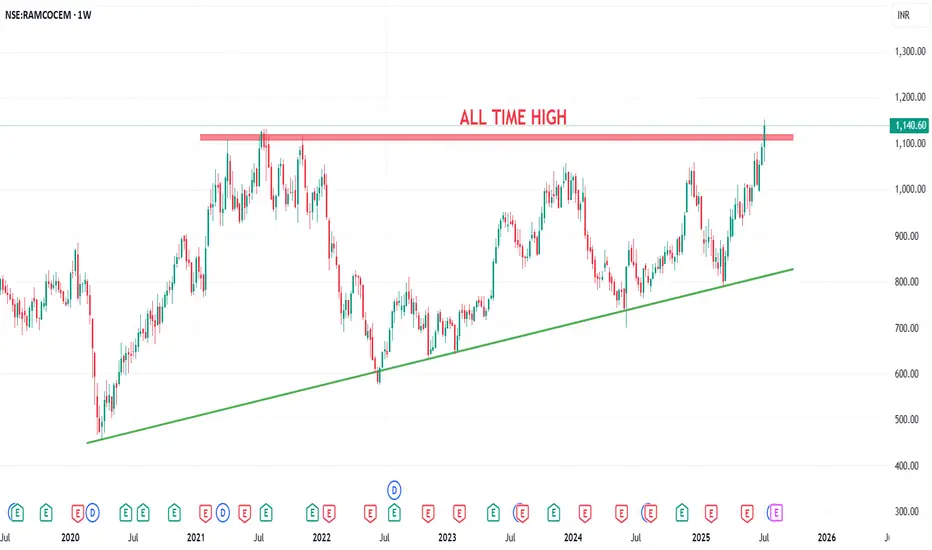
Ramco Cement Break Out Strong Is This the Start of a New Rally?📉Technical View:
Ramco Cement Limited has formed a beautiful ascending triangle pattern with a strong resistance zone at ₹1080–₹1130, tested since 2021. Today, it broke out and hit a new all-time high of ₹1152, now hovering around ₹1140.
If the breakout holds, we may see:
🎯Target 1: ₹1200
🎯Target 2: ₹1240
🎯Target 3: ₹1300
If the stock falls back below ₹1030, the breakout becomes invalid.
💰Q4 FY24 Financial Highlights (vs Q3 FY24 & Q4 FY23)
Total Income: ₹2397 Cr (↑+21% vs ₹1983 Cr; ↓–10% vs ₹2678 Cr)
Total Expenses: ₹2078 Cr (↑+93% vs ₹1074 Cr; ↓–8% vs ₹2259 Cr)
Operating Profits: ₹319 Cr (↑+14% vs ₹279 Cr; ↓–24% vs ₹419 Cr)
Profit Before Tax: ₹46 Cr (↓–76% vs ₹191 Cr; ↓–74% vs ₹175 Cr)
Profit After Tax: ₹26 Cr (↓–86% vs ₹182 Cr; ↓–80% vs ₹129 Cr)
Diluted EPS: ₹1.16 (↓–85% vs ₹7.72; ↓–79% vs ₹5.46)
🧾Despite strong revenue growth and higher operating profits sequentially, sharp cost escalations impacted margins in Q4.
📈Fundamentals & Dividend Insights:
✅ Company continues with capacity expansion in East & South India.
✅ Focus on green energy & cost optimization to improve margin outlook.
💸 Dividend Declared (May 2025): ₹3.50 per share
📝Conclusion:
The breakout on charts is significant and supported by top-line improvement. If sustained, the stock may offer strong upside potential, making Ramco Cement one to watch closely.
Disclaimer: lnkd.in
Gujarat Industries Power Bounces Back with Strength📈Technical Analysis
Breakout & Correction: After breaking ₹190 resistances in Jan 2024, GIPCL surged to ₹270 by June but later corrected sharply.
Strong Demand Base: ₹150 acted as a reliable bottom during the downturn, supporting a rebound into a higher-high, higher-low pattern.
Buy Trigger Zone: A breakout above ₹230–₹240 (former resistance) with bullish candlestick confirmation could unlock upward momentum toward:
🎯Target 1: ₹250
🎯Target 2: ₹260
🎯Target 3: ₹270
Support Levels:
🔻Recent higher-low stop-loss around ₹190
🔻₹150 remains the critical demand zone—below this, bullish case weakens
💰Q4 FY24 Financial Highlights (vs Q3 FY24 & Q4 FY23)
Total Income: ₹338 Cr (↑+5% vs ₹322 Cr; –9% vs ₹373 Cr)
Total Expenses: ₹219 Cr (↑+18% vs ₹196 Cr; –14% vs ₹254 Cr)
Operating Profits: ₹119 Cr (↑+34% vs ₹89 Cr; flat YoY)
Profit Before Tax: ₹86 Cr (↑+62% vs ₹53 Cr; ↑1% YoY)
Profit After Tax: ₹70 Cr (↑+79% vs ₹39 Cr; ↑6% YoY)
Diluted EPS: ₹4.49 (↑+73% vs ₹2.59; ↑2% vs ₹4.38)
📌 Sequential growth across the board—profit nearly doubled QoQ and edged higher YoY—signals improved margins and operational discipline.
🔍Fundamental Highlights
Dividend Yield ~1.9%: Company increased annual dividend to ₹4.09 per share (40.9%) for FY25
Consistent Dividend Growth: Yield rose steadily over the past decade, backed by a healthy ~29% payout ratio
Latest Q4 Net Profit: Up 5.4% QoQ to ₹70 Cr, reflecting resilience in earnings .
Strong Cash Flow & Balance Sheet: Installed capacity ~1,184 MW with healthy leverage metrics
🧭Conclusion
Gujarat Industries Power is showing promising signs—technically rebounding from ₹150 with strategic breakout levels at ₹230–₹240, and fundamental strengths in earnings growth and dividends. If the ₹230–₹240 zone is breached and confirmed, the stock could rally to ₹270.
Disclaimer: lnkd.in

ACI - Bullish with Inverted head and Shoulder patternACI - Bullish with Inverted head and Shoulder pattern
Fundamental Outlook
Almost debt free D/E ratio is 0.02, High ICR
PE of 36.59, IND PE is 30.44, Slightly expensive.
PEG of 0.83, attractive and hence high PE
ROE = 19.45%
ROCE = 25.75% , ROCE 5yrs = 29.26%
Sales growth = -31.72%, Sales Growth 5 yrs 18.65%
Profit growth= -45.26%, Profit Growth 5 yrs = 43.87%
Promoter holding at 53.44%, slightly reduced in last two qtrs
FII holding increased from 10.65% to 10.93% in Mar 2025
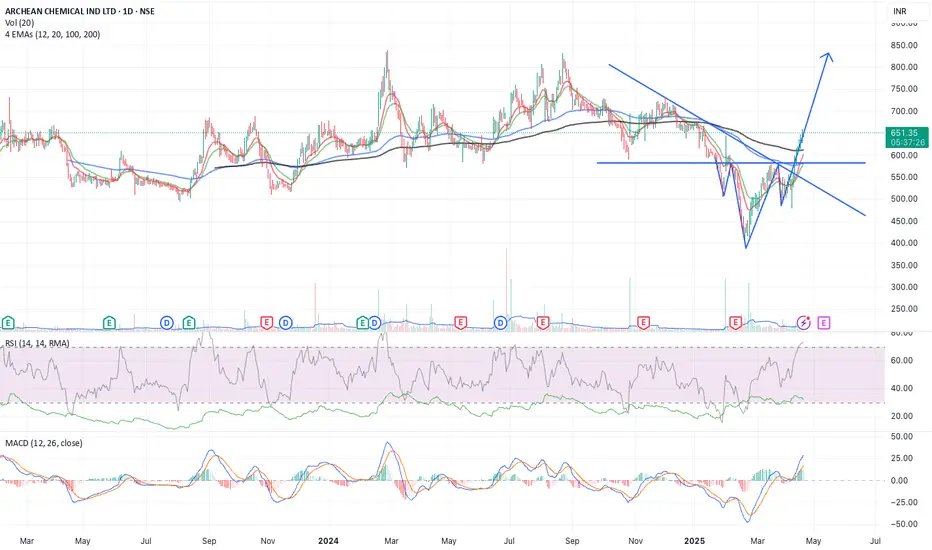
Technical Outlook
CMP : 652
On daily charts ,
EMA9 > EMA21 > EMA63, Sentiment is turning bullish
Momentum needs to continue to take EMAs above EMA200 at 611
RSI = 70+ , Nearly Overbought
Industry Outlook
Speciality Chemicals
Stock is having high Relative Strength and momentum amongst peers
Disclosure 1 - Invested
Disclosure 2 - Not SEBI Registered
Disclosure 3 - This is Not investment advice. Treat it as educational
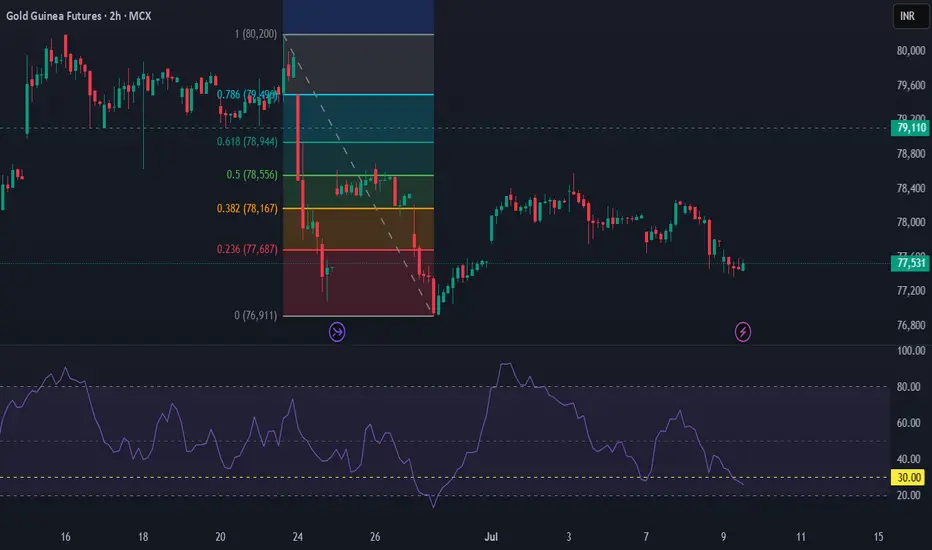
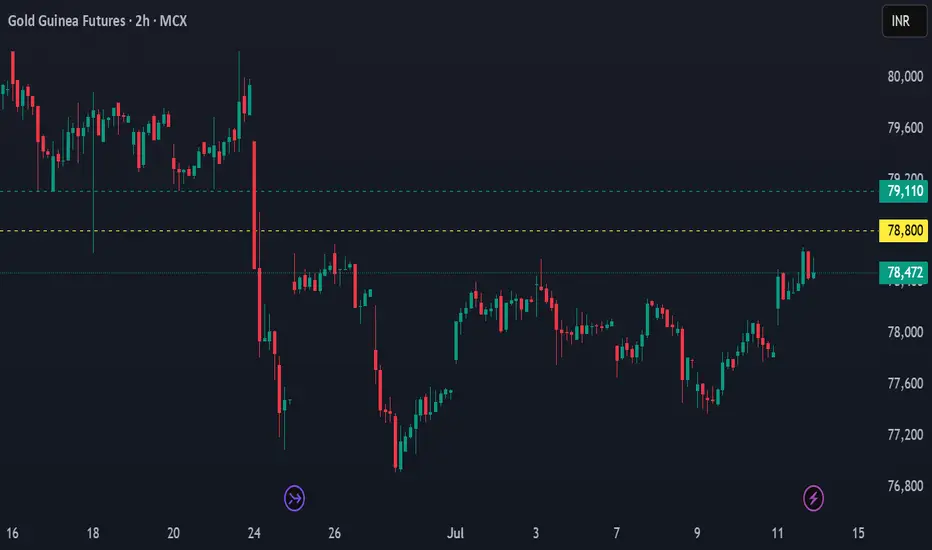
Gold Guinea Eye Breakout – Bulls Test Crucial ₹78,500 ResistanceMCX Gold Guinea shows a strong bullish recovery back toward a key resistance zone near ₹78,400, after bottoming out around ₹77,000. The recent rally has been steady, forming higher lows and higher highs—indicating short-term bullish momentum is building up. The price action has now reclaimed the consolidation range it was stuck in earlier (between ₹77,500 and ₹78,500), suggesting buyers are regaining control.
However, ₹78,500–₹78,800 remains a crucial resistance area, as it previously acted as a supply zone before the breakdown on June 24th. The current candles are small-bodied and forming near resistance, hinting at buying exhaustion or profit booking. If the price manages to close above ₹78,800 with strength and volume, it may open up a fresh leg toward ₹79,200 and eventually ₹79,800.
On the flip side, failure to break and hold above ₹78,500 could lead to a pullback to ₹77,800 or even ₹77,500, which now acts as immediate support. Until a breakout above the resistance range is confirmed, the structure remains cautiously bullish but not yet in a full uptrend.

AFFLE India: Breakout Backed by Earnings📉 Technical Overview
Post-COVID Surge: From INR 400 pre-COVID, AFL India climbed steadily, forming higher highs and higher lows.
Recent Breakout: Just two days ago, it exceeded its recent high and spiked to ₹2,080, now consolidating near ₹1,990.
Next Move: If it clears ₹2,080 and sustains above that level, targets are:
🎯 Target 1: ₹2,200
🎯 Target 2: ₹2,300
🎯 Target 3: ₹2,400
Support Zones:
✅ Recent higher-low stop loss near ₹1,800
✅ If ₹1,800 fails, the next support lies between ₹1,330–₹1,400. A breakdown below this would invalidate the current bullish setup.
💰 Q4 FY24 Financial Highlights (vs Q3 FY24 & Q4 FY23)
Total Income: ₹602 Cr (→ vs ₹602 Cr; ↑+19% vs ₹506 Cr)
Total Expenses: ₹468 Cr (↓–0.4% vs ₹470 Cr; ↑+9% vs ₹430 Cr)
Operating Profit: ₹134 Cr (↑+2% vs ₹131 Cr; ↑+37% vs ₹98 Cr)
Profit Before Tax: ₹124 Cr (→ vs ₹124 Cr; ↑+24% vs ₹100 Cr)
Profit After Tax: ₹103 Cr (↑+3% vs ₹100 Cr; ↑+18% vs ₹87 Cr)
Diluted EPS: ₹7.34 (↑+3% vs ₹7.13; ↑+18% vs ₹6.24)
✅ Strong YoY growth across key profitability metrics, especially operating and net profit—good sign of resilient operations.
🔍 Fundamental Insights
Steady Margin Expansion: Operating margin expanded sequentially and year-over-year, indicating improving operational efficiency.
Healthy Balance Sheet: Company maintains a solid cash position with no significant debt—boosting financial flexibility.
Dividend History: Announced interim/final dividend (check exchange filings) reflecting steady shareholder returns.
Product & Market Position: Strong market presence in polyvinyl chloride (PVC) coatings and insulation materials, catering to growing infrastructure and auto sectors.
📝 Conclusion
AFL India has demonstrated a classic breakout from a bullish price structure, supported by solid Q4 earnings. The stock now needs to clear and hold above ₹2,080 to confirm upside momentum. If successful, it may rally toward ₹2,400, keeping an eye on strict stop-loss near ₹1,800 or the ₹1,330–₹1,400 zone if support falters.
⚠️ Disclaimer
This report is for informational use only and not investment advice. Please do your own research or consult a financial advisor before making investment decisions.

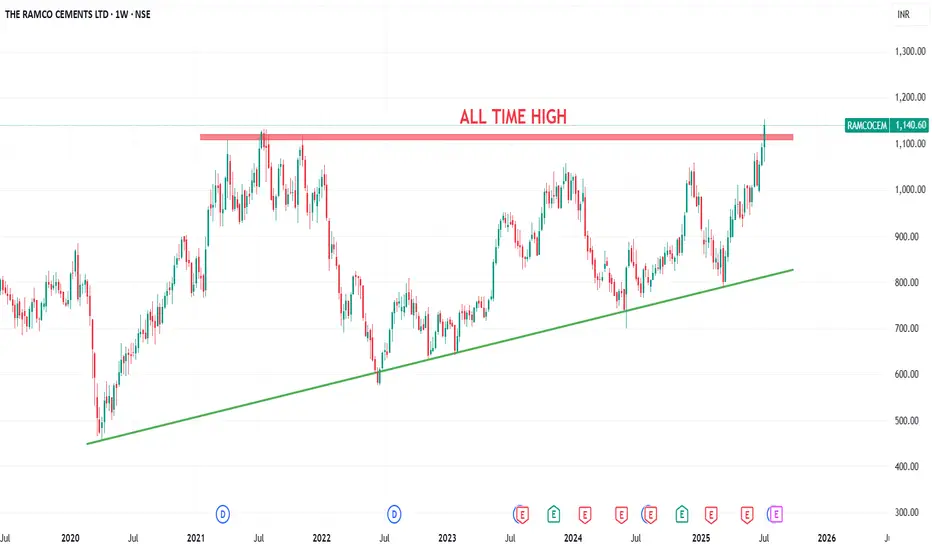
Ramco Cement Break Out Strong Is This the Start of a New Rally ?📉 Technical View:
Ramco Cement Limited has formed a beautiful ascending triangle pattern with a strong resistance zone at ₹1080–₹1130, tested since 2021. Today, it broke out and hit a new all-time high of ₹1152, now hovering around ₹1140.
If the breakout holds, we may see:
🎯 Target 1: ₹1200
🎯 Target 2: ₹1240
🎯 Target 3: ₹1300
If the stock falls back below ₹1030, the breakout becomes invalid.
💰 Q4 FY24 Financial Highlights (vs Q3 FY24 & Q4 FY23)
Total Income: ₹2397 Cr (↑+21% vs ₹1983 Cr; ↓–10% vs ₹2678 Cr)
Total Expenses: ₹2078 Cr (↑+93% vs ₹1074 Cr; ↓–8% vs ₹2259 Cr)
Operating Profits: ₹319 Cr (↑+14% vs ₹279 Cr; ↓–24% vs ₹419 Cr)
Profit Before Tax: ₹46 Cr (↓–76% vs ₹191 Cr; ↓–74% vs ₹175 Cr)
Profit After Tax: ₹26 Cr (↓–86% vs ₹182 Cr; ↓–80% vs ₹129 Cr)
Diluted EPS: ₹1.16 (↓–85% vs ₹7.72; ↓–79% vs ₹5.46)
🧾Despite strong revenue growth and higher operating profits sequentially, sharp cost escalations impacted margins in Q4.
📈 Fundamentals & Dividend Insights:
✅ Company continues with capacity expansion in East & South India.
✅ Focus on green energy & cost optimization to improve margin outlook.
💸 Dividend Declared (May 2025): ₹3.50 per share
📝 Final Word:
The breakout on charts is significant and supported by top-line improvement. If sustained, the stock may offer strong upside potential, making Ramco Cement one to watch closely.
Gujarat Industries Power Bounces Back with Strength📈 Technical Analysis
Breakout & Correction: After breaking ₹190 resistances in Jan 2024, GIPCL surged to ₹270 by June but later corrected sharply.
Strong Demand Base: ₹150 acted as a reliable bottom during the downturn, supporting a rebound into a higher-high, higher-low pattern.
Buy Trigger Zone: A breakout above ₹230–₹240 (former resistance) with bullish candlestick confirmation could unlock upward momentum toward:
🎯 Target 1: ₹250
🎯 Target 2: ₹260
🎯 Target 3: ₹270
Support Levels:
🔻Recent higher-low stop-loss around ₹190
🔻₹150 remains the critical demand zone—below this, bullish case weakens
💰 Q4 FY24 Financial Highlights (vs Q3 FY24 & Q4 FY23)
Total Income: ₹338 Cr (↑+5% vs ₹322 Cr; –9% vs ₹373 Cr)
Total Expenses: ₹219 Cr (↑+18% vs ₹196 Cr; –14% vs ₹254 Cr)
Operating Profits: ₹119 Cr (↑+34% vs ₹89 Cr; flat YoY)
Profit Before Tax: ₹86 Cr (↑+62% vs ₹53 Cr; ↑1% YoY)
Profit After Tax: ₹70 Cr (↑+79% vs ₹39 Cr; ↑6% YoY)
Diluted EPS: ₹4.49 (↑+73% vs ₹2.59; ↑2% vs ₹4.38)
📌 Sequential growth across the board—profit nearly doubled QoQ and edged higher YoY—signals improved margins and operational discipline.
🔍 Fundamental Highlights
Dividend Yield ~1.9%: Company increased annual dividend to ₹4.09 per share (40.9%) for FY25
Consistent Dividend Growth: Yield rose steadily over the past decade, backed by a healthy ~29% payout ratio
Latest Q4 Net Profit: Up 5.4% QoQ to ₹70 Cr, reflecting resilience in earnings .
Strong Cash Flow & Balance Sheet: Installed capacity ~1,184 MW with healthy leverage metrics
🧭 Conclusion
Gujarat Industries Power is showing promising signs—technically rebounding from ₹150 with strategic breakout levels at ₹230–₹240, and fundamental strengths in earnings growth and dividends. If the ₹230–₹240 zone is breached and confirmed, the stock could rally to ₹270.
⚠️ Disclaimer
This is for informational purposes only and not financial advice. Investors should perform their own research and consult a professional before investing.

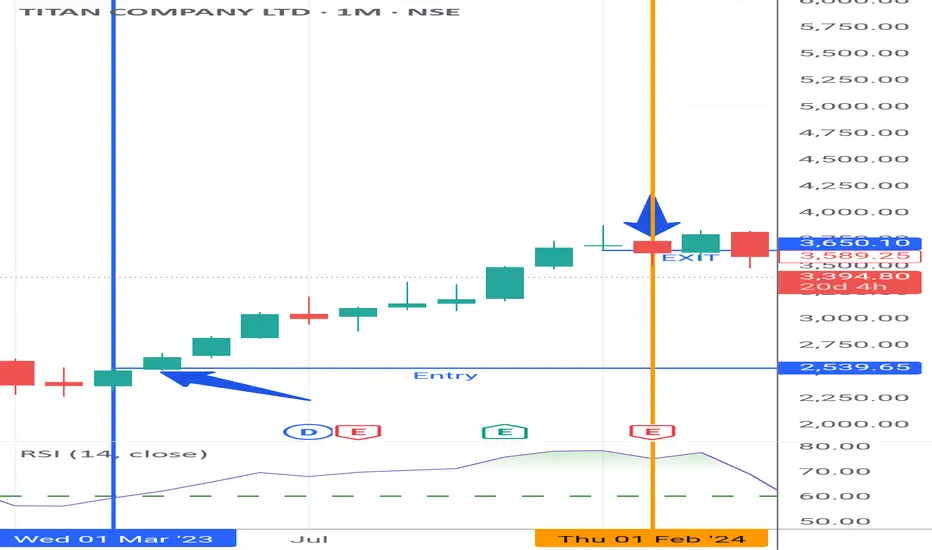
Swing and Positional Trade Setup ✅ Final Setup for Positional and Swing Trades (High Beta Liquid Stocks for Cash and Options)-
This trading guide outlines a simple and effective setup for both positional and swing trades, focused on high beta, highly liquid stocks. Follow the rules strictly for better consistency and profitability.
🔹 Positional Trade Setup
• Open the Monthly Chart of the stock.
• Add the RSI (Relative Strength Index) indicator.
• Uncheck all levels (30, 50, 70) and only keep one level at 60.
• Edit the level from 70 to 60 and highlight it in green.
Entry Criteria:
• Stock must cross the 60 RSI level on the monthly chart.
• Entry is only triggered if the price breaks the previous month's high.
Stop Loss:
• Place the initial stop loss below the previous month's low.
Trailing Stop Loss:
• Trail the stop loss to the current month’s low, but only after the monthly candle closes.
• Continue trailing the stop loss every month using this method until exit.
Exit Rule:
• Exit the positional trade only if the current month’s candle closes below the previous month’s low.
⚡ Note: The RSI 60+ setup is a powerful momentum strategy with high reward probability.
🔹 Swing Trade Setup
• Monthly RSI must cross above the 60 level.
• Switch to the Daily Chart of the stock.
• Identify the current swing high on the daily chart.
• Entry is triggered only when the stock breaks the swing high.
• Place the stop loss below the previous week low at first.
Trailing Stop Loss:
• If the trade moves in your favor, trail the stop loss to cost from week low.
Exit Rule:
• Exit the swing trade only if RSI crosses below 60 with a daily candle close.
📌 High Liquid Stocks List
(Suitable for both Cash and Options Segment)
🚗 Auto
• Bajaj Auto
• Bosch Ltd
• Eicher Motors
• Hero Motocorp
• Maruti Suzuki
• TVS Motors
• Tata Motors
🏦 Banking & Financial Services
• Bank of Baroda
• Kotak Bank
• Axis Bank
• ICICI Bank
• HDFC Bank
• IndusInd Bank
• Bajaj FinServ
• Bajaj Finance
• SBI
🧪 Chemicals
• Aarti Industries
• Atul Ltd
• Navin Fluorine
• UPL
• Tata Chemicals
🍫 FMCG
• Britannia
• Godrej Consumer
• Tata Consumer
• DMart
• Hindustan Unilever
• Dabur
💊 Pharma & Healthcare
• Apollo Hospitals
• Alkem
• Biocon
• Divis Labs
• Dr. Reddy’s
• IPCA Labs
• Laurus Labs
• Lupin
• Aurobindo Pharma
• Sun Pharma
• Cipla
💻 IT Sector
• HCL Technologies
• Infosys
• LTIM
• TCS
• Tech Mahindra
• Wipro
⛓️ Steel & Metals
• APL Apollo
• JSW Steel
• Jindal Steel
• Tata Steel
• Hindalco
• L&T
🛢️ Oil & Gas
• Reliance Industries
• Gujarat Gas
• IGL
• MGL
• Tata Power
🏢 Realty
• DLF
• Godrej Properties
• Lodha
• Oberoi Realty
• Phoenix Mills
🛋️ Durables & Others
• Sona BLW (Sonacoms)
• Amber Enterprises
• Bata India
• Crompton
• Dixon Technologies
• Titan
• ACC Cement
• Ambuja Cement
• Ultratech Cement
• Voltas
• Polycab
• Mazdock
• Asian Paints
• Berger Paints
📝 Conclusion
This is the final and simplified setup designed for traders looking for clarity and consistency in trading. No complicated indicators or confusing rules—just clean chart action with momentum logic. Please don't trade Intraday and Index options - its a TRAP.
FarazT
Sr. Equity Research Analyst
BUY GOLDIt is possible that there is a Buy. We should wait for confirmation before entering. If the confirmation is negative, then we should exit the trade. If the confirmation is positive, then we can enter the trade.

Gold’s Recent Movement and Market SentimentXAUUSD: Gold Bounces Strongly From the Bottom, Is This the Start of a New Uptrend?
🌍 Macro Overview – Gold’s Recent Movement and Market Sentiment
Gold recently experienced a strong bounce from the 3.282 USD/oz low, reaching up to 3.317 USD/oz. This move has sparked some optimism, but let’s take a look at the key macro factors that might be affecting gold:
📉 US bond yields have dropped, signaling that market risk aversion is starting to return
💵 The USD remains strong, but buying interest for gold in Asia is increasing, as confidence in fiat currencies begins to wane
🇪🇺 The EU is pushing ahead with negotiations with the US on tariffs before the August 1st deadline. If these talks break down, gold could benefit significantly
🏦 The Fed is maintaining interest rates, but the market is betting that cuts could come in September if inflation remains under control
📊 US unemployment data and the Fed’s speech tonight will be key, with the market waiting anxiously for clues on the Fed’s next move
📊 Technical Analysis – Gold Approaching Key Resistance Zones
Gold is trading within a descending channel, but signs of a breakout are emerging after a solid test of the bottom.
Key resistance levels are around 3330 – 3340, and these will be crucial in determining whether gold can continue its upward momentum.
Fair Value Gap (FVG) has appeared between 3310 – 3320, which suggests that if buying pressure remains, a breakout could be on the horizon.
🎯 Trading Strategy for Today – Focused on Clear Entry Points
🟢 BUY SCALP:
Entry: 3310 – 3308
SL: 3304
TP: 3314 → 3318 → 3322 → 3326 → 3330
🔵 BUY ZONE (safer entry points):
Entry: 3290 – 3288
SL: 3284
TP: 3294 → 3298 → 3302 → 3306 → 3310 → 3320 → 3330
🔴 SELL SCALP (if price hits resistance levels):
Entry: 3335 – 3337
SL: 3342
TP: 3330 → 3325 → 3320 → 3315 → 3310 → 3300
⚫ SELL ZONE (strong resistance at 3360-3362):
Entry: 3360 – 3362
SL: 3366
TP: 3356 → 3352 → 3348 → 3344 → 3340 → 3336 → 3330
📌 Note:
Always place SL and TP to protect your account, especially in a market that may experience significant volatility.
Monitor the volume from London and New York sessions for clearer market direction. A strong breakout above resistance could signal the start of a new uptrend.
💬 Gold has bounced strongly, but is this the start of a larger rally, or just a brief pullback? What do you think about today’s potential trend? Share your thoughts in the comments below!

NDRAUTO Price Action#### Current Price and Performance
- **NDR Auto Components** is trading near ₹1,050–₹1,100 as of July 9, 2025, after a recent pullback from its all-time high of ₹1,191 set earlier in the month.
- The stock has delivered an exceptional one-year return of over 135%, with a three-month gain of more than 70%.
- Recent price action shows high volatility, with swings of 7–11% on certain days and a short-term correction of about 8% in the past week.
- Over the past month, the stock is down about 2–3%, reflecting some profit booking after a rapid rally.
#### Trend and Technical Overview
- The medium-term trend remains positive, supported by robust earnings growth and strong momentum.
- Technical indicators suggest the stock is consolidating after reaching overbought levels, with support seen near ₹1,000 and resistance around ₹1,150.
- The stock’s volatility is elevated, and its beta is above 2, indicating higher sensitivity to market movements.
#### Valuation and Financial Metrics
- NDRAUTO trades at a premium, with a price-to-book ratio above 8 and a price-to-earnings multiple reflecting high growth expectations.
- The company’s market capitalization is approximately ₹2,500 crore.
- Return on equity (ROE) is strong, around 19–23%, and return on capital employed (ROCE) is above 20%.
- Net profit for FY25 rose nearly 38% year-on-year to over ₹53 crore, with revenue up 18% to about ₹713 crore.
- Operating margins have improved to nearly 11%, and earnings per share (EPS) for the year is above ₹22.
- The dividend yield is modest at 0.26%, with a payout ratio around 12%.
#### Market Sentiment and Outlook
- Market sentiment remains positive, with the company consistently reporting record profits and sales.
- Analysts highlight the company’s efficient operations, strong order book, and improving profitability.
- The recent correction is seen as a healthy consolidation after a sharp rally, though further volatility is likely in the short term.
- The long-term outlook is favorable, supported by ongoing growth in the auto components sector and the company’s expanding market share.
#### Summary
NDRAUTO has delivered outstanding returns over the past year, driven by robust financial performance and strong sector momentum. The stock is currently consolidating after hitting record highs and remains highly volatile. While valuations are elevated, the company’s growth trajectory and operational efficiency support a positive outlook for medium- to long-term investors. Short-term caution is warranted due to recent volatility and profit booking.

Market will give a good opportunity soon. But stay cautious tillSo as we analyzed yesterday "Smart Money is Booking Profit on Every Bounce" we got more than 100 points drop in $NSE:NIFTY. And that gave us a supply candle today.
We will see a more downside. But tomorrow's expiry can give us a sideway day.
Before than Earning Season market will reset itself and many stocks will be forming The Earning Pivot.
Be cash Ready. Do not deploy money in market on any impulsive trade. you gonna get a very good opportunity soon.
The next support for Nifty will be at 25222. The Resistance we gonna face at 25335.
However, individual stocks where Smart Money is flowing, will keep giving good blasts. But that too should be used only for trading and not holding for short term.
#Tyre industry looking awesome. I mean, just look at $BSE:GOODYEAR.
NSE:BANKNIFTY also giving same vibes as Nifty.
Support fir intraday stays at 57004. If that breaks than 56704 will be next stop. Resistance at 57303.
If you are a new trader, this is time to take a pause and learn a proper setup and right timing entry.
That will be all for the day. Avoid margin trading at any cost. Use tight SLs in positions.
Take care. have a profitable tomorrow.

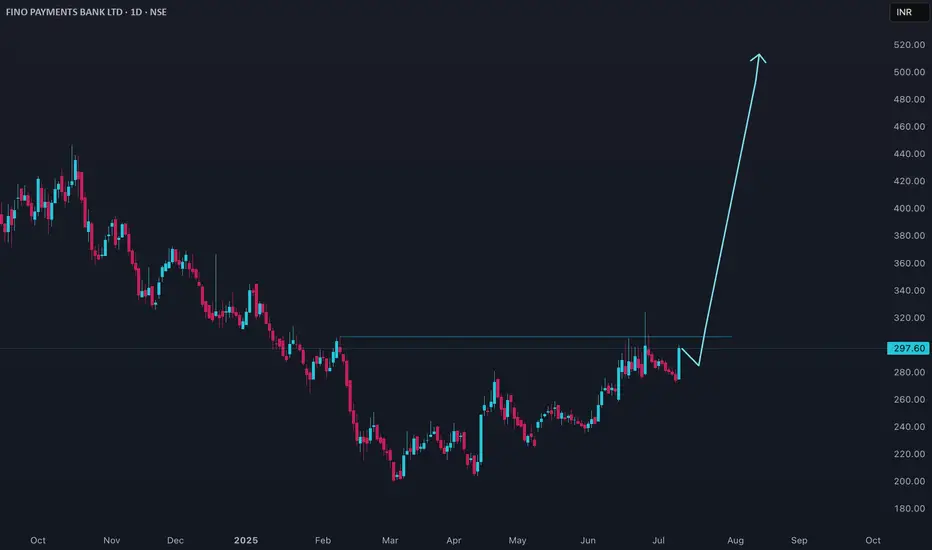
FINOPB Price Action#### Current Price and Performance
- **Fino Payments Bank (FINOPB)** is trading around ₹274–₹278 as of July 8–9, 2025.
- The stock has seen a recent high of ₹300 and a low of ₹274.95 in the latest trading sessions.
- Over the past month, the price has declined from the ₹286–₹290 range, with a notable drop from its 52-week high of ₹467.
- The 52-week low stands at ₹200, highlighting significant volatility in the past year.
#### Trend and Technical Overview
- The short-term trend is **negative**, with the stock slipping about 4% over the past week and nearly 7% in the last month.
- Volumes are robust, with daily trading often exceeding 1.5 million shares, indicating high market participation and speculative interest.
- The stock is currently trading closer to its lower circuit limit than its upper circuit, reflecting bearish sentiment.
#### Valuation and Financial Metrics
- FINOPB is priced at a **low price-to-earnings (P/E) and price-to-book (P/B) ratio**, though exact values are not meaningful due to inconsistent profitability.
- The trailing twelve-month (TTM) earnings per share (EPS) is positive and has grown 7.3% year-on-year.
- The market capitalization is around ₹2,477 crore.
- Dividend yield is 0%, and the company has not announced any dividends recently.
#### Market Sentiment and Outlook
- Sentiment is cautious, with the stock underperforming the sector and broader indices in 2025.
- The price action reflects ongoing concerns about growth visibility and profitability, despite some improvement in recent quarters.
- The stock is viewed as a high-risk, high-volatility play, with traders dominating activity rather than long-term investors.
#### Summary
FINOPB is in a corrective phase, trading near the lower end of its yearly range after a sharp decline from its highs. While trading volumes are high and EPS has shown some growth, the lack of dividends and inconsistent profitability weigh on sentiment. Investors should remain cautious, as the stock’s volatility and weak trend suggest further downside risk unless there is a clear improvement in fundamentals.
Gold Struggle – Bearish Grip Tightens Near ₹77,500Unless the price decisively closes above ₹78,000–₹78,200, the current movement should be considered a pullback within a larger downtrend. A renewed breakdown below ₹77,400 may trigger fresh selling pressure, with the next key downside level likely near ₹76,900.
Trend: Bearish
Resistance: ₹78,000 – ₹78,200
Support: ₹77,400 → ₹76,900
Bearish unless price reclaims ₹78,200 with strength