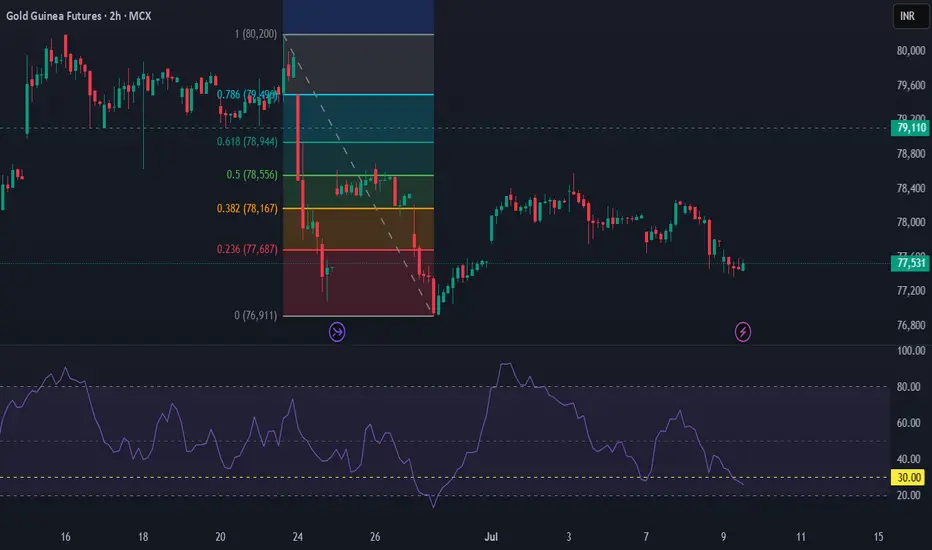
Gold Struggle – Bearish Grip Tightens Near ₹77,500Unless the price decisively closes above ₹78,000–₹78,200, the current movement should be considered a pullback within a larger downtrend. A renewed breakdown below ₹77,400 may trigger fresh selling pressure, with the next key downside level likely near ₹76,900.
Trend: Bearish
Resistance: ₹78,000 – ₹78,200
Support: ₹77,400 → ₹76,900
Bearish unless price reclaims ₹78,200 with strength
Fundamental Analysis
Swing & Positional Trade - Momentum Trading - RSI 60 Monthly📌 Simple Positional Trading Strategy for Beginners & Intermediate Traders
Over the years, I’ve explored and tested a variety of advanced trading strategies. However, I’ve come to realize that for beginners and traders with 2–3 years of experience, complex strategies can often lead to confusion and unnecessary risk. To address this, I’m sharing a straightforward and effective positional strategy that operates solely on the monthly time frame—eliminating the noise of intraday volatility and focusing purely on major institutional trends.
🔹 Strategy Name:
Positional/Swing RSI Breakout – Cash or Options (Excludes Futures)
This method is tailored specifically for cash market positions or options trades (for those familiar with managing them). Futures are intentionally excluded to reduce leverage-related risks and complexity for new and learning traders.
✅ Strategy Rules
• Time Frame: Monthly Candlestick
• Indicator Used: RSI (Relative Strength Index)
📥 Entry Conditions:
• Monitor for RSI crossing above the 60 level on the monthly chart – this indicates strong bullish momentum.
• Once RSI is > 60, mark the high of the previous month’s candle.
• Place a buy order just above the previous month’s high.
•
🔒 Stop Loss:
• Set the stop loss just below the previous month’s low.
Trail your stop loss to the low of each month after closing of that monthly candle.
📤 Exit Conditions:
• Exit the trade only if a full monthly candle closes below the previous month’s low.
• Ignore daily price fluctuations—this strategy is built for positional swing trading, not short-term moves.
💡 Note for Options Traders:
If trading via options, ensure you exit your position before monthly expiry to avoid time decay and liquidity issues. If you're unfamiliar with options mechanics, it is advisable to stick with cash market trades.
📋 Stock Universe:
A curated list of 30–50 high-beta, highly liquid stocks is provided below for your assistance. These stocks:
• Offer consistent volume and volatility
• Are widely tracked by institutions
• Provide clean price action suited for both cash and options trades
🤝 Support & Queries:
If you have questions regarding execution, stock selection, position sizing, or risk management, feel free to reach out.
🔁 Final Thoughts:
Trading success doesn’t come from complexity—it comes from consistency, clarity, and discipline. Follow the process, manage your risks wisely, and let the strategy do its work.
Wishing you profitable trades and steady growth!
Please share this content with as many traders as possible and become a successful trader like PRO.
High Beta and Liquid Stocks List:-
🚗 Auto:
Bajaj-Auto, Balkrisind, Bharatforg, Boschltd, Eichermot, Exideind, Heromotoco, Mrf, M&M, Maruti, Motherson, Tvsmotor, Tatamotors, Tiindia
🏦 Banking & Financial Services:
Axis Bank Ltd., Bank Of Baroda, Canara Bank, Federal Bank Ltd., Hdfc Bank Ltd., Icici Bank Ltd., Idfc First Bank Ltd., Indusind Bank Ltd., Kotak Mahindra Bank Ltd., Punjab National Bank, State Bank Of India, Bajaj Finance Ltd., Bajaj Finserv Ltd., Cholamandalam Investment And Finance Company Ltd.
⚗️ Chemicals:
Aarti Industries Ltd., Atul Ltd., Bayer Cropscience Ltd., Chambal Fertilizers & Chemicals Ltd., Coromandel International Ltd., Deepak Nitrite Ltd., Gujarat Fluorochemicals Ltd., Gujarat Narmada Valley Fertilizers And Chemicals Ltd., Himadri Speciality Chemical Ltd., Linde India Ltd., Navin Fluorine International Ltd., Pcbl Chemical Ltd., Pi Industries Ltd., Pidilite Industries Ltd., Srf Ltd., Solar Industries India Ltd., Sumitomo Chemical India Ltd., Tata Chemicals Ltd., Upl Ltd.
🛍️ FMCG:
Britannia Industries Ltd., Colgate Palmolive (India) Ltd., Dabur India Ltd., Emami Ltd., Godrej Consumer Products Ltd., Hindustan Unilever Ltd., Itc Ltd., Marico Ltd., Nestle India Ltd., Patanjali Foods Ltd., Radico Khaitan Ltd., Tata Consumer Products Ltd., United Breweries Ltd., United Spirits Ltd., Varun Beverages Ltd., Dmart
💊 Pharma & Healthcare:
Abbott India Ltd., Alkem Laboratories Ltd., Apollo Hospitals Enterprise Ltd., Aurobindo Pharma Ltd., Biocon Ltd., Cipla Ltd., Divi's Laboratories Ltd., Dr. Reddy's Laboratories Ltd., Fortis Healthcare Ltd., Glenmark Pharmaceuticals Ltd., Granules India Ltd., Ipca Laboratories Ltd., Laurus Labs Ltd., Lupin Ltd., Mankind Pharma Ltd., Max Healthcare Institute Ltd., Sun Pharmaceutical Industries Ltd., Syngene International Ltd., Torrent Pharmaceuticals Ltd., Zydus Lifesciences Ltd.
💻 IT & Tech:
Coforge Ltd., Hcl Technologies Ltd., Infosys Ltd., Ltimindtree Ltd., Mphasis Ltd., Oracle Financial Services Software Ltd., Persistent Systems Ltd., Tata Consultancy Services Ltd., Tech Mahindra Ltd., Wipro Ltd.
⚒️ Metals:
Apl Apollo Tubes Ltd., Adani Enterprises Ltd., Hindalco Industries Ltd., Hindustan Copper Ltd., Hindustan Zinc Ltd., Jsw Steel Ltd., Jindal Stainless Ltd., Jindal Steel & Power Ltd., Lloyds Metals And Energy Ltd., Nmdc Ltd., National Aluminium Co. Ltd., Steel Authority Of India Ltd., Tata Steel Ltd., Vedanta Ltd., Welspun Corp Ltd.
🏙️ Realty:
Anant Raj Ltd., Brigade Enterprises Ltd., Dlf Ltd., Godrej Properties Ltd., Macrotech Developers Ltd., Oberoi Realty Ltd., Phoenix Mills Ltd., Prestige Estates Projects Ltd., Raymond Ltd., Raymond Realty Ltd., Sobha Ltd.
🧱 Durables & Cement and Oil Gas:
Amber Enterprises India Ltd., Bata India Ltd., Blue Star Ltd., Century Plyboards (India) Ltd., Cera Sanitaryware Ltd., Crompton Greaves Consumer Electricals Ltd., Dixon Technologies (India) Ltd., Havells India Ltd., Kajaria Ceramics Ltd., Kalyan Jewellers India Ltd., Pg Electroplast Ltd., Titan Company Ltd., V-Guard Industries Ltd., Voltas Ltd., Whirlpool Of India Ltd., Acc, Ambuja Cements, Ultratech Cement, Shree Cements, Jk Cement, Reliance.
For Swing Trading on Daily Charts -
Check Monthly RSI crossed 60 level.
Daily must cross 60 level too.
Enter upon previous Day high.
First stop loss below previous Day candle low. Then trail it to current low until the current Day candle gives closing below previous Day low.
High Growth Momentum Strategy.

BUY TODAY SELL TOMORROW for 5%DON’T HAVE TIME TO MANAGE YOUR TRADES?
- Take BTST trades at 3:25 pm every day
- Try to exit by taking 4-7% profit of each trade
- SL can also be maintained as closing below the low of the breakout candle
Now, why do I prefer BTST over swing trades? The primary reason is that I have observed that 90% of the stocks give most of the movement in just 1-2 days and the rest of the time they either consolidate or fall
Cup and Handle Breakout in SWSOLAR
BUY TODAY SELL TOMORROW for 5%

GRSE Price Action
#### Current Price and Performance
- **GRSE** is trading near ₹2,965–₹2,974 as of July 9, 2025, after a recent dip from its 52-week high of ₹3,538.
- Over the past year, the stock has delivered a return of approximately 9%, with a sharp rally in the past three to six months (up about 81–84% during that period).
- The stock has shown high volatility, with a notable correction of nearly 13% in the last month and a 4.5% decline in the last week.
#### Trend and Technical Overview
- **Medium-term trend** remains positive, supported by strong order inflows and robust financials, but the recent correction suggests some profit booking and consolidation after a rapid upmove.
- Technical indicators reflect heightened volatility, with the stock pulling back from overbought levels.
- The stock is trading at a high price-to-earnings (P/E) ratio of about 64 and at 16 times its book value, indicating premium valuation.
#### Valuation and Financial Metrics
- **Market capitalization** is around ₹34,000 crore.
- **Return on equity (ROE)** stands at 28%, and **return on capital employed (ROCE)** is 37%, both indicating efficient use of capital.
- **Dividend yield** is modest, around 0.3–0.5%.
- The company is nearly debt-free and has delivered strong profit growth (CAGR of 26% over five years).
- Revenue and profit have grown significantly, with FY25 revenue at ₹5,076 crore and net profit at ₹527 crore.
- Operating margins have improved to 8%, and the company maintains a healthy dividend payout ratio of about 30%.
#### Market Sentiment and Outlook
- Sentiment remains positive, given GRSE’s strategic role in defense shipbuilding and a strong order book.
- Analysts highlight the company’s consistent financial performance and leadership in its sector, though caution is advised due to high valuation multiples.
- The recent correction may offer a better entry point, but further consolidation or volatility is possible in the short term.
#### Summary
GRSE has delivered strong medium-term returns, underpinned by robust financials, sector leadership, and efficient capital management. The stock is currently consolidating after a sharp rally and is trading at premium valuations. While the long-term outlook remains positive, investors should be mindful of recent volatility and elevated price multiples when considering new positions.

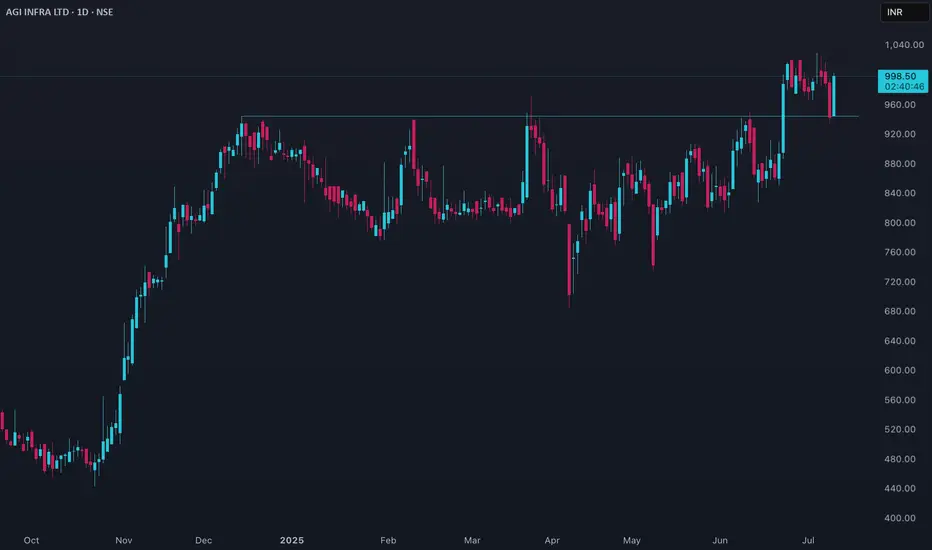
AGIIL Price Action#### Current Price and Performance
- AGI Infra Ltd (AGIIL) is trading near ₹990–₹1,000 as of early July 2025.
- The stock touched a 52-week high of around ₹1,030 and a low near ₹328, showing a strong upward trend over the past year.
- Over the last year, AGIIL has delivered a return of more than 115%, significantly outperforming broader market indices and sector peers.
- Short-term performance remains robust, with the stock up over 18% in the past month and about 31% in the last three months.
- The stock has shown notable volatility, with weekly price movements averaging around 9%.
#### Trend and Technical Overview
- The medium-term trend is positive, supported by strong price momentum and investor interest.
- Technical indicators suggest the stock is not in the overbought zone, but recent price action has been volatile, with some profit booking observed after the recent rally.
- The stock’s beta is high, indicating greater sensitivity to market movements compared to the broader market.
#### Valuation and Financial Metrics
- AGIIL trades at a price-to-earnings (P/E) ratio of about 34–36 and a price-to-book (P/B) ratio near 4.5–10.7, which is higher than sector averages, reflecting premium valuations.
- The dividend yield is low, around 0.05–0.11%, making it less attractive for income-focused investors.
- The company’s earnings per share have grown steadily, with recent annual EPS exceeding ₹27.
- Return on equity (ROE) and return on capital employed (ROCE) remain strong, both above 25%, indicating efficient use of capital.
- Revenue and profit growth have been solid, with revenues up over 21% year-on-year and operating margins above 25%.
- The company’s debt-to-equity ratio has improved, now at a comfortable level below 40%.
#### Market Sentiment and Outlook
- Market sentiment is positive, with increased retail investor holdings and stable promoter ownership.
- AGIIL is considered one of the top-performing small-cap stocks in its sector, although some analysts note that growth rates have moderated recently.
- The stock is viewed as overvalued by some metrics, suggesting limited immediate upside unless earnings growth accelerates further.
- Risks include high valuation multiples, recent volatility, and a slowdown in quarterly profit and revenue growth.
- The long-term outlook remains favorable, supported by a strong project pipeline and consistent financial performance, but short-term caution is warranted due to recent rapid price appreciation.
#### Summary
AGIIL has delivered exceptional returns over the past year, driven by strong fundamentals and investor optimism. While the company maintains solid profitability and growth, its valuation is elevated and recent volatility suggests that investors should be cautious about new entries at current levels. The stock remains attractive for those with a medium- to long-term horizon, provided they are comfortable with the higher risk and volatility profile.
Is a Pullback Coming or Will the Bulls Continue?Gold Faces Resistance at 3300 – Is a Pullback Coming or Will the Bulls Continue?
Market Overview: USD Gains Pressure Gold as Trade Deals Unfold
Gold has been under pressure recently due to the strong recovery of the US dollar. Positive developments in global trade talks and agreements between major nations, including the US, have been a key driver for the USD, which in turn has weighed on gold.
US inflation data continues to show signs of easing, providing the Fed more room to hold off on rate hikes, strengthening the USD.
FOMC meeting minutes due this week will provide further insight into the Fed’s approach to interest rates.
With geopolitical tensions easing and trade deals stabilizing, the demand for safe-haven assets like gold is slightly reduced.
In the short-term, the market is testing crucial levels, and while gold remains bullish in the long run, the current market conditions suggest potential for a pullback before further upside.
Technical Analysis: Gold in a Range-Bound Market
Looking at the H1 timeframe, gold has formed a clear downward channel between 3360 and 3290, which could signal further corrective action if the price remains within this range. If gold fails to break above resistance at 3360, a dip to 3250 might occur, especially if the USD strength continues to put pressure on gold.
However, waiting for confirmation patterns before entering a trade is key. False breakouts can be a risk when price moves quickly through key levels without sustaining momentum.
Buy Bias in Short-Term with Caution on Bearish Moves
Given the current market structure, there is more room for buy opportunities than for selling at the moment. Watch out for a potential bounce back in the 3320-3325 region as gold might test these levels before continuing its rise. The rejection wick on yesterday's D1 candle shows that the sellers are losing control, and buying pressure is starting to build again.
In the M30 chart, there's a continuation pattern forming around the 16-14 zone, which could be an ideal place to enter a buy position if it holds.
Resistance and Support Levels:
Key Resistance Levels: 3302 – 3310 – 3324 – 3335 – 3361
Key Support Levels: 3275 – 3259 – 3248
Trading Strategy – Buy and Sell Zones
BUY ZONE:
3250 – 3248
Stop Loss: 3244
Take Profit: 3254 → 3258 → 3262 → 3266 → 3270 → 3280 → ????
SELL SCALP:
3303 – 3305
Stop Loss: 3310
Take Profit: 3298 → 3294 → 3290 → 3286 → 3280 → 3270 → 3260
SELL ZONE:
3334 – 3336
Stop Loss: 3340
Take Profit: 3330 → 3326 → 3320 → 3315 → 3310 → 3305 → 3300 → ????
Key Updates to Watch: FOMC and Trade Policy News
With FOMC minutes due and trade policy developments on the horizon, it’s crucial to stay alert for any shifts in market sentiment. Ensure you stick to TP/SL levels to protect your account from any unexpected volatility.

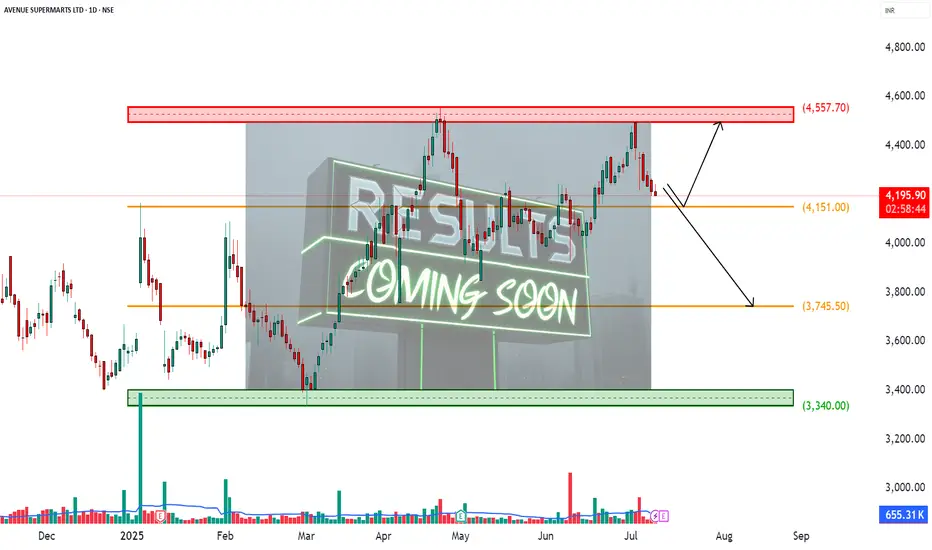
DMART – Earnings Incoming________________________________________________________________________________📈 DMART – Earnings Incoming: What’s the Right Time to Enter an Options Trade?
📆 Result Date: 11th July 2025 (Friday)
🕒 Strategy Style: Beginner + STWP HNI Learning Setup
🔍 For Educational Purposes Only
________________________________________________________________________________
🧠 What's the Setup?
DMART is announcing results on Friday, 11th July. We’re expecting a strong move — either up or down — because of mixed expectations around revenue and margins.
When you trade options around results, timing your entry is just as important as selecting the right strikes.
Let’s simplify it ⬇️ ________________________________________________________________________________✅ Option 1: Enter on 10th July (Thursday, After 2 PM)
💡 This is the ideal time for most traders.
🟢 Better option prices (not too inflated yet)
🟢 Good liquidity for smooth entry
🟢 Gives you overnight time to plan
🟢 You avoid the Friday panic crowd
🎯 STWP Suggested Strategy:
Buy 4300 CE + 4100 PE = ~₹180 total premium
This is called a Long Strangle – You win if the stock moves sharply up or down after results.
________________________________________________________________________________⚠️ Option 2: Enter on 11th July (Friday, Before 2 PM)
🔸 You might think, "Let me wait till Friday to get more clarity" — but there’s a catch:
❌ Option prices become expensive (high IV)
❌ Bid-ask spreads get wide (hard to enter)
❌ No time to react if results come intraday
❌ You’re stuck with weekend gap risk without prep
Unless you're experienced or scalping early, it’s not ideal for beginners.
________________________________________________________________________________🎯 Best Timing Rule – STWP Style:
📌 Enter on 10th July between 2:00 PM – 3:15 PM
Why?
You’ll lock in a clean setup with decent pricing and avoid stress.
📆 Exit Plan:
Hold through the weekend → Exit on Monday (14th July) if stock moves sharply 🔥
________________________________________________________________________________🧠 Alert:
Set alerts at:
₹4450 (Upside)
₹3950 (Downside)
If either hits on Monday, trail the winning side and exit the losing leg.
________________________________________________________________________________
📚 This is a learning example – not a trade recommendation.
Options carry risk. Please manage your capital and don’t trade blindly.
________________________________________________________________________________⚠️ Disclaimer (Please Read):
• This chart is shared for educational purposes only and is not investment advice.
• I am not a SEBI-registered advisor.
• The information provided here is based on personal market observation.
• No buy/sell recommendations are being made.
• Please do your own research or consult a registered financial advisor before making any trading decisions.
• Trading involves risk. Always use proper risk management.
________________________________________________________________________________
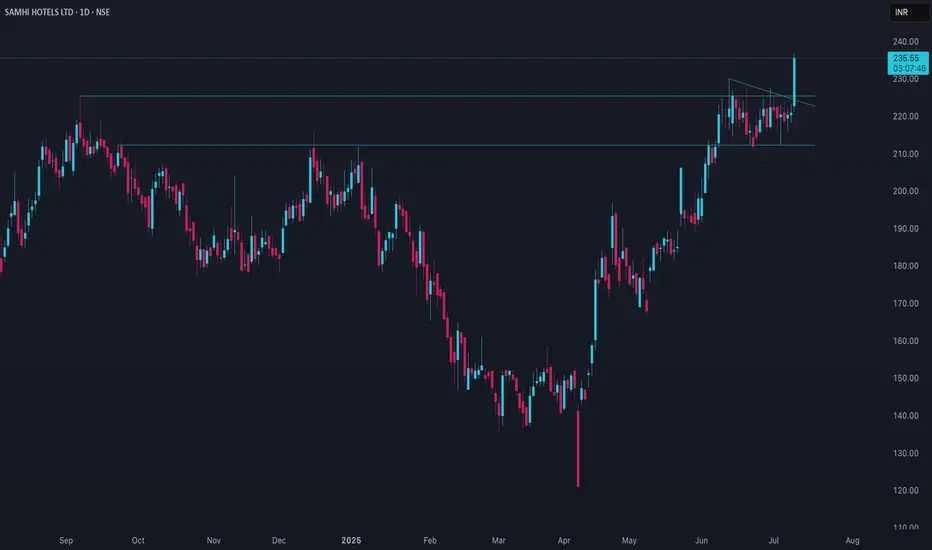
SAMHI Price action#### Current Price and Performance
- SAMHI Hotels is trading around ₹220–₹221 as of early July 2025.
- The stock has moved between a 52-week high of approximately ₹238 and a low near ₹121.
- Over the past year, the stock has delivered a return of about 15–16%, with a moderate uptrend since its listing.
- Short-term price action has been stable, with minor fluctuations and a slight upward bias in recent weeks.
#### Trend and Technical Overview
- The medium-term trend is positive, supported by strong operational results and improving financials.
- Technical indicators show a bullish outlook, with moving averages and MACD supporting upward momentum, though some caution is advised due to a slightly overbought RSI.
- The stock has shown resilience even during broader market volatility, outperforming major indices over the past year.
#### Valuation and Financial Metrics
- SAMHI has reported a significant turnaround, moving from losses to profitability in FY25.
- Revenue for FY25 rose to over ₹1,130 crore, with operating profit margins improving to nearly 36%.
- Net profit margin has increased sharply, and earnings per share turned positive after several years of losses.
- The company’s debt profile has improved, with a lower net debt-to-EBITDA ratio, and strong institutional holdings support the valuation.
- The stock is considered expensive on some valuation metrics, reflecting high growth expectations.
#### Market Sentiment and Outlook
- Analyst sentiment is generally positive, with target prices suggesting potential upside of 25–30% from current levels.
- The company’s robust order book, successful strategic partnerships, and expansion into high-demand markets are seen as key growth drivers.
- Risks include high valuation multiples and execution challenges in a competitive hospitality sector.
- The long-term outlook remains favorable, with expectations of continued revenue and profit growth as the company leverages its portfolio and operational strengths.
#### Summary
SAMHI Hotels has demonstrated a strong recovery, transitioning to profitability and delivering robust revenue growth. The stock has outperformed the broader market and is supported by positive analyst sentiment and institutional interest. While valuations are high, the company’s improving fundamentals and growth prospects make it attractive for investors with a medium- to long-term horizon. Caution is warranted in the short term due to potential volatility, but the overall trajectory remains positive.
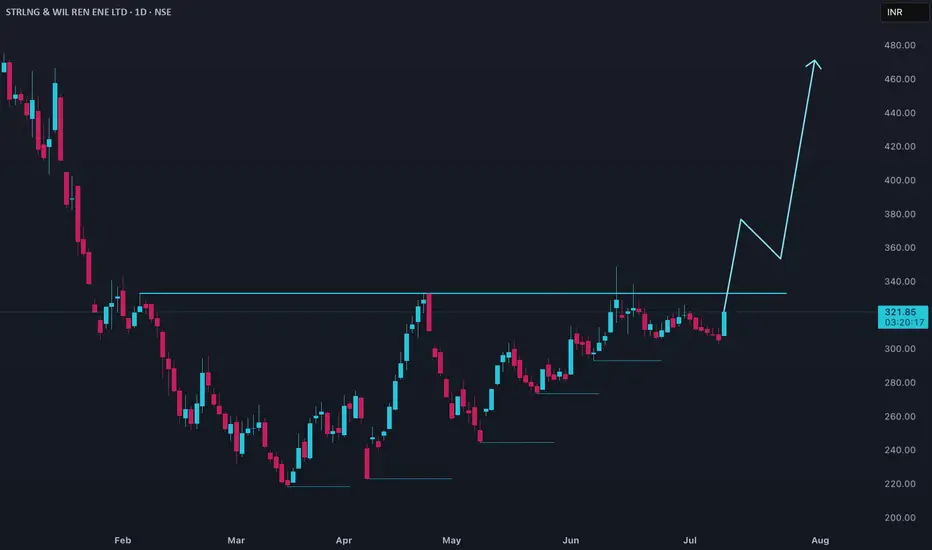
SWSOLAR Price action### SWSOLAR Price Analysis
#### Current Price and Performance
- Sterling and Wilson Renewable Energy (SWSOLAR) is trading near ₹305 as of early July 2025.
- The stock has seen significant volatility over the past year, with a 52-week high near ₹400 and a low around ₹230.
- Over the last month, the stock delivered a modest gain of about 1.5%, while in the last three months, it rebounded strongly with a return of nearly 25%.
- Despite recent gains, the one-year return is sharply negative, down over 50%, reflecting a challenging period for the company.
#### Trend and Technical Overview
- The medium-term trend shows a recovery from earlier lows, supported by improved financial results and order inflows.
- Short-term price action indicates consolidation, with the stock trading in a narrow range after a recent rally.
- Technical indicators suggest resistance around ₹320–₹330, with support near ₹290.
#### Valuation and Financial Metrics
- SWSOLAR trades at a high price-to-earnings (P/E) ratio above 80, indicating premium valuation despite recent earnings improvement.
- The price-to-book (P/B) ratio is above 7, which is elevated compared to sector norms.
- The company recently returned to profitability, reporting a net profit margin of about 1.3% and positive earnings per share after several loss-making quarters.
- Revenue growth has been robust, with the latest quarter showing a year-on-year increase of over 110%.
- Operating cash flow turned positive in the latest fiscal year, a significant improvement from previous negative figures.
#### Market Sentiment and Outlook
- Analyst sentiment is cautiously optimistic, with most recommendations skewed toward buying, and an average target price suggesting potential upside of over 35% from current levels.
- The company’s strong order book and improving execution are seen as key positives.
- However, high valuation multiples and recent volatility warrant caution for new investors.
- The long-term outlook depends on continued execution of large-scale projects and maintaining profitability.
#### Summary
SWSOLAR has staged a notable turnaround in recent quarters, moving from losses to profitability and delivering strong revenue growth. The stock has rebounded from its lows but remains volatile and highly valued relative to peers. Investors should monitor execution risks and broader market sentiment, as further upside may depend on sustained financial performance and sector stability.
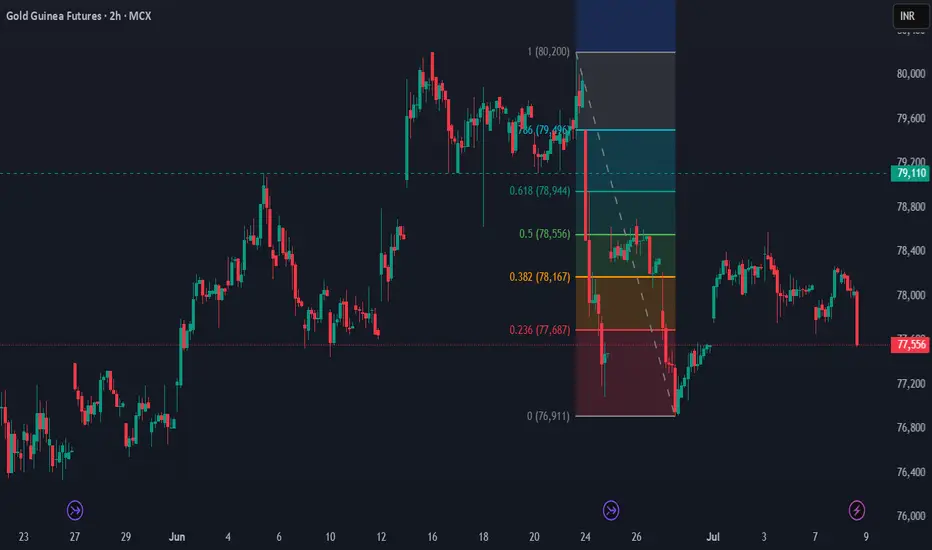
MCX Gold Guinea trend continuation to the downsideBreakdown confirmed below ₹77750; momentum favours bears with potential downside toward ₹76900. Bias remains bearish, and buyers must wait for a clear reversal signal before stepping in.
Assuming the mindset of Warren Buffett, let us evaluate BSE Ltd.📊 1. Understand the Business (Circle of Competence)
BSE Ltd. is one of India’s two major stock exchanges (along with NSE). It earns revenue from:
Listing fees
Transaction/clearing charges
Data dissemination
Subsidiary businesses (e.g., mutual funds, SME platform)
🔍 Buffett View:
The stock exchange business is a monopoly-like, high-moat business with few players.
It benefits from network effects – more listings attract more investors and vice versa.
It has low capital requirements to grow and high operating leverage – very Buffett-friendly traits.
📈 2. Financial Health (Conservative Analysis)
Let’s assume a financial breakdown based on known fundamentals (recent as of 2024-25):
| Metric | Value | Buffett Interpretation |
| ---------------------- | ---------------------- | ----------------------------------------------- |
| ROE (Return on Equity) | >20% | Excellent – Indicates efficient use of capital |
| Debt-to-Equity Ratio | Close to 0 | Strong – Buffett avoids debt-heavy firms |
| Free Cash Flow | Positive, consistent | Good – Buffett loves cash-generating businesses |
| Dividend Yield | 1.5%–2.5% | Moderate, not key, but shows surplus cash |
| Earnings Growth | CAGR \~20–25% (recent) | Promising – but must sustain organically |
🔍 Buffett prefers stable and predictable earnings, and BSE shows that in its core exchange business, though it remains sensitive to market cycles.
🏰 3. Economic Moat
BSE's Competitive Advantages:
Brand heritage (Asia’s oldest exchange)
Government regulations ensure limited competitors
High switching costs for existing listed companies
High margin data services, SME listings, and mutual fund platforms
🛡 Buffett’s View:
> “I want a business with a durable competitive advantage.”
> BSE fits this well.
👨💼 4. Management Quality
Buffett places immense importance on management honesty and competence.
BSE’s leadership has been conservative, focused on transparency and innovation (e.g., India INX, BSE StAR MF).
Consistent improvement in digital platforms and growing relevance in mutual fund distribution indicates forward-thinking leadership.
✅ Buffett’s View: Passes the integrity and competency test.
🌏 5. Industry Outlook
Indian capital markets are expanding.
Retail participation, SIP inflows, and startups going public will grow exchange volume.
Fintech and tech listings offer upside.
Regulatory tailwinds from SEBI are improving transparency and scale.
📘 Buffett likes industries with tailwinds, and Indian capital markets are structurally growing.
📉 6. Technical Entry (Buffett seldom uses technicals but we’ll blend it)
> "Price is what you pay. Value is what you get."
Looking at the Fibonacci retracement levels from the chart:
CMP: ₹2,456.70
38.2% Level: ₹2,337.15 →Potential entry zone
50% Level: ₹2,123.35 → Strong support / high conviction entry
61.8% Level: ₹1,909.50 → Ideal deep value buy (high margin of safety)
🟩 Accumulation Zone: ₹2,100 – ₹2,337
🛑 Stop-loss (Fundamental): ₹1,850 (below 61.8% retracement and key support)
🎯 Target (Intrinsic Value): ₹3,000–₹3,200 over 2–3 years (based on earnings growth)
📌 7. Intrinsic Value Estimation (Buffett’s Method)
DCF-style rough estimate:
EPS: ₹75 (assumed)
Growth: 15% CAGR (conservative)
Terminal PE: 25 (market average for strong moats)
Holding period: 5 years
Future EPS = 75 × (1.15)^5 ≈ ₹150
Target Price = 150 × 25 = ₹3,750
Present Value (with 12% discount) ≈ ₹2,120 – ₹2,350
🔎 Fair Value Range: ₹2,100–₹2,350
💵 Buy Below: ₹2,350 (for margin of safety)
✅ Final Verdict (Buffett Style Summary)
| Criteria | Verdict |
| ----------------------- | ---------------------------- |
| Understandable Business | ✅ Yes |
| Economic Moat | ✅ Strong |
| Management Quality | ✅ Trusted & Competent |
| Financial Strength | ✅ Excellent |
| Industry Tailwind | ✅ Positive |
| Intrinsic Value Range | ₹2,100–₹2,350 |
| Current Price | ₹2,456 – Slightly overvalued |
| Buy Recommendation | Wait for dip below ₹2,350 |
| Stop Loss (Soft) | ₹1,850 |
| Target (Long-Term) | ₹3,500+ |

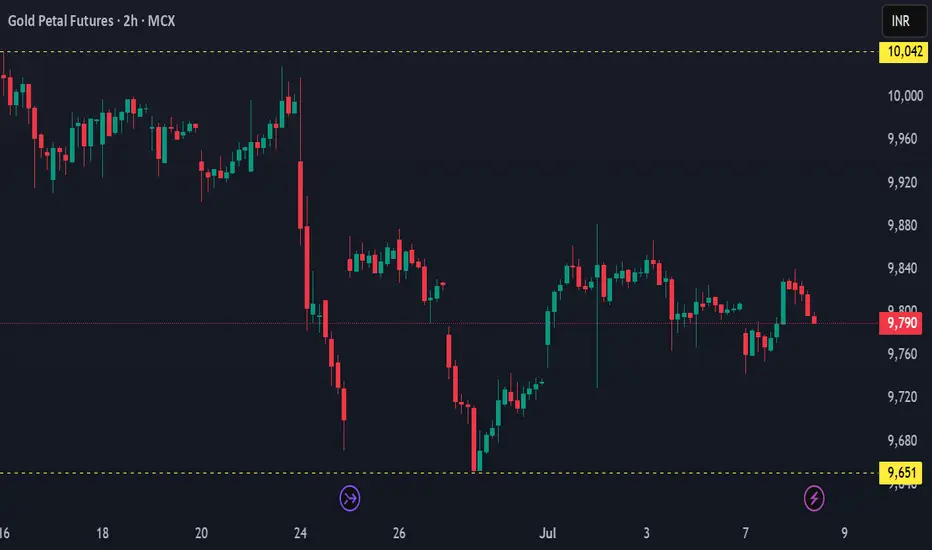
MCX GOLD Petal - market indecisionThe recent candles are choppy, with mixed direction and long wicks, reflecting market indecision and low conviction from both buyers and sellers. Price is hovering around the mid-range of the fall, indicating a range-bound structure with no clear breakout or breakdown yet. If the price breaks below ₹9740, it could retest the major support at ₹9651. Conversely, a breakout above ₹9850 with volume may invite a retest toward ₹9940 and ₹10000. Until then, the bias remains neutral-to-bearish, with volatility compressing inside a sideways band.
EURUSD LongPrice is currently in an uptrend. Price retested an orderblock and a fair value gap on the 30 min timeframe. Take profit should be set at 1.17850 and stoploss at 1.17340 and this should give you a nice 1:2 risk to reward.

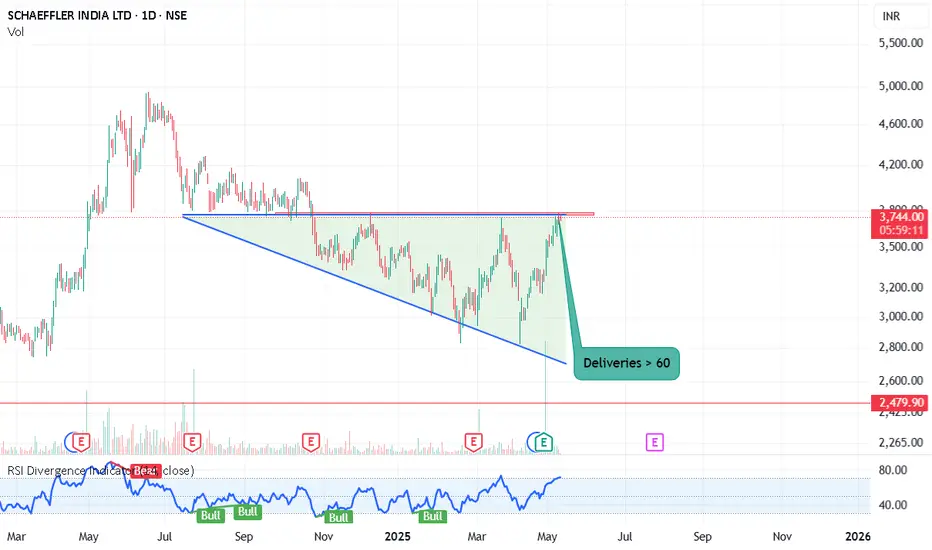
Wait for BreakoutResults are Good
Deliveries > 60
Good Fundamental
After breakout this stock will try to reach at his all time high level i.e. 5000.
This is only for educational purpose. No any trade recommendation.
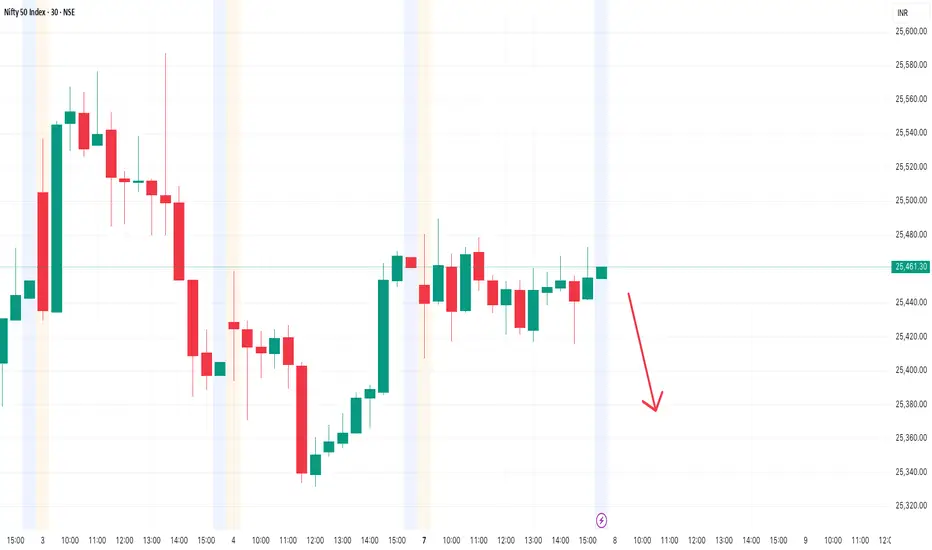
Nifty 50 8th July 2025 ( Short View )Nifty has been struggling to break above the 25,500–25,600 zone. So weakness is there on top levels. So its the best time to find short trade tomorrow for 100 points.
Also volume is not supporting for breakout right now.
View Is Only For Educational Purposes.
Buy Opportunity or A Sign of a Bigger Downtrend?Gold Reverses Below 3300 – Buy Opportunity or A Sign of a Bigger Downtrend?
🧭 Market Update: Is the Sell-Off Really That Dangerous?
Gold had a surprising reversal at the end of the US session yesterday, after a sudden sharp drop targeting the 329x liquidity zone, followed by strong buying momentum pushing the price back above this level.
When gold tested the liquidity zone below 3300, large buying volumes appeared and pushed prices above this region. Overall, the market has not yet made a clear decision for either the bulls or the bears. We are still in an accumulation phase, with liquidity sweeps happening around both highs and lows, so it's crucial for traders to stay cautious and focus on finding appropriate scalping points to enter and exit.
Short-Term Outlook: Buy Bias Takes Over Today
For today, the buy bias appears to be stronger than yesterday. Focus on buying early at continuation patterns to catch the market trend. The D1 candle from yesterday formed a wick rejection, showing that the selling pressure was absorbed and the buying momentum has returned in the short term. So, it’s important to be proactive and look for early buy opportunities.
In the M30 timeframe, a solid continuation pattern is forming in the 16-14 zone, which could be an ideal entry point for today. If the price drops further, we’ll watch for a test of the old bottom at 03-00, and we’ll wait for any strong downward momentum to confirm if the bearish trend continues. On the other hand, for those considering sell positions, caution is advised. As mentioned earlier, with yesterday’s D1 wick rejection, the SELL pressure has likely been absorbed, and BUY momentum may overpower in the next few days. Avoid rushing into sell trades prematurely.
Key Support & Resistance Levels:
Important Resistance: 3342 – 3353 – 3362 – 3381
Important Support: 3330 – 3314 – 3303 – 3295
Scalping Opportunities and Buy Zones:
BUY SCALP:
3316 – 3314
Stop Loss: 3310
Take Profit: 3320 → 3325 → 3330 → 3335 → 3340 → 3350
BUY ZONE:
3303 – 3301
Stop Loss: 3297
Take Profit: 3306 → 3310 → 3315 → 3320 → 3330 → 3340 → ????
Sell Opportunities and Caution on Bears:
SELL SCALP:
3362 – 3364
Stop Loss: 3368
Take Profit: 3358 → 3354 → 3350 → 3345 → 3340 → 3330
SELL ZONE:
3380 – 3382
Stop Loss: 3386
Take Profit: 3376 → 3372 → 3368 → 3364 → 3360 → 3350
Key Takeaway:
We are at a crucial juncture where both bulls and bears are battling for control. Will gold bounce from the support and continue its bullish momentum, or will the sellers take charge and drag prices lower? Be patient and wait for clear price action signals before entering trades.
The market is currently in an accumulation phase, so don't rush into trades. Focus on buying when clear confirmations appear at support zones and be aware of sell rejections at key resistance levels.
💬 What’s Your View on Gold Today?
Do you think gold is ready to break 3390 and continue its bullish trend? Or are we looking at a deeper correction to 3270 in the coming days?
👇 Share your analysis and thoughts in the comments below! I’d love to hear your take on where gold is heading next! Let’s discuss and refine our strategies together!

TVS Motor Near ATH Breakout Zone!📈Technical Analysis
Long-Term Rally: TVS Motor jumped from ₹100 over a decade to a peak of ₹2,958 in September 2024.
Double Bottom & Recovery: After a correction, the stock formed a strong double-bottom around ₹2,200 and rebounded, now hovering near ₹2,928—just shy of the all-time high.
Key Pivot Point: The ₹2,958 level is crucial. If this is decisively breached with strong volume and bullish candle confirmation—and then retested successfully as support—the stock may sustainably move higher toward:
🎯 Target 1: ₹3,100
🎯 Target 2: ₹3,200
🎯 Target 3: ₹3,300
Else, without a clean breakout above ₹2,958, upward momentum may stall, and upside expectations remain muted.
💰Q4 FY24 Financial Highlights (vs Q3 FY24 & Q4 FY23)
Total Income: ₹11,542 Cr (vs ₹11,035 Cr; ₹9,942 Cr)
Total Expenses: ₹9,638 Cr (vs ₹9,402 Cr; ₹8,487 Cr)
Operating Profits: ₹1,904 Cr (vs ₹1,633 Cr; ₹1,455 Cr)
Profit Before Tax: ₹1,004 Cr (vs ₹908 Cr; ₹647 Cr)
Profit After Tax: ₹698 Cr (vs ₹609 Cr; ₹412 Cr)
Diluted EPS: ₹13.64 (vs ₹11.91; ₹8.15)
Strong sequential growth in both revenue and margins; PAT up ~66% YoY with improved profitability.
🔍Fundamental Insights
Stellar Q4 Growth: Net profit surged 76% YoY to ₹852 Cr on a 17% rise in revenue to ₹9,550 Cr; record EBITDA of ₹1,333 Cr (14% margin)
EV & 2W Sales Surge: FY25 EV sales up 44%, 2W & 3W combined rose 13%
Dividend Declared: ₹10 interim dividend announced for FY25 (record date: March 26)
Profit Expansion: FY25 PAT hit ₹2,711 Cr (+30% YoY); revenue reached ₹36,251 Cr (+14%)
Margin Improvement: Q4 EBITDA margin rose ~120 bp YoY to 12.5%, aided by PLI benefits and favorable product mix
Global Reach & EV Push: Exports up 24.5% to 1.25M units; EV segment (iQube e2W & e3W) growing
🧭Conclusion
TVS Motor stands squarely at a critical juncture. The compelling Q4 performance—robust profits, strong sales (especially EVs), and improved margins—builds a strong case for upside. However, the technical breakout above ₹2,958 is key:
⚡ If cleared + retested as support → bullish rally toward ₹3,100 ➝ ₹3,200 ➝ ₹3,300.
🛑 Without breakout → risk of consolidation or pullback remains.
👀 Watch volume and candlestick patterns around the all-time high level for confirmation before positioning.
Disclaimer : lnkd.in

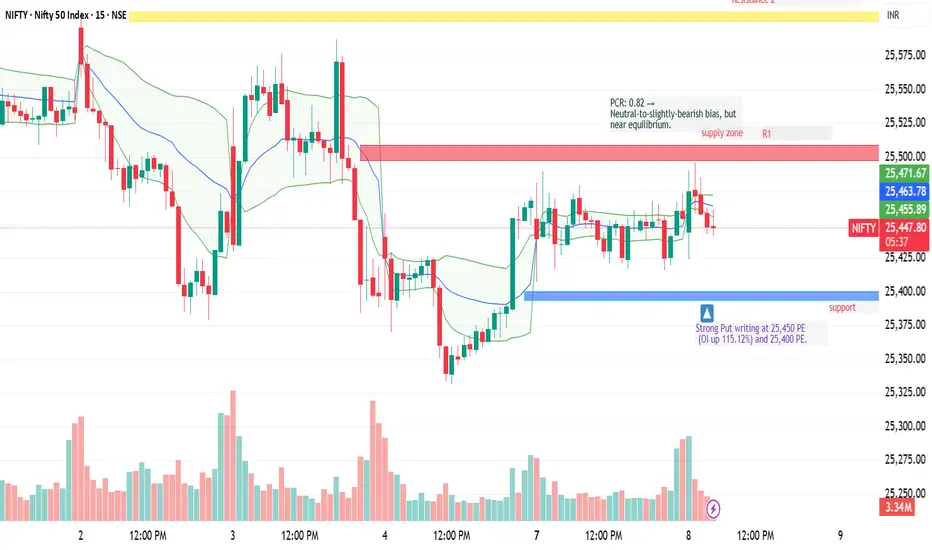
NIFTY 15-Min Chart – Volatility Compression Between VWAP and ResVWAP Zone:
The VWAP lies at 25,456–25,464, acting as a dynamic resistance zone — price has failed to sustain above this level multiple times.
Price Pattern:
Multiple small-bodied candles with wicks indicate indecision and low momentum.
This suggests volatility compression — a breakout may follow.
Bollinger Bands:
Price hugging the middle band, with slightly narrowing bands — signals range contraction.
Transrail Lighting Ltd: Strong weekly closing Cheap stock available in this sector expecting a good growth in Fy26 .

Institutional Master classOption Trading Basics
Call vs Put Options Detailed
In-the-Money (ITM), At-the-Money (ATM), Out-of-the-Money (OTM)
Options Greeks: Delta, Gamma, Theta, Vega, Rho – controlling price sensitivity.
Understanding Option Premium Breakup
Option Strategies
Single-Leg Strategies: Buying Calls, Buying Puts
Multi-Leg Strategies:
Bull Call Spread
Bear Put Spread
Iron Condor
Straddle and Strangle
Hedging Techniques: How institutions and traders use options to hedge positions.
Option Chain Analysis
Reading Option Chain Data
Open Interest (OI) & Change in OI
IV (Implied Volatility) Impact
PCR (Put-Call Ratio) Analysis for Market Sentiment

Option Trading ClassThe Institutional Trading Process is highly strategic and complex, combining deep research, advanced technology, and strict compliance. Institutions leverage their size and tools to execute efficiently without heavily impacting the market.
Introduction to Option Trading
What are Options?
Options are contracts giving the right, but not the obligation, to buy (Call) or sell (Put) an underlying asset at a predetermined price within a specific time.
Types of Options:
Call Option: Right to buy
Put Option: Right to sell
Key Terms:
Strike Price, Premium, Expiry Date, Lot Size, Intrinsic Value, Time Value

Institutional Trading 1. Investment Idea Generation
How it Starts: Analysts, portfolio managers, or quantitative teams identify potential trades based on in-depth research, financial models, or market events.
Key Drivers: Economic indicators, earnings reports, sector performance, geopolitical news, or algorithmic signals.
2. Pre-Trade Analysis and Risk Assessment
Objective: Assess liquidity, volatility, and execution risks.
Tools Used: Option chains, order books, volume profiles, VWAP (Volume Weighted Average Price), and market depth analysis.
Risk Teams: Ensure the trade aligns with the fund’s risk appetite and regulatory requirements.

Option Trading Order Strategy Design
Execution Planning: Institutions cannot place large orders directly; they split trades into smaller lots to avoid price impact.
Techniques:
Algorithmic Trading (TWAP, VWAP, Iceberg orders)
Dark Pool Execution
Block Trades via Brokers
Trade Execution
Methods: Trades are routed through brokers, electronic communication networks (ECNs), or proprietary trading desks.
Real-Time Monitoring: Institutions monitor slippage, transaction costs, and market reaction continuously.
