EUR/USD Target CompletedTarget Completed EUR/USD Market. 100% Success Fundamentals Analysis.
(Sudarshana N Adhikari)
Fundamental Analysis

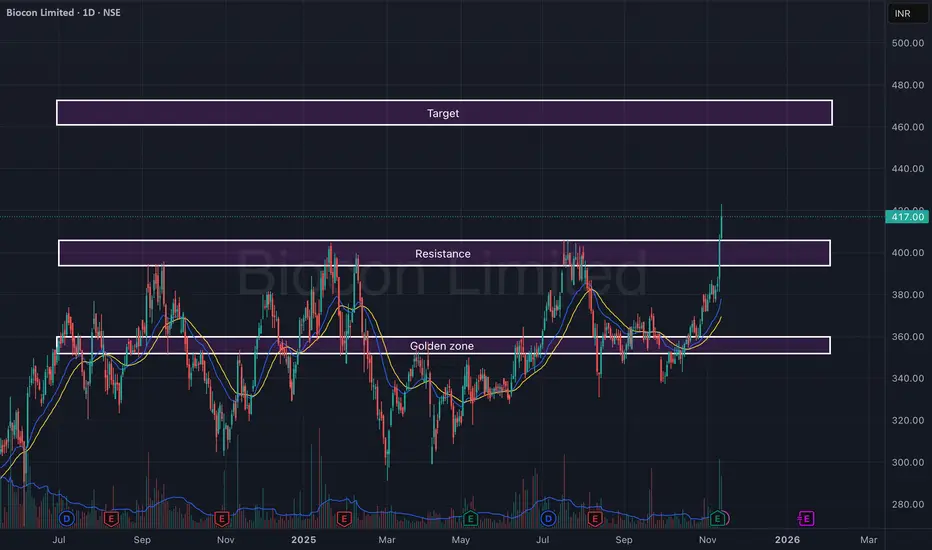
Biocon Ltd – Breakout from Resistance with Strong Volume SurgeBiocon has delivered a powerful breakout above its key resistance zone of ₹395–₹405, backed by a sharp volume expansion and strong follow-through candles. After months of consolidation within the golden zone (₹355–₹370), the stock has finally regained momentum, suggesting a potential trend reversal.
The structure now favors continuation toward the upper target zone, with EMAs aligning positively and momentum indicators supporting strength.
🎯 Key Levels:
CMP: ₹417.00 (+2.73%)
Golden Zone (Base Support): ₹355 – ₹370
Resistance (Now Support): ₹395 – ₹405
Target Zone: ₹460 – ₹475
Stop-Loss: ₹385 (on daily close basis)
📊 Technical View:
Resistance breakout with strong bullish candle and high volume.
EMA crossover (20 > 50) confirms short-term bullish trend.
Sustaining above ₹405 may lead to a momentum rally toward ₹460+.
Golden zone remains a reliable base for any pullback opportunities.
🧠 View:
Biocon has confirmed a breakout after a prolonged consolidation phase. Sustained momentum above ₹405 could lead to a steady move toward ₹470 levels in the short to medium term.
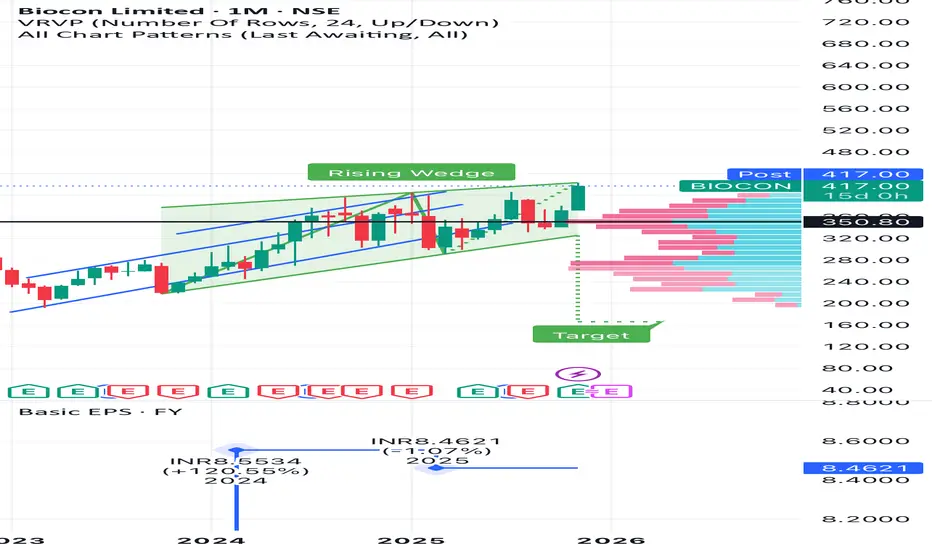
Biocon high PE , Rising wedge patternBiocon in coming days should correct to 350 rs - before it moves up . Resistance faces at 422-425 levels .
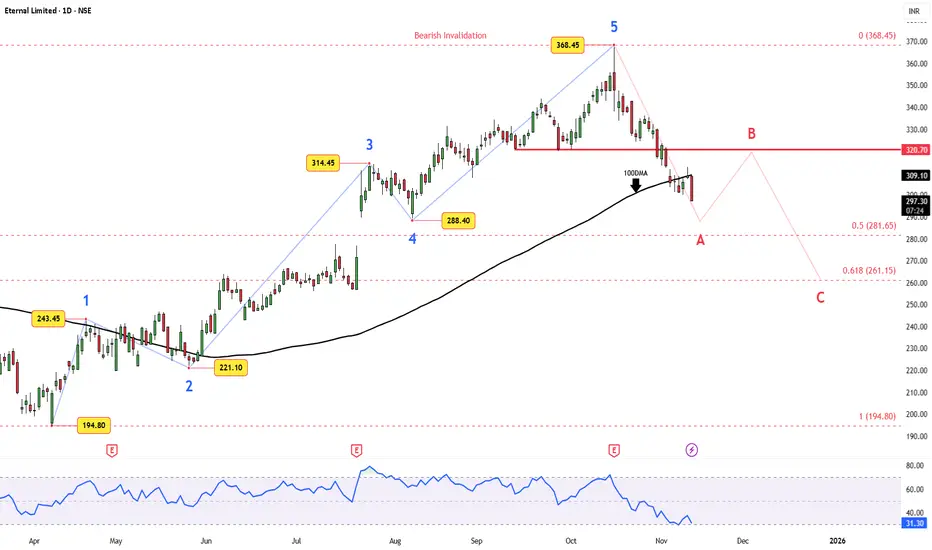
Eternal (Zomato) – 5-Wave Rally Meets a Reality CheckEternal (Zomato) appears to have completed a clean 5-wave impulse from ₹194 → ₹368.45 and is now shifting into a corrective phase.
Technical Setup:
Wave A is unfolding with price slipping below the 100DMA. A temporary Wave B rebound toward ₹320–₹325 could precede another decline toward ₹281–₹261 — aligning with 0.5–0.618 retracement levels.
The corrective bias holds unless ₹368.45 is decisively reclaimed.
Fundamental Snapshot:
The FY25 data shows revenue growth of 67% YoY , reaching ₹202.4B — impressive, but free cash flow plunged 82% , and long-term debt has been fully paid off. Despite a market cap near ₹2.94T, the P/E ratio remains sky-high (~1474) , hinting at over-optimism.
That combo — stretched valuation + slowing FCF momentum — supports the case for a technical pullback before the next sustained trend resumes.
Trade View:
Short-term corrective tone stays intact. Watch ₹320–₹325 for a possible lower high; deeper retracement likely toward ₹280–₹260 zone.
Invalidation: ₹368.45
Disclaimer: This analysis is for educational purposes only and does not constitute investment advice. Please do your own research (DYOR) before making any trading decisions.
silver spot or mcx lvlboomer updatesilver now looking more bullish term due to gold silver ratio fall below 80 or industrial demand again looks shot up
silver spot eyes on 52$ stya abv or close abv than nxt tgt 55--58$ in mcx 158300 mkt stya abv or close abv than will see 170000+++++dontmiss it no if and but--- eyes on closing lvl

Asian Paints #Screener — Trend Reversal Before The Crowd Asian Paints Ltd (NSE: ASIANPAINT) has given a strong breakout from a long-term descending trendline with a sharp momentum candle.
This move signals a trend reversal after months of consolidation and price compression — supported by solid weekly volume.
Chart Structure #Screener
📌 Breakout from descending trendline
📌 Volume surge confirming buyer interest
📌 Price holding above 50 EMA on weekly
📌 Formation of higher lows since early 2025
📌 Strong bullish candle closing above key supply zone
Key Levels
Resistance Zone: ₹2880 – ₹3130
Support Zone: ₹2640 – ₹2720
Major Support: ₹2490 (structure base)
As long as price stays above ₹2640, trend bias remains bullish ✅
View
This setup represents a trend shift, not just a breakout — aligning with strength returning in large-cap sectors.
A healthy retest or consolidation above ₹2700 zone could provide follow-through opportunities.
Technical Snapshot
✅ Trendline breakout confirmation
✅ Volume expansion + wide-range candle
✅ Higher-low formation
✅ Momentum shift to buyers
✅ Mid-to-large cap stock showing leadership recovery
📒 Educational analysis only — not investment advice.

ASIANPAINTS RECTANGLE BREAKOUTAsianpaints breaking rectangle pattern weekly basis
huge volume this week,bullish RSI
breaking 20 week ema,above all key ema
strong q2earnings,crude oil cooling off
target 3400 sl 2600
NO BUY/SELL RECOMENDATION

XAU/USD OUTLOOK – TODAY 13/11/25
The US House has approved the reopening of the government, now just awaiting President Trump's signature. This means US economic data will gradually be released again, promising a week of strong and unpredictable fluctuations.
In terms of technicals, gold maintains an upward trend after breaking the H4 sideway boundary, but signs of overbought conditions and H4 peak divergence are emerging.
In smaller time frames (M30 – H1), slight divergence is also beginning to appear, so BUY positions need to be selected carefully, avoiding FOMO. SELL should only be short-term reactive trades.
🎯 Scenario for the day
Morning
Expecting sideway ~30 points within the 4180 – 4212 range
You can WATCH FOR TRADES WITHIN THIS RANGE
if the price breaks through 4212, then wait for a retest back to 4205 to buy up.
Afternoon
Wait for gold to adjust to reasonable BUY zones:
4160 – 4162
4152 – 4148
4123 – 4120
If a strong adjustment occurs:
Beautiful BUY at 4070 – 4040 (deep support zone).
🎯 Target increase:
4280 – 4285
4300 – 4305
🎯 Reactive SELL:
4255, 428X, 430X
(SL 10 – TP 10)
⚠️ Important Note
The overall trend is still uptrend, but attention is needed:
H4 shows signs of overbought + peak divergence.
M30 – H1 shows slight divergence, indicating the market may have a short adjustment before continuing to rise.
BUY should only be entered at beautiful support zones, if a bad candle is seen → close short and exit quickly.
SELL is only reactive selling at strong resistance zones, not holding for long.

XAUUSD – REFERENCE SCENARIO FOR 13/11 – TRACKING ELLIOTT WAVE 5💛 XAUUSD – REFERENCE SCENARIO FOR 13/11 – TRACKING ELLIOTT WAVE 5 🎯
🌤 Overview
Hello everyone 💬
Gold is currently trading around the 4210 region, indicating that the upward momentum has slowed after two strong days of gains.
According to Elliott wave, wave 5 may not have ended yet, and this region is becoming a strong resistance – where prices can accumulate or adjust at any moment.
Besides technical factors, political news from the US President's administration is causing significant USD fluctuations, leading to a wide range of gold movements in the short term. Therefore, today it is crucial to prioritise risk management and monitor price reactions in the 4210–4260 region.
💹 Technical Analysis
📈 On the H4 chart, gold is approaching the resistance area of 4210–4260, which also coincides with the 0.236 Fibonacci and the previous FVG zone.
🟣 The bearish view (ABC correction) will be confirmed when the price breaks below 4180 – targeting an adjustment to 4120–4050.
🔹 The bullish view remains valid if the price closes the H4 candle above 4212, in which case the trend could extend to 4250–4280.
🎯 Reference Trading Plan
💖 BUY Scenario (on breakout)
Entry: 4230–4232 | SL: 4225
TP: 4165 – 4190 – 4250
💢 SELL Scenario (reaction at resistance)
Entry: 4265–4267 | SL: 4273
TP: 4249 – 4215 – 4200
⚠️ Important Note
Closely monitor reactions at the levels: 4246 – 4212 – 4260 – 4280.
USD is highly volatile due to political factors, which may cause rapid fluctuations in gold.
🌷 Gold is at a crucial transition zone – Elliott wave 5 may soon end or expand further 💛
Be patient for clear confirmation, as at this stage, even a small deviation can change the entire price structure.
If you find this useful, please 💛 like – 💬 comment – 🔔 follow LanaM2 to keep updated with daily gold insights with me ✨

Today(13/11/2025),Nifty50 analysis.
CPR: narrow+ascending cpr: trending.
FII: -1750.03 sold.
DII: +5127.12 bought.
Highest OI:
Resistance: 26000
Support : 25800,25700
Events.
1.Bihar elections result on Friday from morning.
conclusion:
My pov: there is uncertainty so no view until the event is over, and preserve the capital.
psychology fact : It is important to make sure that your losses are reasonable.
note:
8moving average ling is blue colour.
20moving average line is green colour
50moving average line is red colour.
200moving average line is black colour.
cpr is for trend analysis.
MA line is for support and resistance.
Disclaimer:
Iam not Sebi registered so i started this as a hobby, please do your own analysis, any profit/loss you gained is not my concern. I can be wrong please do not take it seriously thank you.

BUY TODAY SELL TOMORROW for 5%DON’T HAVE TIME TO MANAGE YOUR TRADES?
- Take BTST trades at 3:25 pm every day
- Try to exit by taking 4-7% profit of each trade
- SL can also be maintained as closing below the low of the breakout candle
Now, why do I prefer BTST over swing trades? The primary reason is that I have observed that 90% of the stocks give most of the movement in just 1-2 days and the rest of the time they either consolidate or fall
Resistance Breakout in SYRMA
BUY TODAY SELL TOMORROW for 5%

EUR/USD I think EUR/USD Market Target 1.16250 Level in the DXY Weakness Situation and EXY Strong Situation.

HIGH PE - 140 - Biocon at major resistance NSE:BIOCON - Even though the results are good , seems hard to justify the PE of 140 . With 6% margin .

XAU/USD – Tug of War Before CPI: Sideway or Breakout? 1. MARKET CONTEXT
The US government reopens after a 40-day shutdown (a historic record).
Investors are on the sidelines observing ahead of tomorrow's CPI announcement → the market is likely to sideway awaiting news.
2. TECHNICAL ANALYSIS (H1–M30)
Main fluctuation range: 4097–4148
Break 4097 → adjust deeply to 407x – 403x
Break 4148 → trigger short-term increase, target 418x – 4205
Decision zone: 4097 & 4148
3. TRADING PLAN
🎯 Main strategy: Trade within the range (Sideway)
→ “Buy low – Sell high” according to support/resistance zones
RR ratio: 1:1 – 1:2 | SL: 10 points | TP: 10–20 points
BUY zone:
4097–4100 (strong support) → TP 4110–4120
Buy scalp: 4120–4124 → TP 4140–4145
Buy swing: 407x / 403x (if there is a candle reaction)
SELL zone:
4145–4147 → TP 4125–4100
If break 415x & retest, switch to Buy breakout
→ Entry 4140–4145 | TP 416x–418x–4205
4. SUMMARY
Main trend: Sideway awaiting CPI news
Strategy: “Break whichever range, trade that range”
Focus zones:
Upper range: 414x (Sell)
Lower range: 4095–4100 (Buy)

LiamTrading – XAUUSD H2 | USD strengthens again, gold ...LiamTrading – XAUUSD H2 | USD strengthens again, gold consolidates in an upward channel; await correction to 4090/4041 – break 4145 to confirm further rise
Quick context: USD recovery causes gold to move sideways during the Asian session. Price is moving within an upward channel, hitting the upper trendline and reacting around 4100, not forming a lower low yet. To confirm the continuation of the uptrend, a break of 4145 is needed; otherwise, prioritise the technical correction scenario towards liquidity zones.
Technical Analysis (Volume Profile • Trendline • S/R • Fibonacci)
Channel & Trendline: Channel top coincides with 4135–4145 → likely to see profit-taking pressure. Holding the lower edge of the channel ~4085–4090 keeps the upward structure valid.
Liquidity & FVG:
Liquidity 4090: price pull/volume attraction zone before choosing direction.
Fibonacci Retracement + old resistance ~4041–4043: strong confluence for a bounce if deep correction occurs.
Main resistance: 4130–4135 (retest of channel top), 4145 (pivot confirming rise), 4200 (sell scalp area if clear rejection appears).
Main support: 4084–4086 (channel edge/liq), 4041–4043 (Fib + S/R), deeper 4020 is a defensive point for buyers.
Trading Scenarios (optimised for mobile reading)
Scenario 1 – Buy shallow pullback (trend-following priority)
Entry: 4084–4086
SL: 4078
TP: 4098 → 4112 → 4135 → 4160
Suggestion: Wait for rejection candle at 4090 or M15 reversal signal before entry.
Scenario 2 – Buy deep (Fib + S/R)
Entry: 4041–4043
SL: 4036
TP: 4056 → 4072 → 4095 → 4120
Suggestion: Prioritise when price fills the gap and leaves a clear lower wick.
Scenario 3 – Sell scalp at resistance (counter-trend)
Entry: 4130–4132
SL: 4138
TP: 4112 → 4100 → 4088 → 4060
Note: Quick scalp only; abandon if H1/H2 closes strongly above 4145.
Bonus – Sell scalp 4200
Condition: Clear rejection on smaller timeframe.
SL: above the nearest recent high.
Reference TP: 4185 → 4166 → 4145.
Risk Management & Invalidation
Short-term bullish bias remains valid if price holds above 4085–4090.
H2 closes above 4145 → prioritise buying on breakout, limit all sell orders.
H2 closes below 4036 → risk of deeper test around 4020.
Risk per trade 0.5–1%, move SL to breakeven at +1R, do not average against the trend.
Which price zone do you find noteworthy today? Comment below & hit Follow on LiamTrading channel for the earliest updates.

Maruti: A good short term opportunity setting upHello,
Maruti Suzuki India Ltd, a subsidiary of Suzuki Motor Corp. The company is engaged in the manufacturing, purchase, and sale of motor vehicles, components, and spare parts. Its other activities include the facilitation of pre-owned car sales, fleet management, and car financing.
Maruti stock is trading at a very great point from a technical perspective & fundamental. Maruti Suzuki has said its first battery-electric vehicle, the E Vitara, will be exported to more than 100 countries, including Japan and Europe, from India. Investors are focusing on any updates on EV-related initiatives by the carmaker.
While the third-quarter net profit margin declined to 9.6% from 9.8% a year earlier due to higher promotional expenses Investors will be closely monitoring margin trends as automakers globally are dealing with relatively high inflation. Maruti Suzuki raised its car prices earlier this month due to rising costs and operational expenses. Investors will be paying attention to the pace of export growth.
While the electric car business is facing challenges as more manufacturers are beginning to believe they might not be able to compete with companies such as Tesla, we believe that Maruti Suzuki will continue to be a top manufacturer in its areas of operation. The companies are now choosing to switch to manufacture of hybrid vehicles than electric vehicles.
The MACD & Moving averages also point to a strong company that is at a good place to consider buying. We place a target of INR 13,800 on the stock with the entry near the shown support.
If you like my analysis, feel free to follow me on Tradingview & comment with the Indian companies you would like me to have a look at.
This is my personal trading journal, where I share insights and ideas. At times, I take trades outside ideal conditions to test strategies. Use this as inspiration but always perform your own analysis before making trading. Goodluck!

XAUUSD – PRIORITISE BUYING WHEN PRICE ADJUSTS💛 XAUUSD – PRIORITISE BUYING WHEN PRICE ADJUSTS 🎯
🌤Overview
Good morning traders 💬
Gold is experiencing a slight adjustment after encountering resistance at the VAH zone on the Volume Profile. This is a natural reaction in the current uptrend.
The price observation zone for today's adjustment is around the H4 trendline at 4078, deeper is the VAH zone 4020, where there is good liquidity for buyers.
Although there might be a short-term adjustment, the main trend remains upward. Therefore, I prioritise waiting to Buy at the support zone, rather than entering a trade against the trend.
💹 Technical Analysis (ICT Perspective)
📈 The price is maintaining a medium-term upward structure, with no reversal signals yet.
🟣 The 4075–4078 zone coincides with the trendline + liquidity zone – a potential buying area for short trades.
🔹 VAH around 4020 is strong support, suitable for long-term Buy if the price adjusts deeply.
💫 The 4200–4203 zone remains a major resistance (Sell Zone) – expect a downward reaction when the price approaches.
🎯 Reference Trading Plan
💖 Buy scalping (short-term)
Entry: 4075–4078 | SL: 4070
TP: 4095 – 4105
💖 Buy zone (main priority)
Entry: 4018–4021 | SL: 4011
TP: 4035 – 4042 – 4075 – 4095
💢 Sell zone (short reaction)
Entry: 4200–4203 | SL: 4210
TP: 4186 – 4165 – 4140
💢 Sell scalping (short-term)
Entry: 4122–4124 | SL: 4130
TP: 4105 – 4086 – 4060 – 4040
⚠️ Important Note
The 4048 zone is strong resistance – closely observe price reactions here.
Prioritise Buy according to the main trend, Sell should only be considered as a short-term reaction.
🌷Be patient and wait for the price to adjust to the support zone to buy according to Smart Money flow.
If you find this useful, please 💛 like – 💬 comment – 🔔 follow LanaM2 for daily gold insights ✨

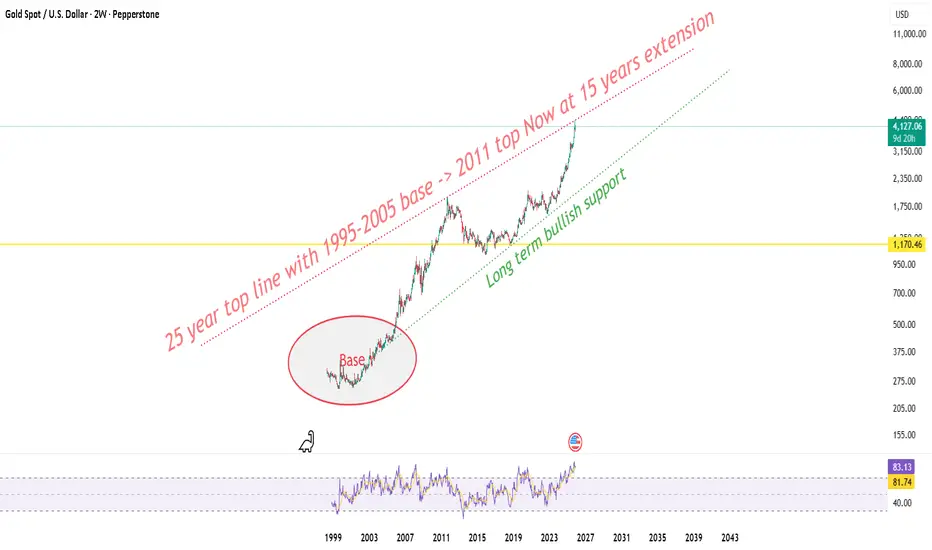
Gold at 25 year top line ! Macro view !Zooming out to the 2 week frame gold’s now touching the same top line that was drawn from the 1995-2005 base to the 2011 cycle high. This upper rail has acted like a generational ceiling and after nearly 15 years, price has stretched back into that very band again, this time near 4150–4350.
This zone isn’t just any resistance it’s the outer wall of gold’s entire super-cycle structure. Historically, whenever price came here with RSI above 80 on the 2-week frame, it marked exhaustion or at least a multi-month digestion phase before the next leg higher. And right now, RSI is sitting around 83 a clear signal of overheated momentum.
Macro context still favors gold in the long term global rate-cut expectations, slower real yields, and consistent central-bank accumulation keep the long-term green base trendline (drawn from 2005 lows) fully intact. As long as that line holds, the long-term structure stays bullish-biased.
But here’s the catch the higher we climb without a structural reset, the more fragile the rise becomes.
So 4365 stands as a major decision point.
Reject from here: we could see a healthy pullback toward 3750-3800 — still within the bullish channel.
Break and close above: that opens the door for a true macro breakout, with next expansion targets sitting around 4800–5200 over the coming years.
For now, this run feels more like a macro stretch ice sitting on sand. Looks shiny, but needs solid ground before it can hold.

BUY TODAY SELL TOMORROW for 5%DON’T HAVE TIME TO MANAGE YOUR TRADES?
- Take BTST trades at 3:25 pm every day
- Try to exit by taking 4-7% profit of each trade
- SL can also be maintained as closing below the low of the breakout candle
Now, why do I prefer BTST over swing trades? The primary reason is that I have observed that 90% of the stocks give most of the movement in just 1-2 days and the rest of the time they either consolidate or fall
Trendline Breakout in LUMAXTECH
BUY TODAY SELL TOMORROW for 5%

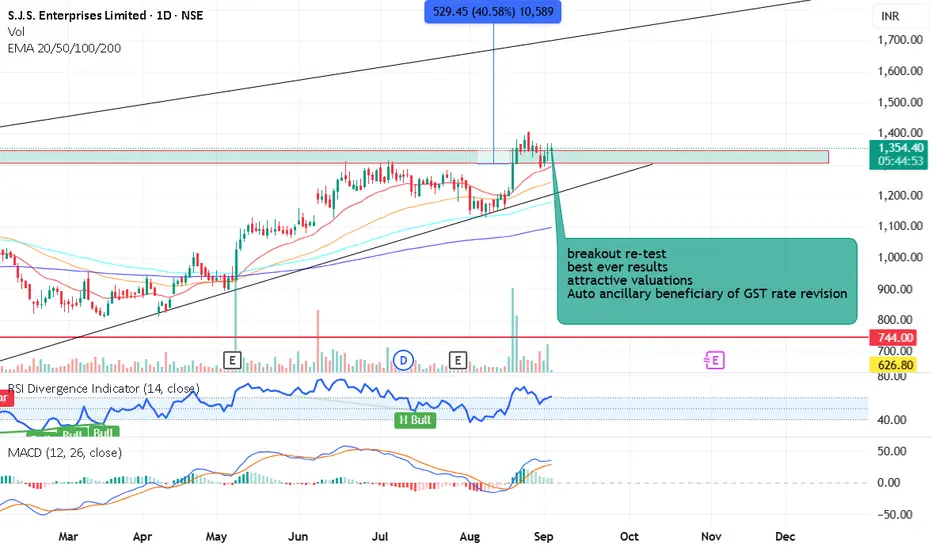
breakout retest SJS Auto ancillary stockbreakout re-test
best ever results
attractive valuations
Auto ancillary beneficiary of GST rate revision
ATH breakout with good volumes and retesting breakout level.
There are lot of chance to fly in blue sky.
this is only for educational not for any trade recommendation.
WILL GOLD CONTINUE TO RISE?I. BASIC CONTEXT
On November 10, 2025, gold prices surged after the market reacted positively to news of the U.S. government reopening.
The current market sentiment expects the FED to cut interest rates soon as recent economic data indicates a weakening U.S. economy.
Lower interest rates mean cheaper money, a weaker USD, thereby driving funds into safe-haven assets like gold.
The current rally is seen as a news-based pullback, potentially extending to key resistance areas before the market establishes a medium-term trend.
II. TECHNICAL ANALYSIS
Main timeframe: H2
Market structure:
Gold prices have broken out of the accumulation triangle pattern.
Formation of an Inverse Head and Shoulders pattern → signaling the correction phase has ended.
III. TRADING SCENARIOS
✅ Main scenario: WATCH TO BUY THE TREND (BUY THE DIP)
Trend expectation: Prices continue to extend the pullback to resistance areas 4180–4220.
Buy zones (BUY ZONES):
Zone 4105–4103 (near old H2 resistance → becoming new support).
Zone 4115–4116 (confirmation area post-breakout).
Deeper zone: 407x – 405x (Fib 0.618, trendline confluence area).
If prices retest the H2 structure: 4040 – 4035.
Buy stop:
When prices break through the 416x area with strong candle force → a buy stop can be placed to follow the breakout momentum.
Note to check the timing and candle force on H2/M30 to confirm momentum.
⚠️ Alternative scenario: WATCH TO SELL REACTION
If clear signs of weakness appear at resistance, consider a short SELL reaction at:
4180–4185
4205–4220
These are potential profit-taking areas for the current pullback wave.
IV. RISK MANAGEMENT
Stop Loss (SL): 10 points
Take Profit (TP): 10–12–13 points depending on setup
RR ratio: 1:1 – 1:1.3
Prioritize capital management according to the principle R ≤ 1% account/order.
Additionally, monitor news on Mr. Trump's actions during this period.
The U.S. government has reopened this week, so expect a fair amount of news, stay alert.
Trade effectively

Bajaj Finserv: Resistance Breaks, Q2 Results AwaitTechnical Analysis
Bajaj Finserv Limited has delivered an impressive super bullish rally since 2010, establishing itself as a blue-chip financial services stock. Multiple times since 2021, the stock faced resistance at the ₹2,000 level, which acted as a psychological and technical barrier.
However, recent strong year-on-year performance enabled the stock to decisively break above this resistance, and the ₹2,000 level is now acting as support - a classic bullish signal of role reversal. Currently trading at ₹2,112, the stock is well-positioned above its previous resistance.
Adding strength to the bullish setup, both the EMA-44 and Supertrend indicators are signaling bullish momentum, providing technical confirmation for the breakout. Tomorrow's Q2 FY26 results announcement serves as a crucial catalyst that could determine the next directional move.
Entry Strategy: Current levels offer opportunity with ₹2,000 support holding firm. Monitor Q2 results for confirmation.
Targets:
Target 1: ₹2,200
Target 2: ₹2,300
Target 3: ₹2,400
Stop Losses:
Minor Support: ₹2,000 (previous resistance, now support - be cautious if breached)
Major Stop: ₹1,800
Below ₹1,800, no more expectations on this stock.
Q1 FY26 Financial Highlights (vs Q4 FY25 & Q1 FY25)
Total Income: ₹35,439 Cr (↓ -3% QoQ from ₹36,595 Cr; ↑ +13% YoY from ₹31,480 Cr)
Total Expenses: ₹21,124 Cr (↓ -12% QoQ from ₹23,868 Cr; ↑ +7% YoY from ₹19,655 Cr)
Operating Profit: ₹14,315 Cr (↑ +12% QoQ from ₹12,728 Cr; ↑ +21% YoY from ₹11,825 Cr)
Profit Before Tax: ₹7,204 Cr (↑ +20% QoQ from ₹6,002 Cr; ↑ +21% YoY from ₹5,968 Cr)
Profit After Tax: ₹5,329 Cr (↑ +12% QoQ from ₹4,756 Cr; ↑ +27% YoY from ₹4,209 Cr)
Diluted EPS: ₹17.46 (↑ +15% QoQ from ₹15.14; ↑ +30% YoY from ₹13.39)
Fundamental Highlights
Bajaj Finserv delivered stellar Q1 FY26 performance with consolidated PAT surging 30% YoY to ₹5,329 crore, driven by robust performance across lending, insurance, and financial services verticals. The company's profit before tax jumped 21% YoY to ₹7,204 crore with total income rising 13% to ₹35,451 crore.
Subsidiary Bajaj Finance (51.39% holding) reported exceptional growth with PAT up 22% YoY to ₹4,765 crore and AUM reaching ₹4.41 lakh crore (up 25% YoY). Customer franchise expanded to 106.51 million, adding 4.69 million new customers in Q1 alone, with new loans booked surging 23% to 13.49 million.
Bajaj Allianz Life Insurance delivered impressive 76% YoY surge in shareholders' PAT to ₹171 crore, with VNB increasing 39% to ₹145 crore driven by product restructuring and favorable mix. Bajaj Allianz General Insurance posted 15% PAT growth to ₹660 crore with gross written premium up 9% to ₹5,202 crore.
Market cap stands at ₹3.45 trillion with EPS of ₹17.30 reflecting 31.1% QoQ and 30.1% YoY increase. The company operates 43 million EMI Network Cards and runs digital platforms like Bajaj Finserv Markets driving cross-selling opportunities.
Strategic diversification across lending, life insurance, general insurance, asset management (₹25,011 crore AUM), and emerging ventures in health, direct wealth management creates multiple growth engines. Capital adequacy ratio at healthy 21.96% provides growth capital while maintaining strong balance sheet.
Conclusion
Bajaj Finserv's decisive breakout above ₹2,000 resistance backed by strong Q1 FY26 showing 27% PAT growth and 30% EPS increase validates the bullish thesis. Subsidiary Bajaj Finance's 25% AUM growth to ₹4.41 lakh crore and 4.69 million customer additions demonstrate operational strength. Tomorrow's Q2 FY26 results serve as critical catalyst for the next leg toward ₹2,400 target. EMA-44 and Supertrend bullish signals provide technical confirmation. Critical support at ₹2,000 and major stop at ₹1,800 offer clear risk management levels for this diversified financial services powerhouse.
Disclaimer: tinyurl.com
