GAIL: Key Levels to Watch for Potential Downside MovementDescription:
In this analysis of GAIL, we observe a potential bearish setup
Trigger Level: If the price breaks today's low, it may indicate further downside movement.
Stop Loss: Today's high serves as a prudent SL to manage risk.
Target: Monitor the mentioned levels or adjust based on price action dynamics.
⚠️ Disclaimer:
This analysis is for educational purposes only and is not a trading or investment recommendation. Please do your own research and consult a financial advisor before making any decisions.
Gailanalysis

Gail going for a dip after ATH. Bearish move expected.Gail has given a nice bullish rally after crossing the previous ATH of 131.5.
There has been a 30% bullish rally. It has formed a double top and once it starts trading below 155.80 level it will confirm a "M" pattern too,
Today there was a nice sell of in the stock and it closed 5.5% lower with good volumes.
Even the RSI indicator is showing a bearish divergence on the daily charts. Chances are thereof it testing the lower levels around 151 and 147.
Target levels :- 151.7, 147.5, 142
It has closed below 38.2% fibonacci level, will come to test 50% and further targets of 61.8%.
Wait for the stock to cross today's low after a flat or slight gap up opening.
The retracement after forming a new high is remaining in the stock. And profits will be booked by the swing trades.
Keep in mind the R:R ratio and SL while entering the trade.

BIG BREAKOUT GAIL INDIA LTDCleanest As It Can Get
Big Buy Gail India Ltd.
Cmp - 120.35
Add More If Dip To 113-115
SL - 101.8 ( Weekly Closing Basis
Immediate Target - 150
If Reach To 150 Then Book Full Profit & Wait
For A Dip To 132-135 For The Target Of 222

GAIL: IMPULSE UNFOLDINGStock is rising in a uptrend channel forming HH HL which is the basic definition of an Uptrend. The current price action suggests that prices are unfolding into a primary wave-3.
One should buy the stock on current levels, keeping SL of 105 look for the target of 140 in the coming days and weeks ahead.

Looking Good - Long term ViewHi All…
Greetings!
Today I’m sharing with you Gail India Ltd. Weekly Chart. I think if GAIL breaks 133 & 148 level we might see good upcoming move. The targets mentioned are Long term TGT so keep patience.
In the coming time I think it should give good returns.
Thanking You
Important Things
1. This is only for educational purposes only.
2. Never over trade.
3. Always keep Stop Loss.
4. Trade in limited quantity.
5. Taking a small loss is better than wiping up your whole capital.
I hope you found this idea helpful.
Please like and comment.
Share with Your Friends.
Keep Learning,
Happy & Safe Trading
Disclaimer – These ideas shared by me to all are my personal analysis / views. Im not a SEBI registered technical analyst.

LONG GAILGAIL Looking Good In Falling Market.
Cmp - 110
Buy At Cmp & On Dips To 100-103
SL - 91 ( Weekly Closing Basis )
Target - 140/150

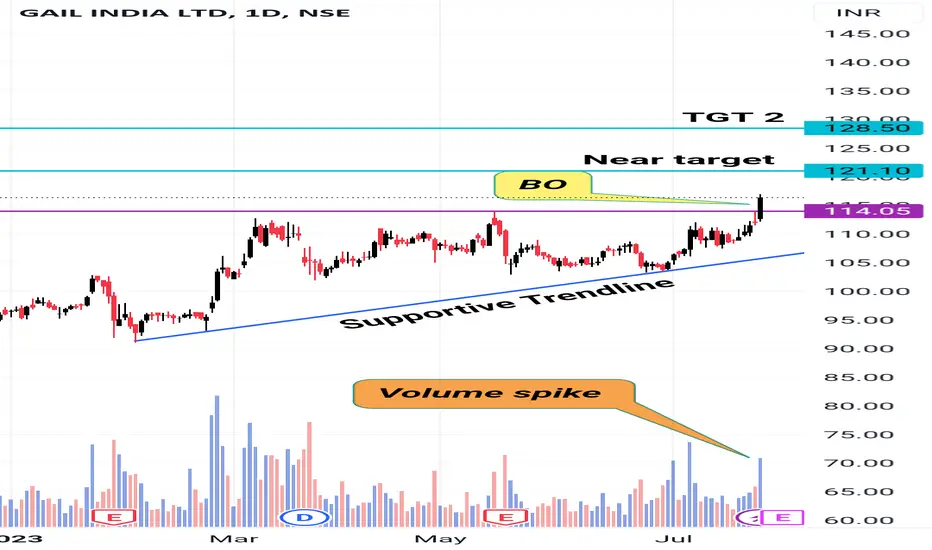
Gail India Analysis Stock has given BO on daily chart with good volume, follow chart for proper entry and exit levels.
Gail waiting for a great move 27/06/23.Gail has been trading in a range for almost 4 months and in a smaller range for 40 days. Its trading around the support zone of 102-104.
The stock has consolidated very well and can give either side break. Though on the daily time frame, the stock is trading between both the moving averages and is taking support from the zone forming dragon fly doji near it.
It has formed an inside candle and on the hourly chart, there is a bearish moving averages cross over.
Fundamental too the stock looks good and will give nice returns in coming years. The dividend yeild of the stock is also better.
Target (bullish) :- 108.2, 112
Stop loss :- 102.5
Enter after seeing the price action. If stock price starts trading above the previous day high long positions can be created and accumulation of long term can also be done at the current price levels.
Wait for the price action near the levels before entering the trade.

GAILGail is in such no clear indication as per chart but any side BO /BD will give solid movement in short time. So should try when ever giving movement in any direction with trend.

Gail109 above intraday position gail looking extream bullish after consolidation
112 Target
Trendline tuch you can immediately buy okh

GAIL - ShortA short-term reversal move can be expected due to profit booking. The market has also peaked and there is a chance for the crude price to increase in the coming weeks. This can also affect the stock price adversely.

Gail India : Weekly chartGail : Beautiful structure in weekly chart
>> PSE Stock
>> Declining Crude oil Prices will be positive for this stock
>> Be patient with this stock
>> Trade Level to Level
Happy Trading !!!

Gail waiting for a break out on higher time frame.Gail on the weekly time frame has closed above both the moving averages but is near a resistance.
The stock even on the daily time frame has crossed the 200 ema and closed above it.
The stock has also given a break out of the consolidation box.
3 point confirmation.
1. High volume box break out.
2. Closed above 20 and 200 ema on weekly time frame.
3. Closed above 200 ema on daily time frame.
The stock has closed near a resistance level and if the levels is crossed the stock can reach 3-digit levels soon.
Let the stock to close above 93.5 level and create intraday and swing positions only when the level is tested.
Target :- 98.5, 101.90
Stop loss :- close below 200 ema (daily time frame).
Wait for the price action near the levels before entering the trade.

GAIL - BULLISH BREAKOUT GIVENNSE:GAIL
BULLISH symmetric triangle pattern breakout given
Buy with SL - 85
Accumulation zone - 87-90
Target - 93, 97

Gail forecast using supply demand and support resistance areasNSE:GAIL showing possibility of triangle pattern breakout/breakdown on weekly/daily timeframe, keep close eye on it.

GAIL: Head and shoulder THEORY:
This pattern forms after an extensive upside rally. It consists of a left shoulder, a head, and a right shoulder. The left shoulder is formed after a big bull rally in which the volumes are quite large.
At the end of the left shoulder, a minor correction takes place on the downside which happens on the low volumes comparatively the starting of the left shoulder. After this, again an up move can be seen on large volumes forming a head whose top is above the left shoulder following a correction on lower volumes & completing the head.
The completion of the head must be below the top of the left shoulder. If the prices fall down below the low of the left shoulder then too this pattern remains intact. In the end, the right shoulder is formed usually on smaller volumes comparatively the previous two rallies.
Now if you connect the bottoms of the left shoulder, head & the right shoulder there will be a formation of the ‘Neckline‘. This line will act as a decision line. If the prices break this neckline & give closing below the line, this will be the confirmation of the breakdown of the H&S pattern.
However, it has been noticed that after breaking of the neckline the prices again attracted towards this neckline. We say this phenomenon as a retest of the neckline which will add some more confidence while trading this pattern.
After retesting if the prices again come down this will be the final confirmation of the downside movement of the price as shown below.
The bookish target of this pattern is taken as the vertical price range from the top of the head to the neckline & the bookish Stop loss should be the top of the right shoulder. However this stop loss can be big, so it is advised to keep a stop loss of 4-5% of the price range above the neckline.
May 29
TRADING STRATEGY: GO SHORT WITH SL OF 99 & LOOK FOR THE TARGET OF 73/63 IN THE COMING WEEKS.
NOTE: IF THE STOCK BREAKS THE RESISTANCE OF 99 THEN IT WILL BE A H&S FAILURE PATTERN, WHICH WILL CALL A BULLISH ALTERNATE SCENARIO.

GAIL India, PSU stock at a support zoneTwo scenarios .
1. The stock has made H &S pattern. The pattern must break the historical support and retest the area for confirmation showing bear grip.
2. The area of confluence + Strong Q1 results + positive global sentiments shows bullishness in stock. A rejection long wick candle validates this but the H & S pattern formed may trap investors.
3. Since the inflation is being stable (yet above RBI Std) and global recovery in Gas demand we can expect the stock to move upwards given that GAIL is a fundamentally strong PSU having a very good dividend yield.
4. My view is Long, that the stock has made a insider candle at the area of confluence in DAILY TF, with targets specified in the charts.
5. Safe traders can wait for a good bullish candle breaking prev week high as confirmation in weekly TF for long positions by keeping the weekly low as stop-loss and Vice-versa.
Aggressive traders can enter with a stop loss below the support zone @ 123/119 and go long for targets above 150 and 170 and beyond in long term.
Note:
This idea is purely on observation made by me, this is not a recommendation or a call.
please do your analysis and share your opinion in the comment box below.
Healthy discussion and inputs are welcomed with thanks

Simple Trade Setup | GAIL | 06-06-2022 [INTRADAY]NSE:GAIL
Observations:
1) On 15min TF we can see there is resistance channel. this resistance channel has been tested so many times.
Please refer below chart : 15min time frame.
-------------------------------------
Trade Setup for 06-06-2022
1) Don't Jump in to trade at the beginning of the market. Let it get settle for 15-20min first and judge the price action.
2) Everything is mentioned on the chart. I hope it is easy to understand.
3) All the levels will work as support, resistance, entry and exit w.r.t price action near that level.
4) Avoid gap up or gap down chase. Wait and trade between levels.
Please refer below chart for levels.
Hope I made it easy to understand it.
Do comment your doubt or suggestion.
Note: Trade with Strict SL. It may or may not hit all the levels. So one can book profit / loss at respective level considering how price action works near that level.


GAIL INDIA SWING TRADEHello gail india short term swing trade buy above: 156 target: 170 stoploss: 153.
LOGIC BEHIND TRADE: Stock has formed W pattern on 4 hr chart & given breakout of dynamic & static resistance, breakout buying strategu (Target identified from harmonic xabcd pattern level 1.414) stoploss is taken low of resistance candle. NSE:GAIL

EWT - Gail is Going To Break 2021's High
Gail India has completed its 4th corrective wave, where wave C is the last leg of correction.
Price took 27 weeks to complete the corrective wave ((4)).
After completing the wave ((4)), the price has broken the sub-wave iv and signaled a rally. It also has entered into the corrective channel, and this rally can make a new higher high .
The traders can expect the following targets 149-156-170+ for impulsive wave ((5)).
Invalidation point is low of wave ((4)) at 125.20.
Wave Formations:
Wave ((1)) started to form an extreme low at 65.
- Leading diagonal
Wave ((2)) has retraced 0.618% of wave ((1)).
- Zigzag correction
Wave ((3)) has extended 2.618% of wave ((1)).
- Five wave impulse
Wave ((4)) has retraced 0.5% of wave ((3))
- Extended wave 5


Gail to reach another ALL TIME HIGH.Gail on a weekly time frame has crossed it resistance level and has closed above it.
The stock looks bullish and can make new ATH.
Daily time frame, there is a crossover of the moving averages which give another confirmation of a bullish rally.
Support :- 165, 160
Resitance :- 170, 177
The resistance are taken from the fib levels and previous high.
Wait for the price to retest the support level and if the price respect the support level, trade can be initiated.
