Bitcoin Bybit chart analysis March 10Hello
It's a Bitcoinguide.
If you have a "follower"
You can receive comment notifications on real-time travel routes and major sections.
If my analysis is helpful,
Please would like one booster button at the bottom.
This is the Bitcoin 30-minute chart.
There is no Nasdaq indicator announcement today.
The trend has been brought forward by one hour due to the application of US Daylight Savings Time.
If only the Nasdaq low is not broken and
It moves sideways, there will be no crash in Bitcoin.
I created today's strategy based on the Gap9 section retracement at the top.
*When the blue finger moves,
It is a two-way neutral strategy.
1. 81826.5 dollars long position entry section / stop loss price when the blue support line is broken
2. 86234 dollars long position target price
After that, from section 1 -> 87428.5 dollars -> Great
As indicated, it would be good to use short->long switching.
Up to this section, it seems more advantageous to liquidate long and then re-enter long than short. (Tether Dominance 4+6+12 MACD Dead Cross Possibility)
The center line of the Bollinger Band daily chart
is the final short position switching point.
(Approximately $90,418)
If the Bottom section is broken today according to the movement of Nasdaq,
Bit will also break the previous low point
and it may fall strongly to 3 -> Gap7.
For those who can check the drawing section,
I have marked today's major rebound section near Gap7, so please refer to it.
Up to this point, please use my analysis as a reference only
Please operate safely with principle trading and stop loss price.
Thank you.
Gann

Bitcoin Bybit chart analysis March 7Hello
It's a Bitcoinguide.
If you have a "follower"
You can receive comment notifications on real-time travel routes and major sections.
If my analysis is helpful,
Please would like one booster button at the bottom.
Bitcoin 30-minute chart.
There will be a Nasdaq index announcement at 10:30 in a little while,
6-hour chart MACD dead cross is in progress.
*Red finger movement path
Long position strategy
1. 88,624 dollars long position entry section / cut-off price when purple support line is broken
2. 1st section at the top 1st target -> Top 2nd -> Target in order during the weekend
1st section at the top pink resistance line / green support line sideways to 3rd section
There is a possibility of additional decline from bottom breakout
Please check 4th section at the bottom -> 80,118.5 dollars
Thank you.

stock market class 1# **Stock Market – Class 1**
The **stock market** is where investors buy and sell shares of publicly traded companies. It plays a key role in **wealth creation, capital raising, and economic growth**.
## **1️⃣ Key Components**
✅ **Stock Exchanges:** Platforms like **NSE, BSE** facilitate trading.
✅ **Indices:** **Nifty 50, Sensex** track market performance.
✅ **Market Participants:** Retail & institutional investors, FIIs, DIIs.
## **2️⃣ How the Stock Market Works**
✅ **Primary Market:** Companies issue IPOs to raise funds.
✅ **Secondary Market:** Investors trade stocks based on demand & supply.
✅ **Bull & Bear Markets:** Rising vs. falling trends.
### **Conclusion**
Understanding the **basics of stock trading, market structure, and investor behavior** is essential for making informed decisions. 🚀

Will $SUI hit $10 in Current Bull Market?Will CRYPTOCAP:SUI hit $10 in Current Bull Market?
Key support zone: $2.50-$2 – Holding this level is crucial for a potential breakout toward $10.
Price action suggests a strong bounce from this demand zone, making it a strategic re-accumulation area for high-R:R setups.
#SUI #Altcoins

NDQ US 100 INDEX 1W TVC 20201.37 08 MARCH 2025NDQ completes a classic "M" pattern in Gann Analysis. Double Top and Double Bottom what more a trader needs. We double tops on 16 Dec 2024 and 18 Feb 2025 on weekly charts. We are forming a double bottom on weekly charts on 07 Oct 2024 and 03 Mar 2025. We need to hold the lows of 03 Mar 2025 week at 19761.81. Below this level 19633 needs to be watched critically. We may resolve this trend in a months time around 07 Apr 2025 weekly candle. Downside levels to watch will be 18381 and 17371 if we sustain downwards trend. Aggressive traders can look to buy in the double bottoms woth suitable risk reward ratio as per their risk profile. Conservative traders can wait for current weekly highs to cross. Long term Gann Analysis shows we failed by minimum vibrations to a picture perfect pattern of "As Above...So below ". Gann Analysis "Lost Motion " phenomenon observed here. Watch 15 Apr 2025 as Time Coordinate for NDQ.
Happy Trading !!!
N.B. Not a financial advice to buy or sell.
With usual disclaimers as applicable within the reach of this beautiful trading analysis platform. Thanks to the developers of the program for this opportunity to use it freely to express our ideas to the community of traders.

database trading part 2#Database Trading
Database trading enhances decision-making by using **historical data, AI models, and statistical patterns** for trade execution.
## **1️⃣ Advanced Data Utilization**
✅ **Backtesting Strategies:** Evaluates trade performance on past data.
✅ **AI & Machine Learning:** Predicts market movements using data-driven models.
✅ **Pattern Recognition:** Identifies high-probability trade setups.
## **2️⃣ Optimizing Trade Execution**
✅ **Real-Time Data Processing:** Helps in **scalping, swing, and intraday trading**.
✅ **Automated Strategies:** Reduces emotional bias and improves consistency.
✅ **Risk Management:** Data-driven stop-loss & take-profit levels for better control.
### **Conclusion**
Database trading enhances accuracy by using **quantitative models and real-time data**, making it a powerful tool for modern traders. 🚀

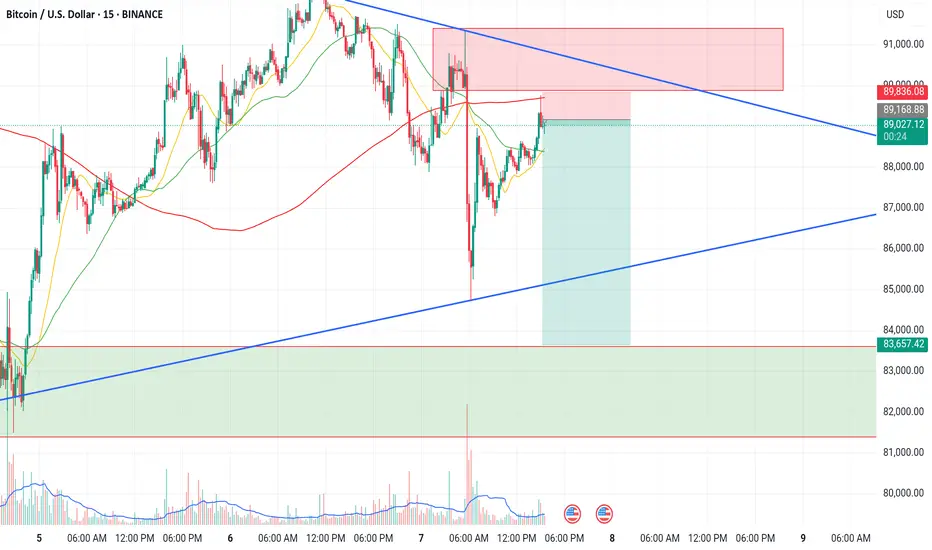
Very good shorting opportunity in BTC. Trade setup explainedBtc is getting rejection from 1hour supply zone. We can short btc with sl of 89840. We can target level of 83650. Risk reward ratio of the trade is very good i.e 1:8. Below at 83000 levels We have a demand zone which will be our target for the trade.
Bitcoin Bybit chart analysis March 6Hello
It's a Bitcoinguide.
If you have a "follower"
You can receive comment notifications on real-time travel routes and major sections.
If my analysis is helpful,
Please would like one booster button at the bottom.
This is the Bitcoin 30-minute chart.
There will be a Nasdaq index announcement at 10:30 in a little while.
At the bottom left is the long position entry point on March 5th.
The purple finger is connected to $88,407.
*Red finger movement path
One-way long position strategy
First wave check in section 1 at the top
1. Long position entry section of $90,698 / Stop loss price when purple support line is broken
2. Long position 1st target of $94,236.5 -> Gap8 2nd target
(Today's 4-hour chart, 12-hour chart resistance line section is $94,236.5
Since we don't know how much the adjustment will come out, it's okay to use a short position.)
3. After long profit cut, section 1, $91,884.5 long position utilization section
After that, long position target price in order of Top -> Good section.
Section 1 at the top
If there is an adjustment after the touch, a short->long movement will occur in NASDAQ
and it is more advantageous to wait for a long than a short,
and Section 2 at the bottom is a safe long position entry section where a short-term pattern is maintained.
From Section 3, there may be an additional decline,
so it would be good to check Bottom -> $83449.5 as indicated.
My waist and shoulders are not so good
I will enter early here today
Please use my analysis article as a reference only
Don't forget the 6 principles of trading and the essential stop loss price
and operate safely
Thank you.

Bajaj Finance Ltd (BAJFINANCE) Stock AnalysisGlobalTradeHub | Bajaj Finance Ltd (BAJFINANCE) Stock Analysis
Fundamental Analysis:
Bajaj Finance, a leading NBFC, benefits from strong loan growth, digital transformation, and a diversified portfolio across consumer and SME lending. Consistent profitability and low NPAs make it a strong player. Risks include rising interest rates and economic slowdowns affecting credit demand.
Technical Analysis:
The stock is facing resistance near ₹7,250. A breakout could push it toward ₹7,500. Strong support is at ₹6,900, and a breakdown may lead to ₹6,600. RSI around 62 suggests bullish momentum but nearing overbought territory.
Key Levels:
- Resistance: ₹7,250 / ₹7,500
- Support: ₹6,900 / ₹6,600
Conclusion:
Bajaj Finance remains fundamentally strong. A breakout above ₹7,250 could trigger further upside, while dips to support zones offer buying opportunities. 💰📈

MACD trading # **MACD Trading Strategy**
MACD (**Moving Average Convergence Divergence**) is a powerful momentum indicator used to identify **trend strength, reversals, and entry-exit points** in trading.
## **1️⃣ Key Components of MACD**
✅ **MACD Line:** Difference between the 12-day and 26-day EMA.
✅ **Signal Line:** 9-day EMA of the MACD line, used for trade signals.
✅ **Histogram:** Represents the gap between the MACD and Signal line.
## **2️⃣ MACD Trading Strategies**
✅ **MACD Crossover:**
🔹 **Bullish Signal:** MACD crosses above the Signal Line → Buy.
🔹 **Bearish Signal:** MACD crosses below the Signal Line → Sell.
✅ **MACD Divergence:**
🔹 **Bullish Divergence:** Price makes lower lows, but MACD forms higher lows → Reversal Up.
🔹 **Bearish Divergence:** Price makes higher highs, but MACD forms lower highs → Reversal Down.
✅ **MACD Histogram Analysis:**
🔹 Expanding bars indicate **strong momentum**, while shrinking bars signal **trend weakening**.
### **Conclusion**
MACD is a reliable tool for **trend confirmation and momentum analysis**. Combining it with **support-resistance and volume analysis** enhances trade accuracy. 🚀

Bitcoin Bybit chart analysis March 5Hello
It's a Bitcoinguide.
If you have a "follower"
You can receive comment notifications on real-time travel routes and major sections.
If my analysis is helpful,
Please would like one booster button at the bottom.
This is the Bitcoin 30-minute chart.
There is an indicator announcement at 12 o'clock on Nasdaq.
Yesterday, based on Tether Dominance, the 4-hour chart was maintaining a thin line above the center line,
so it is rebounding strongly as expected, coupled with the Nasdaq rebound.
It is very difficult to make an entry point again today.
Yesterday, Nasdaq touched the Bollinger Band weekly chart support line, so I judged this week to be a major rebound section.
(It is good that the support line is supporting it.)
At least, Bitcoin followed the trend according to the possibility of a sideways movement without a plunge.
*Red finger movement path
Long position strategy
1. $88,407 long position entry section / cut-off price when purple support line is broken
2. $96,005 1st target -> Top section 2nd target
After liquidation, bottom section 1 long position re-entry section / cut-off price autonomous
Today's long position entry section is
30-minute support + 1-hour central pattern that returns.
(Today's first wave)
I explained most of the key points of the strategy yesterday.
The reason I focused on the long position today is
The daily chart MACD golden cross is in progress,
*In the case of Tether dominance, it is a daily central line + 12-hour chart support line pattern,
but since the mid-term pattern is broken and the daily chart central line is the second touch, I thought it was highly likely to be pushed by force.
Section 1 at the top and section 2 at the bottom are sideways.
Because the downward direction is open from the bottom section,
it can flow up to section 3.
Up to this point, I ask that you simply use my analysis for reference and use only,
and I hope that you operate safely with principle trading and stop loss prices.
Thank you.

GULFOILLUB-Breakout Stock🚀 Gulf Oil Lubricants (GULFOILLUB) is in strong momentum! This stock is showing promising movement, making it worth keeping on your watchlist. 📈 Investors are advised to study the stock and conduct their own research before making any investment decisions.
Disclaimer: This is purely for informational purposes and not a recommendation to buy or sell. Investors are advised to conduct their own research and risk assessment before making any investment decisions, as stock markets are subject to volatility and risks.
#StockMarket #MomentumStocks #BreakoutStocks #StocksToBuy #StockMarketNews #Trading #StockMarketIndia #ShareMarket #Nifty50 #SwingTrading #TechnicalAnalysis #BestStocks #NiftySmallCap #NiftyMidCap #BankNifty #MultibaggerStocks #Investment #IntradayTrading #StockMarketUpdates #TradingTips #BreakoutTrading #FinancialMarkets #StockMarketInvesting #GULFOILLUB #StocksToWatch #ShareMarketIndia

Bitcoin Bybit chart analysis March 4Hello
It's a Bitcoinguide.
If you have a "follower"
You can receive comment notifications on real-time travel routes and major sections.
If my analysis is helpful,
Please would like one booster button at the bottom.
This is the Bitcoin 30-minute chart.
There is no Nasdaq indicator announcement.
In the analysis I left today,
I would be grateful if it moves sideways without breaking the green support line.
Today's two main points of view are
Whether the 12-hour chart MACD dead cross is in progress
and
The Tether Dominance 4-hour chart center line is above
The thin section of the cloud (possibility of a crash).
I thought it would be complicated if I explained it in both directions,
so I approached it very simply.
It is an ambiguous position before the decline in Tether Dominance (tail section when taking a short position in a plunge)
Bitcoin also touched the support line of the 2-hour Bollinger Band chart today
(additional downtrend or sideways section)
Since there was no short position entry position today,
we proceeded with the final sweep (plunge) of Tether Dominance in line with the 12-hour chart MACD dead cross imprint from 9 PM to 9 AM when the 12-hour candle is created.
If you don't understand, please read it repeatedly.
*When the blue finger moves,
it is a short position strategy
short->long switching strategy.
1. $85,584.5 short position entry section / stop loss price when breaking through the pink resistance line
(The pink resistance line section is the center line of the 4-hour Bollinger Band chart based on Tether Dominance,
but since it is the order of the 4-hour chart MACD dead cross and the positive cloud is maintaining thin,
you should be careful because it can rise strongly when breaking through this section.)
2. $80,103 long position switching section / stop loss price when breaking through the blue support line
(A strong rebound before and after breaking through the blue support line is sweeping through Tether Dominance -> a crash condition.)
3. $86,935.5 long position 1st target
-> After the 12-hour chart MACD dead cross is imprinted, the 2nd target price is the top section
Currently, in Tether Dominance, the 6+12 pattern has touched the daily center line, so the mid-term pattern It's broken.
From reaching the top section, continue to maintain a long position
If the condition is Tether Dominance
Based on the recovery of the 12+ daily pattern
You can see the resistance line of the Bollinger Band 12-hour chart -> near the daily central line.
(Here, take profit and final short switching depending on the situation)
If there is no rebound in the bottom section today
You should look at the 2nd section from Gap7 at the bottom
And if it continues to fall, this week's major rebound section
I will organize it again later.
Please use my analysis article for reference and use only
I hope you operate safely with principle trading and stop loss prices.
Thank you.

BTCUSD WEEKLY GANN ANALYSIS UPDATED 04 MARCH 2025We are seeing a bout of profit booking on the BTCUSD with the long awaited 6 figure targets achieved on it. Earlier swing high of 69000 could be back tested if it sustains below 78000. 69000 was hit in Nov 2021.Recent ATH of 109,356 hit in Jan 2025. Swing low in between these two highs was 16256 in Nov 2022. I was looking for a high around 108362. we got 109,356 not bad with my targets achieved. Critical time to watch is second week of May 2025. Momentum can be seen above 104421 and downside can continue below 83260 levels. in between these range we can see consolidation. Caution below 83260. Time window to watch is between 10 March 2025 to 12 May 2025. It will be trader's paradise as it has always been in the recent past.
Happy Trading !!!

A great buying opportunity in pi network coinPiUsdt is in daily timeframe demand zone. The legout of the demand zone is very nice so there are very high chances of market going up from here. And one more important thing is there important fibonacci level of 61.8 also. This trade has a good risk reward ratio of 1:7. Trade with proper risk management.

GREAT BUYING OPPORTUNITY IN BITCOIN. BREAKDOWN OF THE SETUPGREAT BUYING OPPORTUNITY IN BITCOIN. BREAKDOWN OF THE SETUP
In daily time frame btc has taken support from the important level of 61.8 fibonacci level. And it has taken support of 200dma also.
In 15 minutes time frame BTW Has formed head and shoulder pattern also which is showing the target of 91000. So this is a good buying opportunity in bitcoin

APL Apollo Tubes Ltd Stock Analysis**GlobalTradeHub Stock Analysis**
**APL Apollo Tubes Ltd (APLApollo)**
**Fundamental**: A leading player in the Indian steel pipe industry, APL Apollo has consistent growth driven by infrastructure demand.
**Technical**: Bullish trend with moving averages supporting upside. RSI is neutral, indicating room for further growth.
**Support Levels**: ₹1,000, ₹950
**Resistance Levels**: ₹1,150, ₹1,200
Let me know if you'd like to analyze another stock!

Why Dow Jones could come to 42580**Simplified Summary: Dow Jones Outlook for March 2025**
📉 **Current Situation (Feb 28, 2025):**
The Dow Jones is at **43,194**, down slightly (-0.16%). It’s hovering near a key support level at **42,558**, which acts like a "safety net" for prices. If this level breaks, the Dow could drop further.
---
🔍 **What to Watch:**
1. **Critical Level (42,558):**
- If the Dow closes *below* this level (with heavy trading volume), it could fall toward **42,000–42,580** by mid-March.
- If it *holds*, prices might bounce back up toward **44,000–45,000**.
2. **Recent Trends:**
- The Dow has been making *lower highs* (peaks are getting weaker), suggesting buyers are losing momentum.
- Trading activity (volume) is mixed—big spikes near support levels mean traders are closely watching these zones.
---
🎯 **Possible Scenarios:**
- **Bearish (Downside):** Breaking below **42,558** could signal a drop to **42,580 or lower**.
- **Bullish (Upside):** A rebound from **42,558** could spark a rally if buyers step in.
---
⚠️ **Key Risks:**
- **External Factors:** News about interest rates, company earnings, or global events (like trade tensions) could override technical signals.
- **Market Sentiment:** Fear or excitement among investors can push prices up or down quickly.
---
**Bottom Line:**
The next few weeks depend on whether the Dow holds above **42,558**. If it breaks lower, **42,580 is a likely target**.

Nifty 50 Targets we have been watching Today + 2 daysTargets we should be watching based on Support & Resistance
We find it thrilling , when targets meet based on support and resistance.
we are watching 22790, 22520, 22100, 21930, 21500. If targets which are broken, are supposed to be the resistance which needs to be broken, for a change in direction thinking.
As per price action, today is the key date, so we will check today + 2 days.
Other Important dates are 12 March, 20 March. Other details are on chart.
Good Trading brothers.

Bitcoin Bybit chart analysis February 27 Hello
It's a Bitcoinguide.
If you have a "follower"
You can receive comment notifications on real-time travel routes and major sections.
If my analysis is helpful,
Please would like one booster button at the bottom.
This is Bitcoin's 30-minute chart.
Nasdaq indicators will be announced at 10:30 in a little while.
It is rebounding after breaking away from the previous low yesterday,
but today's main point of view is the Bollinger Band 4-hour chart's center line touch section.
Both Nasdaq and Bitcoin are in similar positions.
I created today's strategy centered on this part.
The purple finger at $82,610 on the lower left
is the 3rd place in the long position entry section on February 26.
* When the blue finger moves,
it is a short->long switching strategy centered on long positions.
1. $88,577.5 short position entry point / stop loss price when orange resistance line is broken
2. $85,093.5 long position switching / stop loss price when green support line is broken
3. $92,090.5 long position 1st target -> Good 2nd target
If it reaches the Good section, the final short position switching
(Approximately the center line of the 12-hour Bollinger Band chart.)
If it falls immediately from the current position,
The 1st section at the bottom, $85,724.5, becomes the long position entry point.
(Same stop loss price when green support line is broken)
Since there is pressure from the 4-hour MACD dead cross in the Tether Dominance that moves in the opposite direction of the beat,
If it succeeds in rebounding in section 1,
There is also a possibility that it will strongly break through the center line of the 4-hour Bollinger Band chart. (Bitcoin is in the process of a 4-hour chart MACD golden cross)
In real time, Nasdaq is touching the center line of the 4-hour chart first.
The proper order has finally been created.
Even if Bitcoin doesn't rest on the weekend,
the order of Nasdaq -> Bitcoin is correct in terms of the pattern.
With the forced coupling with Nasdaq,
today's analysis is particularly difficult from the drawing to the entry point haha
The 2nd section at the bottom is the final long position entry point for today,
and if it reaches this section,
there is a low probability of a sweep in Tether dominance. (Bit case skyrockets)
Bottom is a double bottom -> There is a possibility of additional adjustment in the 3rd section,
so please note, and this week, if possible, it would have been good if the previous low was not broken,
but it ended up breaking and is going through a difficult time.
Up to this point, please use my analysis as a reference and only as a level of use,
and I hope you operate safely with principle trading and stop loss prices.
Thank you.

Shriram Finance Ltd Stock Analysis**GlobalTradeHub | Shriram Finance Ltd Stock Analysis**
**Fundamental Analysis:**
Shriram Finance, a leading NBFC in India, specializes in vehicle and MSME financing. Strong loan growth, improving asset quality, and steady NIMs support its fundamentals. However, risks include higher NPAs in the commercial vehicle segment and rising interest rates impacting borrowing costs.
**Technical Analysis:**
The stock is consolidating near ₹2,550 resistance. A breakout could push it toward ₹2,700. Strong support is at ₹2,400; a breakdown may lead to ₹2,250. RSI near 58 suggests moderate bullish momentum.
**Key Levels:**
- **Resistance:** ₹2,550 / ₹2,700
- **Support:** ₹2,400 / ₹2,250
**Conclusion:**
Shriram Finance remains a fundamentally strong NBFC. A breakout above ₹2,550 could drive further upside, while support levels offer potential buy zones. 📈🚀

Bitcoin Bybit chart analysis February 25Hello
It's a Bitcoinguide.
If you have a "follower"
You can receive comment notifications on real-time travel routes and major sections.
If my analysis is helpful,
Please would like one booster button at the bottom.
Here is the Bitcoin 30-minute chart.
The Nasdaq indicator will be released at 12 midnight tonight.
In the case of Bitcoin, it is coupled with Nasdaq and is falling without asking.
Since there is no short position entry point yet,
I proceeded a little safely until today because there was a risk factor.
*Long position strategy when the blue finger moves
1. Purple finger at the top 90394.5 dollars
Autonomous short operation section / Stop loss price when orange resistance line is broken
2. 87759.5 dollars Long position entry section / Stop loss price when green support line is broken
3. 92340 dollars Long position 1st target -> Top, Gap in order of target price.
Since it can rise strongly from dawn,
I did not operate a separate short position.
(In the case of Tether Dominance, since it is difficult to sweep from the current position, if it is not a direct crash, the rising pattern is maintained, so the part that is gradually broken is included in the strategy.)
There is an additional autonomous long entry position in the first section at the top.
The purple finger touch -> 87.7K from the current position is the safest,
and if it goes down right away, it is a long wait in the second section.
If you look closely at the green support line,
you will see a bright sky blue support line.
I used the falling wedge section as a long position.
(Daily support + weekly central pattern and candle tail)
Among the patterns I have been waiting for,
Because it is the first touch of the central line of the Bollinger Band weekly chart,
I will find the next support line and operate it from today's departure from the second section until this week.
Up to this point, my analysis article is simply asking for your help.
I will see you tomorrow depending on the participation rate today.
I hope you operate safely with the principle of trading and cut-off price.
Thank you.

UJJIVANSFB Price action analysisUjjivan Small Finance Bank Ltd (UJJIVANSFB) is currently trading at 32.35 INR, showing a decrease of 0.59% from its previous close of 32.54 INR . The stock has experienced significant volatility and downward pressure in recent periods:
## Short-term Performance
- In the past 24 hours, UJJIVANSFB has seen a slight increase of 1.13%.
- Over the past week, the stock has fallen by 5.22%.
- The monthly performance shows a decline of 6.91%.
## Long-term Trend
- UJJIVANSFB has demonstrated a substantial decrease of 41.16% over the past year.
- Despite this recent downtrend, the stock has provided a 3-year return of 90.86%, outperforming the Nifty Midcap 100 index which returned 78.49% during the same period.
## Technical Indicators
- The stock is currently trading at its lowest valuation over the past 5 years.
- A bearish stochastic crossover signal appeared on the weekly chart on February 21, 2025. Historically, this signal has been followed by an average price decline of 7.58% within 7 weeks.
- On the daily chart, a bullish Heikin-Ashi candle changeover was observed, indicating a potential short-term reversal.
## Price Targets and Valuation
- Wall Street analysts have set an average 1-year price target of 48.52 INR, with a low forecast of 36.36 INR and a high forecast of 66.15 INR.
- The intrinsic value calculation suggests a base case value of 70.15 INR, indicating that the stock may be undervalued by 54% compared to its current market price.
## Key Levels to Watch
- Support level: 35 INR
- Resistance level: 45 INR
- A breakout above 45 INR with significant volume could signal a potential reversal or move towards higher resistance levels.
While the stock has faced significant downward pressure, some technical indicators and analyst forecasts suggest potential for upside. Investors should closely monitor key support and resistance levels for signs of trend reversal or continuation.
