Sector Rotation in Indian MarketsIntroduction
The Indian stock market is one of the most vibrant, dynamic, and rapidly growing markets in the world. Over the last two decades, India has emerged as a global investment hub, attracting both domestic and foreign investors. Within this vast ecosystem, one concept plays a critical role in how investors allocate their money, time their entries and exits, and build long-term wealth: sector rotation.
Sector rotation refers to the process of shifting investments from one sector of the economy to another based on the economic cycle, market trends, and investor expectations. It is not just about identifying which stock will rise but about understanding which sectors will outperform at a given time. In the Indian context, where the economy is influenced by domestic consumption, global trade, commodity cycles, government policies, and demographic shifts, sector rotation becomes an essential strategy for smart investors.
This article will explore sector rotation in Indian markets in detail—its concept, drivers, historical examples, strategies, risks, and its growing relevance in today’s economy.
Understanding Sector Rotation
Sector rotation is based on the idea that different industries perform better during different phases of the economic cycle. For instance, when the economy is expanding, sectors like banking, infrastructure, and real estate often do well. Conversely, in times of slowdown or uncertainty, defensive sectors like pharmaceuticals, FMCG (Fast-Moving Consumer Goods), and utilities tend to outperform.
The economic cycle typically passes through four phases:
Expansion – Rising GDP growth, improving corporate profits, strong demand, and positive investor sentiment.
Peak – High growth but nearing saturation, inflationary pressures, and possible interest rate hikes.
Contraction – Slowing demand, declining profits, falling investment, and weaker market sentiment.
Trough/Recovery – Stabilization, government interventions, lower interest rates, and early signs of revival.
Each of these stages favors specific sectors. Understanding these shifts allows investors to rotate capital accordingly, capturing returns and reducing risks.
Why Sector Rotation Matters in India
India’s economy is unique compared to developed markets. It is domestically driven, powered largely by consumption, but also influenced by global commodity prices, exports, and foreign capital inflows. The following factors make sector rotation particularly important in India:
High Economic Growth Cycles
India has historically grown faster than most developed economies. This creates frequent sectoral shifts as new industries emerge and old ones adapt.
Policy-Driven Economy
Government policies (such as Make in India, PLI schemes, EV push, green energy initiatives) can rapidly change sector dynamics.
Demographics & Consumption
A young population and growing middle class make sectors like FMCG, retail, and technology highly cyclical and demand-driven.
Global Linkages
Export-heavy sectors like IT services, pharmaceuticals, and metals are influenced by global demand and currency movements, requiring careful rotation strategies.
Liquidity Flows
Foreign Institutional Investors (FIIs) and Domestic Institutional Investors (DIIs) often shift large sums between sectors, driving momentum.
Historical Sector Rotation in Indian Markets
Looking at India’s market history helps illustrate how sector rotation plays out in real time.
1. IT Boom (Late 1990s – Early 2000s)
Trigger: The rise of the internet and Y2K opportunities.
Beneficiaries: Infosys, Wipro, TCS became global giants.
Rotation: Capital moved from traditional industries (steel, cement) to technology.
2. Infrastructure & Realty Boom (2003–2008)
Trigger: High GDP growth, easy credit, and government focus on infrastructure.
Beneficiaries: Construction, real estate, power, and banking stocks.
Rotation: IT took a backseat while infra and realty stocks skyrocketed.
3. Defensive Phase (2008–2010)
Trigger: Global financial crisis.
Beneficiaries: FMCG, pharmaceuticals, utilities (seen as safe havens).
Rotation: Money flowed out of cyclicals into defensives.
4. Banking & Consumption Boom (2014–2018)
Trigger: Political stability (Modi government), reforms like GST, rising urban demand.
Beneficiaries: Private banks (HDFC Bank, Kotak), consumer stocks, and autos.
Rotation: From defensives into growth-oriented consumption themes.
5. New-Age Tech & Specialty Chemicals (2020–2023)
Trigger: COVID-19 pandemic, supply chain shifts, digital acceleration.
Beneficiaries: IT services, digital platforms, specialty chemicals, and pharma.
Rotation: From traditional banking/infra into new-age digital & healthcare themes.
Key Drivers of Sector Rotation in India
Several factors dictate how and when money moves between sectors in the Indian stock market:
1. Economic Growth & Cycles
Strong GDP growth boosts cyclicals (banks, autos, infra).
Slowdowns favor defensives (FMCG, healthcare, utilities).
2. Interest Rates & Inflation
Low rates: Boosts real estate, autos, banks.
High inflation: Commodities, energy, and metals gain.
3. Government Policies
PLI schemes push manufacturing and electronics.
Green energy policies drive renewables.
Budget announcements often trigger sector rotations.
4. Global Trends
US tech trends influence Indian IT.
Global oil prices impact energy, paints, and logistics.
Pharma benefits from global health trends.
5. Corporate Earnings & Valuations
Sectors with better earnings momentum attract capital.
Overvalued sectors see outflows into undervalued opportunities.
6. Liquidity & Investor Sentiment
FIIs often chase large liquid sectors like IT and banks.
Retail investors may favor emerging sectors like EVs and small-cap themes.
Sector Rotation Framework for Investors
Investors can adopt a structured approach to benefit from sector rotation:
Step 1: Identify the Economic Cycle
Track GDP growth, inflation, RBI policy, and global trends.
Step 2: Map Sectors to Phases
Expansion: Banks, infra, real estate, autos.
Peak: Commodities, metals, oil & gas.
Contraction: FMCG, healthcare, utilities.
Recovery: IT, capital goods, mid-cap manufacturing.
Step 3: Track Sectoral Indices
Nifty IT, Nifty Bank, Nifty Pharma, Nifty FMCG, etc.
Rotation is visible when one index outperforms while another lags.
Step 4: Monitor Flows
FIIs/DIIs publish sectoral allocation data.
Mutual funds and ETFs provide clues on trends.
Step 5: Adjust Portfolio
Gradually rotate allocation rather than making sudden shifts.
Use sectoral ETFs, index funds, or top sector stocks.
Examples of Sector Rotation in Today’s Market (2025 Outlook)
Banking & Financials – Benefiting from strong credit growth and rising urban demand.
IT & Digital – Facing global slowdown but long-term digitalization remains strong.
Pharma & Healthcare – Steady defensive play with innovation in generics and biotech.
FMCG – Gaining from rural recovery and stable consumption.
Renewables & EVs – Long-term government push making it a high-growth sector.
Metals & Energy – Dependent on global commodity cycles; near-term volatility expected.
Risks of Sector Rotation
While sector rotation can boost returns, it also carries risks:
Timing Risk – Misjudging the economic cycle leads to poor allocation.
Policy Uncertainty – Sudden government changes (e.g., GST, export bans).
Global Shocks – Oil price spikes, geopolitical tensions can derail sectors.
Overvaluation Risk – Entering a sector too late when valuations are inflated.
Liquidity Risk – Some sectors (like SMEs or niche industries) may lack liquidity.
Practical Tips for Investors
Stay Diversified – Never put all money into one sector.
Follow Sector Leaders – Blue-chip companies signal sectoral momentum.
Use Technical Indicators – Relative strength index (RSI), moving averages for sector indices.
Read Policy Signals – Budgets, RBI minutes, global commodity news.
Use Sector ETFs – Easier to rotate compared to picking individual stocks.
Combine Fundamentals & Technicals – Balance both to avoid emotional decisions.
Conclusion
Sector rotation in Indian markets is not just a theory—it is a practical investing strategy that has repeatedly proven effective over decades. From the IT boom of the 2000s to the infra rally of 2003–2008, the defensive plays of 2008–2010, and the digital acceleration post-COVID, Indian markets showcase clear evidence of money moving from one sector to another as cycles shift.
For investors, understanding sector rotation means being proactive rather than reactive. Instead of chasing hot stocks after a rally, the real winners are those who anticipate the next sectoral leader and rotate their portfolios accordingly.
India’s economic growth story, driven by demographics, policy reforms, and global integration, ensures that sector rotation will continue to play a pivotal role in wealth creation. Whether you are a short-term trader or a long-term investor, mastering sector rotation is like learning the rhythm of the market’s heartbeat—it tells you where to focus, when to shift, and how to stay ahead.
Gann
SME IPO Boom in IndiaEvolution of SME IPOs in India
Pre-2012 Scenario
Before 2012, SME companies found it extremely difficult to raise funds through stock exchanges. The compliance burden, cost of listing, and strict requirements made it nearly impossible for smaller businesses to access capital markets. Their financing largely depended on:
Bank loans (often with collateral).
Private equity/venture capital.
Family funds and informal sources.
Introduction of SME Platforms
In 2012, SEBI (Securities and Exchange Board of India) and stock exchanges launched dedicated SME platforms:
BSE SME Exchange (launched in March 2012).
NSE Emerge (launched in September 2012).
These platforms were specifically designed to simplify compliance, reduce listing costs, and provide a gateway for SMEs to raise funds publicly.
Growth Trajectory
Between 2012–2016: A slow start, as companies and investors were still testing the waters.
2017–2019: Strong pickup, especially in tier-2 and tier-3 cities, as awareness spread.
Post-COVID (2020–2023): Explosive growth, with record numbers of SME IPOs and oversubscriptions, indicating a new trend of investor enthusiasm.
By 2024, hundreds of SME IPOs had listed, many with extraordinary listing gains, capturing national attention.
Why Are SME IPOs Booming in India?
Several factors explain the surge:
1. Rising Investor Appetite
Retail investors have increasingly shown interest in SME IPOs because:
Many SME IPOs have delivered multibagger returns in short periods.
Lower IPO sizes make them accessible.
Grey market activity creates hype before listing.
2. Capital Needs of SMEs
SMEs require funds for:
Expansion of capacity.
Technology upgrades.
Debt repayment.
Marketing and working capital.
Listing on SME platforms gives them visibility and credibility, helping them raise funds at competitive costs.
3. Government Support
Initiatives such as Startup India, Digital India, and Make in India have created a supportive environment for SMEs. The government’s focus on MSMEs as the “backbone of the Indian economy” has encouraged many small firms to formalize and consider stock market fundraising.
4. Exchange and SEBI Initiatives
SEBI has created a lighter compliance framework for SME listings, while BSE and NSE have aggressively promoted their SME platforms through roadshows, seminars, and regional outreach.
5. Growing Retail Participation in Markets
The pandemic era saw an explosion in demat accounts, with retail participation at historic highs. Many first-time investors are experimenting with SME IPOs, attracted by their smaller size and higher potential returns.
6. Strong Secondary Market Performance
Many SME stocks, once listed, have performed far better than mainboard stocks. This secondary market strength has boosted confidence among new investors.
Features of SME IPOs
SME IPOs differ from mainboard IPOs in several ways:
Issue Size: Typically smaller, ranging from ₹10 crore to ₹50 crore, though some go higher.
Eligibility: SMEs with post-issue paid-up capital between ₹1 crore and ₹25 crore can list.
Investors: Minimum application size is higher than mainboard IPOs (e.g., ₹1–2 lakh), designed to attract serious investors.
Trading: SME shares are initially traded in a separate platform with lower liquidity compared to mainboard.
Migration: Once the SME grows and meets eligibility, it can migrate to the mainboard.
Benefits of SME IPOs
For Companies
Access to long-term capital without heavy collateral.
Enhanced brand image and credibility.
Opportunity to attract institutional investors.
Liquidity for promoters and early investors.
Better corporate governance and transparency.
For Investors
Early access to high-growth businesses.
Potential for outsized returns.
Portfolio diversification beyond large-caps and mid-caps.
For the Economy
Formalization of the SME sector.
Job creation and regional development.
Strengthening of India’s entrepreneurial ecosystem.
Risks and Challenges in SME IPOs
While the boom is exciting, SME IPOs are not risk-free.
1. Limited Liquidity
SME stocks often suffer from low trading volumes, making it difficult to exit positions.
2. Higher Business Risk
Many SMEs are in early stages, highly dependent on promoters, and vulnerable to industry shocks.
3. Lack of Research Coverage
Unlike large companies, SME IPOs are rarely tracked by analysts, leaving investors with limited data for decision-making.
4. Valuation Concerns
Some SME IPOs are aggressively priced, relying on hype rather than fundamentals.
5. Grey Market Influence
The unofficial grey market often inflates expectations, leading to volatility post-listing.
6. Regulatory Compliance Burden
Although lighter than mainboard, SMEs still face compliance and governance requirements that can strain smaller firms.
Case Studies: Successful SME IPOs
Example 1: Rex Sealing & Packing Industries Ltd
Listed on NSE Emerge, the IPO was oversubscribed multiple times and delivered strong listing gains.
Example 2: Veekayem Fashion and Apparels Ltd
Attracted huge retail interest due to India’s growing textile exports, and its stock multiplied in value within a year.
Example 3: Drone Destination Ltd
A new-age technology SME IPO that captured attention due to India’s drone policy support.
These examples highlight that SME IPOs span across industries—from textiles and chemicals to technology and healthcare.
Investor Strategies for SME IPOs
Due Diligence: Analyze financials, promoter background, industry prospects.
Subscription Data: Higher subscription (especially QIB and HNI categories) signals confidence.
Avoid Blind Herding: Not all SME IPOs succeed; selective investing is key.
Long-Term View: Treat SME IPOs as long-term investments rather than just listing gain plays.
Diversification: Spread risk by investing in multiple SME IPOs across industries.
Regulatory Safeguards
SEBI has taken several steps to protect investors in SME IPOs:
Mandatory minimum subscription levels.
Strict disclosures of promoter shareholding and related-party transactions.
Lock-in requirements for promoters to ensure long-term commitment.
Migration norms to move from SME platform to mainboard once size criteria are met.
Future of SME IPOs in India
The SME IPO boom is likely to continue, supported by:
Tier-2 and Tier-3 growth: Regional SMEs will increasingly come to market.
Digital platforms: Easier investor access via apps and online brokers.
New-age industries: EVs, drones, fintech, and green energy SMEs will dominate listings.
Policy support: Government’s push for “Viksit Bharat 2047” includes SME empowerment.
However, sustainability of the boom will depend on investor discipline, company performance, and regulatory vigilance.
Conclusion
The SME IPO boom in India marks a new chapter in the evolution of Indian capital markets. What began as a niche experiment in 2012 has grown into a full-fledged ecosystem empowering small businesses and democratizing investment opportunities.
For SMEs, IPOs provide growth capital and visibility. For investors, they offer high-risk, high-reward opportunities. For the economy, they catalyze entrepreneurship, innovation, and job creation.
Yet, caution is essential. Investors must conduct thorough research and not be swayed by hype. Policymakers and regulators must ensure transparency and protect retail investors from excesses.
If managed well, the SME IPO boom can be one of the defining forces in India’s journey towards becoming a $5 trillion economy and beyond, proving that in India’s growth story, small can indeed be big.
GIFT Nifty & Its Impact on Indian MarketsPart 1: Background & Origin of GIFT Nifty
What is GIFT City?
GIFT City (Gujarat International Finance Tec-City) is India’s first International Financial Services Centre (IFSC).
Located near Gandhinagar, Gujarat, it was conceptualized to create a world-class financial hub in India to compete with global centers like Singapore, Dubai, and Hong Kong.
GIFT City offers tax incentives, relaxed regulatory norms, and state-of-the-art infrastructure for global financial institutions to operate.
What is SGX Nifty?
The SGX Nifty was a derivative contract based on the Nifty 50 index, traded on the Singapore Exchange (SGX).
It allowed international investors to take exposure to Indian equities without registering in India.
For years, SGX Nifty acted as a barometer for Indian markets, especially because it traded during hours when Indian markets were closed.
Traders in India would often look at SGX Nifty early morning to predict the likely opening of the Indian stock market.
The Dispute & Transition
In 2018, NSE (National Stock Exchange of India) announced it would stop licensing its Nifty index to foreign exchanges like SGX.
The decision led to arbitration between NSE and SGX, as SGX Nifty had become very popular among global investors.
Finally, a compromise was reached: SGX Nifty contracts would be migrated to GIFT City under NSE IFSC.
On July 3, 2023, SGX Nifty officially rebranded as GIFT Nifty and trading began on NSE IFSC.
Part 2: Structure & Features of GIFT Nifty
Key Features
Underlying Index: Nifty 50 (India’s flagship index).
Contract Type: Futures contracts (similar to SGX Nifty).
Trading Venue: NSE International Exchange (NSE IX) at GIFT City IFSC.
Currency: Denominated in US Dollars instead of Indian Rupees.
Trading Hours: Nearly 21 hours (from 6:30 AM to 2:45 AM IST) — allowing overlap with Asian, European, and US markets.
Participants: International investors, Foreign Portfolio Investors (FPIs), NRIs, and eligible domestic investors.
Types of GIFT Nifty Contracts
Currently, NSE IFSC offers futures contracts on:
GIFT Nifty 50
GIFT Nifty Bank
GIFT Nifty Financial Services
GIFT Nifty IT
This expands the scope beyond just the Nifty 50 index, giving investors wider access to Indian sectoral indices.
Why Dollar Denominated?
International investors prefer USD-denominated contracts as it eliminates INR currency risk.
It makes Indian markets more accessible globally without forcing traders to manage currency exposure.
Part 3: Importance of GIFT Nifty
1. A Gateway for Global Investors
Earlier, SGX Nifty allowed foreign investors to participate in Indian markets indirectly. With GIFT Nifty, India itself now provides that gateway, strengthening its own financial ecosystem.
2. Deepening Market Liquidity
By concentrating derivatives trading within India, NSE IFSC attracts liquidity that was earlier routed abroad.
This boosts India’s derivatives market depth, transparency, and volumes.
3. Enhancing India’s Global Financial Standing
Shifting trading from Singapore to India signals that India is ready to host global investors on its own platform.
This strengthens India’s ambition of making GIFT City a financial hub like Dubai or Singapore.
4. Longer Trading Hours
Indian stock exchanges (NSE & BSE) operate from 9:15 AM to 3:30 PM IST.
GIFT Nifty trades for 21 hours, giving almost round-the-clock access to Indian equity exposure.
This aligns India with global markets, reduces overnight risks, and improves price discovery.
5. Price Discovery & Market Sentiment
Earlier, SGX Nifty served as an indicator of Indian market openings. Now, GIFT Nifty performs that role.
With long trading hours, it reflects global sentiment on Indian equities more effectively.
Part 4: Impact of GIFT Nifty on Indian Markets
A. Impact on Indian Exchanges (NSE & BSE)
Positive: More visibility, control, and revenue for NSE as global trading activity comes under its umbrella.
Neutral/Negative: Indian retail traders may feel disconnected since contracts are in USD and primarily targeted at international investors.
B. Impact on Market Liquidity
Migration of volumes from SGX to GIFT increases liquidity within Indian jurisdiction.
Higher liquidity means tighter spreads, better efficiency, and more robust risk management for investors.
C. Impact on Global Investors
Easier access to Indian markets without worrying about Indian regulations.
Extended trading hours make Indian assets more attractive for hedging and speculative purposes.
Dollar-denominated contracts align with global trading practices.
D. Impact on Domestic Investors
Initially limited, since GIFT Nifty is mainly designed for FPIs and international traders.
However, over time, domestic institutions (like mutual funds and banks) may benefit by using it for hedging foreign flows.
E. Impact on Indian Rupee (INR)
Since contracts are in USD, demand for Indian equities could indirectly influence INR movements.
GIFT City also has potential to become a hub for INR trading in future.
F. Impact on India’s Financial Image
Positions India as a serious global financial player.
Increases foreign confidence in Indian regulatory and market structures.
Part 5: Comparison – GIFT Nifty vs SGX Nifty
Aspect SGX Nifty GIFT Nifty
Location Singapore Exchange NSE IFSC (GIFT City, India)
Currency USD USD
Trading Hours 16 hours 21 hours
Regulator MAS (Singapore) IFSCA (India)
Ownership of Revenues SGX NSE
Underlying Index Nifty 50 Nifty 50, Bank, IT, Financial Services
Role in Price Discovery Yes Yes (now the official one)
The shift essentially moves control and revenues from Singapore to India.
Part 6: Opportunities Created by GIFT Nifty
Boost for GIFT City – The success of GIFT Nifty can attract other asset classes like global bonds, currencies, and commodities.
Increased FPI Flows – Easier access encourages more foreign portfolio investment into India.
Derivatives Ecosystem Expansion – Potential to introduce options, ETFs, and structured products linked to Indian indices.
Cross-Border Collaboration – GIFT Nifty opens avenues for India to collaborate with global exchanges in other products.
Risk Management for Global Investors – Long trading hours provide effective hedging tools.
Part 7: Challenges & Concerns
Liquidity Migration – Will all volumes shift smoothly from SGX to GIFT Nifty? Some traders may prefer Singapore due to familiarity.
Regulatory Environment – Global investors need confidence in IFSCA’s regulatory robustness.
Dollar Contracts Disconnect – Indian retail traders may feel left out since contracts are not INR-based.
Competition from Other Hubs – Dubai, Singapore, and Hong Kong remain strong competitors as global finance centers.
Infrastructure Readiness – GIFT City must maintain world-class standards to handle high-frequency global trades.
Part 8: Long-Term Implications
Strengthening NSE’s Global Role
NSE may emerge as a global exchange platform beyond Indian borders.
Growth of GIFT City
Success of GIFT Nifty sets the tone for making GIFT City India’s Wall Street.
Integration with Global Finance
Longer trading hours and dollar-denomination bring Indian equities closer to global investors.
Increased FPI Confidence
Consistent performance of GIFT Nifty could increase foreign flows into India’s cash equity markets.
Policy Influence
If successful, it could encourage policymakers to replicate such models in bonds, currencies, and commodities.
Part 9: Case Study – First Year of GIFT Nifty
In its first year, GIFT Nifty volumes have been rising steadily.
According to exchange reports, daily average turnover crossed billions of dollars within months.
Many global institutional investors have already shifted positions from SGX.
This indicates strong acceptance and confidence in India’s financial infrastructure.
Conclusion
The launch of GIFT Nifty is a historic milestone in India’s journey toward becoming a global financial powerhouse. By bringing offshore trading of Indian equity derivatives back to Indian soil, it strengthens the domestic ecosystem, enhances liquidity, and improves price discovery.
For global investors, GIFT Nifty provides almost round-the-clock access to Indian markets in a familiar USD-denominated format. For India, it symbolizes financial sovereignty, global competitiveness, and the ambition of positioning GIFT City as an international financial hub.
While challenges remain—such as building liquidity, ensuring robust regulation, and competing with established hubs—GIFT Nifty has already made a significant impact on how the world interacts with Indian equities. Over the next decade, its success could pave the way for India’s deeper integration into global capital markets, making it a win-win for investors, exchanges, and the Indian economy alike.

PCR Trading StrategiesWhy Trade Options?
Options exist because they allow flexibility and creativity in financial markets. Some common uses:
1. Leverage
Small premium controls large exposure.
2. Hedging
Portfolio managers buy Puts to insure against downside.
3. Income Generation
Writing covered calls generates steady premium income.
4. Speculation
Options let traders profit from not just direction, but also time and volatility.
Option Trading Strategies for Different Market Conditions
Bullish Market: Long Calls, Bull Call Spreads.
Bearish Market: Long Puts, Bear Put Spreads.
Sideways Market: Iron Condors, Butterflies.
Volatile Market: Straddles, Strangles.

Part 2 Master Candlestick PatternTypes of Options and Market Participants
1. Call Options (Right to Buy)
A Call Option gives the holder the right to buy an asset at a strike price. Investors use calls when they expect prices to rise.
Example: Buying a TCS ₹3,000 Call at ₹100 premium means you profit if TCS rises above ₹3,100 before expiry.
2. Put Options (Right to Sell)
A Put Option gives the holder the right to sell at a strike price. Used when expecting prices to fall.
Example: Buying Infosys ₹1,500 Put at ₹50 premium pays off if Infosys drops below ₹1,450.
3. Option Market Participants
Hedgers: Reduce risk by using options as insurance. (e.g., farmer hedging crop price, or investor protecting stock portfolio).
Speculators: Bet on price movements to earn profits.
Arbitrageurs: Exploit price differences across markets.
Writers (Sellers): Earn premium by selling options but take on higher risks.
Psychology & Discipline in Option Trading
Trading is not just math. It’s mindset.
Fear of Missing Out (FOMO): Leads to impulsive trades.
Over-Leverage: Options tempt traders with small premiums, causing overtrading.
Discipline: Setting stop-loss, position sizing, and risk management is crucial.
Patience: Most successful option traders focus on probability, not prediction.

Bitcoin Bybit chart analysis September 3Hello
It's a Bitcoin Guide.
If you "follow"
You can receive real-time movement paths and comment notifications on major sections.
If my analysis was helpful,
Please click the booster button at the bottom.
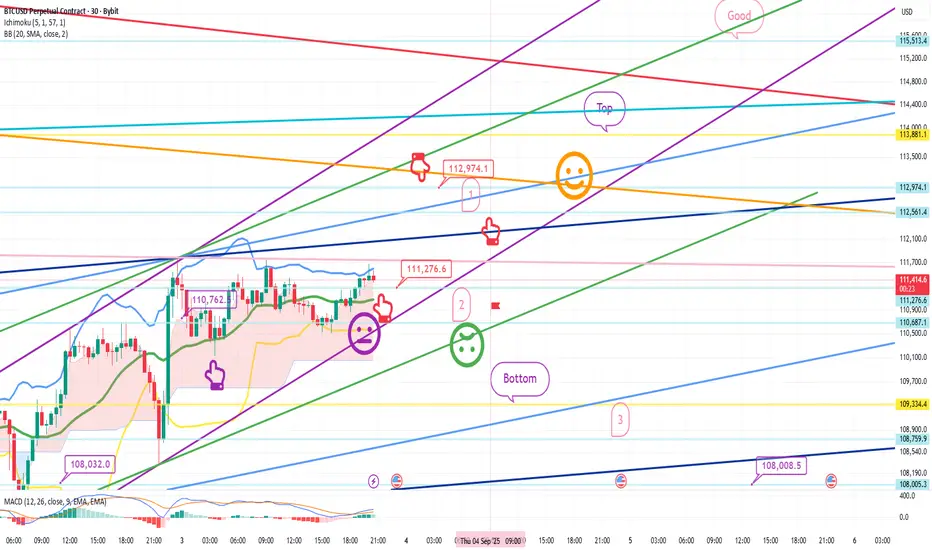
This is a Bitcoin 30-minute chart.
The Nasdaq indicators will be released at 11:00 AM.
At the bottom left is the long position entry point from the 1st, $108.032.
Above that is the purple finger at $110,762.5.
I've linked the strategy to the long position re-entry point.
*If the red finger follows the path,
it's a one-way long position strategy.
1. Long position entry point at $111,276.6 / Stop loss if the green support line is broken.
If the price falls sharply from the current level,
it's a long position waiting point up to section 2.
If the price touches or breaks the green support line,
it breaks the short-term pattern, which is not a good strategy for long positions.
2. Long position at $112,974.1, first target -> top section, second target
When it reaches 112.9K, the first section is the upper section for re-entry into a long position.
The uptrend line is the green support line -> the deep blue support line.
From the second section, it could fall to the bottom -> the third section -> 108K.
From the deep blue support line,
a medium- to long-term correction and sideways trading may follow, so please keep this in mind.
As long as the Nasdaq doesn't crash today, that's fine.
Please use my analysis as a reference only.
I hope you operate safely, with a strict trading strategy and stop-loss orders.
Thank you.
Breakouts & Fakeouts in Trading🔹 Introduction
Financial markets are like living organisms – constantly moving, adjusting, and reacting to news, emotions, and liquidity. For traders, one of the most exciting moments is when a stock, currency pair, commodity, or cryptocurrency seems to break out of its range. Breakouts often lead to big, sharp moves, offering opportunities for quick profits.
But here’s the catch: not every breakout is real. Many are fakeouts (false breakouts) designed by market dynamics, liquidity hunters, or big players to trap traders. The difference between making money and losing money often lies in identifying whether a breakout is genuine or false.
This article dives into:
What breakouts are
Why fakeouts happen
Chart examples (conceptually explained)
Tools to confirm breakouts
Trading strategies to avoid traps
Risk management for breakout traders
🔹 Part 1: What is a Breakout?
A breakout occurs when the price of an asset moves outside a defined support or resistance level with increased momentum.
✅ Common Types of Breakouts
Resistance Breakout – Price moves above a previously strong ceiling.
Support Breakout – Price falls below a previously strong floor.
Trendline Breakout – Price breaks out of a rising or falling trendline.
Chart Pattern Breakout – Price escapes from patterns like triangles, flags, rectangles, or head & shoulders.
Volatility Breakout – When price explodes after a period of consolidation (Bollinger Band squeeze).
Why traders love breakouts?
They indicate a new trend may begin.
They provide clear entry and exit levels.
They often come with higher volume, confirming market interest.
Example: If Nifty is stuck between 19,500–20,000 for weeks and suddenly crosses 20,000 with heavy volume, that’s a bullish breakout.
🔹 Part 2: What is a Fakeout?
A fakeout (false breakout) happens when price temporarily breaks a level, lures traders into positions, but then reverses back into the range.
Fakeouts are dangerous because:
Traders enter aggressively expecting a trend, but get stopped out.
Big players use fakeouts to hunt stop-losses of retail traders.
They often happen during low liquidity or news events.
Example: Price breaks above 20,000, attracts buyers, but quickly reverses to 19,800. That’s a bull trap fakeout.
🔹 Part 3: Why Do Fakeouts Happen?
Fakeouts are not random; they are part of market psychology and structure.
Liquidity Hunting (Stop Loss Hunting)
Smart money knows retail traders place stop-losses above resistance or below support.
They push prices just beyond those levels, trigger stop-losses, then reverse.
Low Volume Breakouts
If breakout happens without strong participation, it’s usually unsustainable.
News & Events
A sudden announcement can cause sharp moves, but once news fades, price falls back.
Algorithmic Manipulation
High-frequency traders may push price beyond levels to create artificial breakouts.
Market Sentiment & Greed
Traders chase breakouts blindly, creating temporary momentum before exhaustion.
🔹 Part 4: Spotting Genuine Breakouts vs Fakeouts
✅ Clues for Real Breakouts
High Volume: Breakouts with above-average volume are stronger.
Retest of Levels: After breakout, price pulls back to test old support/resistance, then resumes trend.
Strong Candle Closes: Large body candles closing beyond the level.
Market Context: Aligns with larger trend or macroeconomic strength.
❌ Signs of Fakeouts
Breakout with low or declining volume.
Long wicks (shadows) beyond resistance/support but weak closes.
Breakouts during off-market hours or thin liquidity.
Price immediately snaps back into range after breakout.
🔹 Part 5: Chart Patterns & Fakeouts
Range Breakouts
Markets consolidate between two levels.
Breakouts beyond range are powerful but also prone to fakeouts.
Triangle Breakouts
Symmetrical/ascending/descending triangles show compression.
Fakeouts are common before the “real” breakout.
Head & Shoulders Pattern
A breakdown below the neckline should confirm trend reversal.
Many times, price breaks below neckline but quickly recovers.
Flag & Pennant Patterns
Strong continuation patterns, but fake breakouts happen if volume is missing.
🔹 Part 6: Strategies to Trade Breakouts & Avoid Fakeouts
1. Wait for Candle Close Confirmation
Don’t jump in immediately; wait for the candle to close above/below the level.
2. Use Volume as Filter
Only trade breakouts with above-average volume.
3. Retest Strategy
Enter on pullback to old support/resistance (safer entry).
4. Multi-Timeframe Confirmation
If breakout is visible on both 1-hour and daily charts, it’s stronger.
5. Combine with Indicators
RSI divergence can warn of false breakout.
Moving averages can confirm trend direction.
6. Avoid News-Driven Breakouts
Trade technical breakouts, not temporary news spikes.
🔹 Part 7: Risk Management in Breakout Trading
Even the best trader cannot avoid fakeouts completely. That’s why risk management is key.
Position Sizing: Risk only 1–2% of account per trade.
Stop Loss Placement:
For upside breakout: place SL below breakout level.
For downside breakout: place SL above breakdown level.
Use Partial Profits: Book some profit early, trail the rest.
Don’t Chase Breakouts: If you miss the first entry, don’t enter late.
🔹 Part 8: Real-Life Examples
Example 1: Stock Breakout
Stock consolidates between ₹500–₹520 for 2 weeks.
Breaks ₹520 with high volume, rallies to ₹550. (Real breakout)
Example 2: Crypto Fakeout
Bitcoin breaks $30,000 resistance but fails to sustain.
Falls back to $29,000 within hours. (Bull trap fakeout)
Example 3: Forex False Breakdown
EUR/USD breaks below 1.1000, triggering short trades.
Reverses sharply to 1.1050. (Bear trap fakeout)
🔹 Part 9: Psychology Behind Breakouts & Fakeouts
Retail Traders: Chase price blindly.
Institutions: Create liquidity zones by triggering retail stop-losses.
Fear & Greed: Traders either fear missing out (FOMO) or panic at reversals.
Patience vs Impulsiveness: Successful traders wait for confirmation, while impulsive ones fall for fakeouts.
🔹 Part 10: Advanced Tips for Professionals
Volume Profile Analysis
See if breakout aligns with high-volume nodes (strong support/resistance).
Order Flow Tools (Level II Data, Footprint Charts)
Helps spot whether breakout is supported by real buying/selling.
Breakout with Trend Alignment
Always trade in direction of higher-timeframe trend.
Market Timing
Breakouts during main sessions (like US market open) are more reliable.
🔹 Conclusion
Breakouts & fakeouts are two sides of the same coin. While real breakouts can deliver powerful moves, fakeouts are equally common and dangerous. The key lies in:
Confirming with volume, retests, and candle closes.
Avoiding emotional FOMO trades.
Protecting capital with risk management.
If you understand the psychology behind breakouts and fakeouts, use confirmation tools, and trade with patience, you can avoid traps and capture the big trend moves that follow genuine breakouts.
Entry to Exit: Step-by-Step Trade Management1. Introduction
Trading is not only about finding the right entry point—it’s about how you manage your trade once you’re inside the market. Many beginners spend countless hours searching for the “perfect” entry strategy, but professionals know that trade management is where the real game is won or lost.
Think of trading as a journey. Entry is the start, exit is the destination, and trade management is the road that connects the two. Without proper management, even the best entry signals can turn into losing trades. On the other hand, with disciplined management, even an average entry can become profitable.
In this guide, we’ll break down the entire trade lifecycle—from preparation to execution, from entry to exit—step by step.
2. Pre-Trade Preparation
Before entering a trade, preparation is key. Just like a pilot runs through a checklist before takeoff, a trader should have a trade checklist.
🔹 Market Research & Analysis
Study broader market trends (bullish, bearish, sideways).
Check fundamentals (earnings reports, economic news, sector performance).
Perform technical analysis (support/resistance levels, chart patterns, moving averages).
🔹 Building a Trade Plan
A trade without a plan is like sailing without a map. A strong trade plan includes:
Entry criteria – What signals will you wait for before entering?
Stop-loss level – Where will you cut the trade if it goes against you?
Target level – Where will you take profit?
Position size – How much capital will you risk?
🔹 Defining Risk per Trade
Professional traders don’t risk everything in one trade. A common rule is the 1-2% risk rule. For example:
If you have ₹1,00,000 capital and risk 1% per trade → max loss = ₹1,000.
This ensures survival even after multiple losing trades.
3. Entry Strategies
Your entry is the first step into the battlefield. A good entry maximizes reward while minimizing risk.
🔹 Types of Entries
Breakout Entries – Entering when price breaks a key resistance/support.
Pullback Entries – Waiting for price to retrace to a support/resistance level before entering.
Reversal Entries – Entering when trend shows signs of changing direction.
🔹 Confirmation Tools
Candlestick patterns (engulfing, hammer, doji).
Indicators (RSI for momentum, MACD for trend confirmation).
Volume analysis (rising volume = strong move).
🔹 Avoiding FOMO Entries
Jumping into trades without confirmation leads to poor risk-reward setups. Always stick to your predefined entry signals.
4. Stop Loss & Risk Management
Stop-loss is your insurance policy. Without it, one bad trade can wipe out weeks of profits.
🔹 Types of Stops
Hard Stop – Pre-set level, automatically exits trade.
Mental Stop – Decided in mind, but dangerous if emotions take over.
ATR Stop – Based on volatility (Average True Range).
🔹 Break-Even Adjustment
When trade moves in your favor, shift stop-loss to entry point → removes risk.
🔹 Risk-Reward Ratio (RRR)
Only take trades with minimum 1:2 or 1:3 ratio. Example: risk ₹1,000 for potential ₹2,000–₹3,000 gain.
5. Trade Monitoring & Mid-Trade Adjustments
Once in a trade, your job is to manage it intelligently.
🔹 When Market Moves in Your Favor
Use trailing stop-loss to lock profits.
Scale out gradually (book partial profits at key levels).
🔹 When Market Moves Against You
Never widen stop-loss (it increases risk).
Accept the loss gracefully—capital preservation is priority.
🔹 Scaling In & Out
Scaling in: Add to your position as trade confirms in your favor.
Scaling out: Reduce position gradually, booking partial profits while still staying in.
6. Trade Psychology
Emotions are the biggest enemy of traders. Fear and greed often sabotage good strategies.
🔹 Common Emotional Traps
Fear of Missing Out (FOMO) – Chasing trades without signals.
Fear of Loss – Closing positions too early.
Greed – Holding too long, ignoring exit plan.
🔹 Discipline Rules
Follow your plan, not your emotions.
Accept that losses are part of the game.
Think in terms of probabilities, not certainties.
7. Exit Strategies
A trade is not complete until you exit. Profits exist only when booked.
🔹 Exit Types
Target-Based Exit – Close trade when it hits your planned profit target.
Trailing Stop Exit – Ride trend while protecting profits.
Time-Based Exit – Exit if price doesn’t move within certain time.
🔹 Letting Profits Run
The hardest skill is to hold winners long enough while not giving back gains. Trailing stops help balance safety & profit.
🔹 Avoid Early Exits
Many traders exit too soon because of emotions. Always follow your planned exit rule, not short-term market noise.
8. Post-Trade Review
Every trade—win or lose—is a learning opportunity.
🔹 Trading Journal
Record every trade:
Entry, exit, stop-loss.
Reasons for trade.
Emotions felt.
Lessons learned.
🔹 Review Process
Analyze losing trades → were they due to bad setup or bad discipline?
Analyze winning trades → did you follow your plan, or was it luck?
Constantly refine your strategy.
9. Conclusion
Trade management is the bridge between analysis and profitability. The entry may give you the opportunity, but it’s management that determines the outcome.
Prepare before you trade.
Enter only with clear signals.
Manage risk with position sizing and stop-loss.
Control emotions during the trade.
Exit with discipline.
Learn from every trade.
By mastering trade management, you shift from gambling to professional trading. In the end, trading isn’t about predicting the market perfectly—it’s about managing uncertainty profitably, from entry to exit.
Part 10 Trading Master Class With ExpertsOptions in Hedging
Options are not only for speculation. Big institutions use them for hedging.
Portfolio Hedge: A fund holding ₹100 crore worth of Nifty stocks may buy Nifty puts. If the market crashes, puts rise in value, cushioning losses.
Corporate Hedge: A company expecting payment in USD may buy currency options to protect against rupee appreciation.
Commodity Hedge: A farmer may use options to lock in selling prices for crops.
Hedging reduces uncertainty and stabilizes income.
Options in Speculation
Speculators love options because:
Small premium = big exposure.
High leverage = high potential returns.
Flexibility to bet on direction, volatility, or time.
But speculation is risky. Most retail traders lose because they treat options as lottery tickets.
Options for Income Generation
Option sellers (writers) earn premium by providing liquidity to buyers.
Covered Call Writing: Regularly selling calls on owned stock generates income.
Cash-Secured Puts: Selling puts on stocks you’re willing to buy at lower prices.
Range-Bound Strategies (Iron Condors, Butterflies): Earn premium if stock stays within range.
Many professionals and institutions rely on option selling for consistent income.

Part 8 Trading Master Class With ExpertsNeutral Market Strategies
Sometimes traders expect the market to move sideways with low volatility. Options shine here:
Straddle: Buy a call & put at the same strike.
Profits if stock makes big move (up or down).
Expensive because of double premium.
Strangle: Buy OTM call & OTM put.
Cheaper than straddle.
Needs a strong move in any direction.
Iron Condor: Sell OTM call + sell OTM put + buy far OTM call + buy far OTM put.
Profits if stock stays within a range.
Popular income strategy.
Butterfly Spread: Combine calls or puts at 3 strike prices.
Best when expecting very little movement.
Advanced Strategies
Calendar Spread: Sell near-term option & buy long-term option at same strike.
Benefits from time decay differences.
Ratio Spread: Sell more options than you buy.
High-risk, high-reward.
Diagonal Spread: Mix of calendar & vertical spread.
Box Spread: Combination that locks in risk-free profit (used by arbitrageurs).
📌 Takeaway: Strategies allow traders to play in bullish, bearish, or neutral markets while controlling risk. Mastery of strategies separates professional traders from gamblers.

Part 2 Ride The Big MovesBasic Terminology
Before we dive deeper, let’s clear the basic terms in option trading:
Underlying Asset – The stock, index, commodity, or currency on which the option is based. Example: Nifty, Reliance, crude oil.
Option Contract – The agreement between buyer and seller of the option.
Call Option – Gives the holder the right (but not obligation) to buy the underlying asset at a fixed price before expiry.
Put Option – Gives the holder the right (but not obligation) to sell the underlying asset at a fixed price before expiry.
Strike Price – The price at which the option holder can buy (call) or sell (put) the underlying.
Expiry Date – The last date when the option can be exercised. In India, stock options usually expire monthly or weekly (for indices).
Premium – The price you pay to buy an option contract. It’s like a ticket fee for having the right to buy or sell in the future.
Lot Size – Each option contract is traded in fixed quantities called lots. Example: Nifty option lot = 50 units.
How Options Work
Imagine you want to buy a house worth ₹50 lakhs, but you’re unsure whether the price will rise or fall in the next 6 months. Instead of paying ₹50 lakhs now, you strike a deal with the owner:
You pay ₹2 lakhs today as a non-refundable fee (premium).
You get the right to buy the house anytime in the next 6 months at ₹50 lakhs (strike price).
Now:
If the house price rises to ₹60 lakhs, you can still buy it at ₹50 lakhs and make a profit.
If the house price falls to ₹45 lakhs, you can walk away. You lose only the ₹2 lakhs premium.
This is exactly how a call option works.
A put option is the reverse: you get the right to sell something at a fixed price, useful if you think prices will fall.
So options are all about rights, not obligations. The buyer has rights, the seller has obligations.

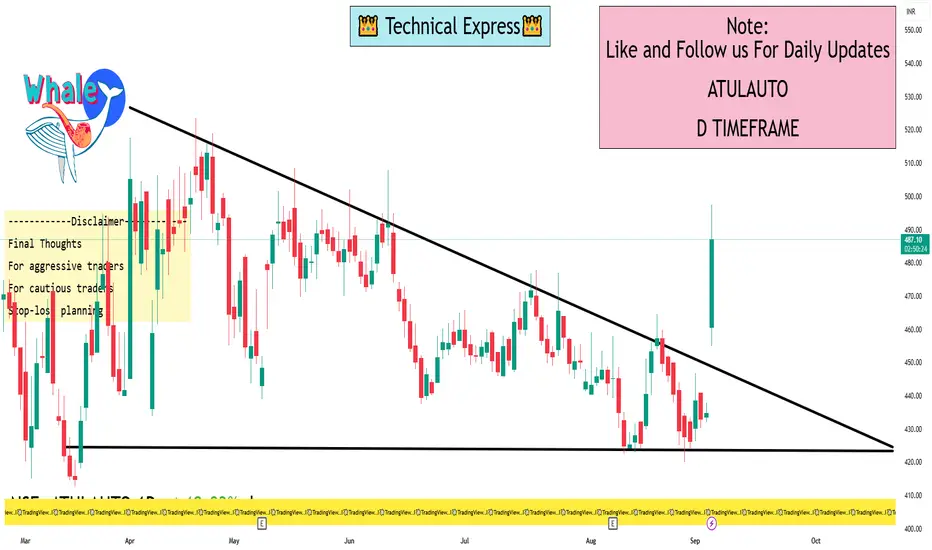
ATULAUTO 1 Day ViewIntraday Support & Resistance (1-Day Level)
MunafaSutra reports:
Short-term Resistance: ₹434.01 and ₹438.97
These levels are cited as valid for intra-day trading scenarios
ICICI Direct shows:
First Support: ₹422.5
Second Support: ₹418.7
Third Support: ₹413.2
Second Resistance: ₹437.2
Third Resistance: ₹441.0
Summary of intraday levels:
Support zone: ~₹422–₹419
Resistance zone: ~₹437–₹441
Current Price Context
ICICIdirect shows a day high of ₹499.05 and day low of ₹449.00, with a last traded price around ₹490.20 as of September 4, 2025
Investing.com also confirms this high volatility range: day’s range ~₹454.95 to ₹497.60
This suggests the stock has already experienced a significant intraday rally, trading well above the traditional short-term resistance levels noted by analysts.
Technical Ratings (Daily Basis)
TradingView categorizes the 1-day timeframe technical summary for Atul Auto as "Neutral" across both Oscillators and Moving Averages
Final Thoughts
For aggressive traders: A breakout above the ₹495–₹503 zone could spark further upside.
For cautious traders: Watch for potential consolidation and hold above ₹475–₹484 as signs of strength. A dip to ₹434–₹444 still maintains bullish structure for now.
Stop-loss planning: Consider trailing protection below key support levels, e.g., around the pivot zone (₹475) or lower support (₹434).
Risk Smart, Grow Fast in TradingIntroduction
Trading has always been seen as a path to quick money, fast success, and even financial freedom. But the truth is that trading is not a get-rich-quick game. For every successful trader who grows fast, there are hundreds who lose money because they ignore the most important foundation of trading: risk management.
“Risk Smart, Grow Fast” is not just a catchy phrase. It’s a principle, a mindset, and a strategy. It means that if you manage your risks wisely, protect your capital, and make decisions with discipline, you can grow faster and more sustainably than if you blindly chase high returns. In fact, smart risk management is the engine that powers growth in trading.
This essay explores the philosophy, strategies, tools, and psychology behind trading with a “Risk Smart, Grow Fast” approach.
Part 1: Why Risk Management Is More Important Than Profit
Most new traders focus on one question: “How much can I make?” The right question, however, is: “How much can I lose if I’m wrong?”
In trading, risk always comes before reward. Here’s why:
Capital Preservation – Without capital, there’s no trading. Losing 50% of your account requires a 100% gain to break even. Protecting your downside ensures you stay in the game.
Compounding Effect – Smaller drawdowns allow compounding to work more efficiently. Even modest profits can grow exponentially when losses are controlled.
Emotional Stability – Large losses trigger fear, stress, and revenge trading. Smart risk control keeps emotions in check, enabling rational decision-making.
Sustainable Growth – Fast growth through reckless risk-taking often ends in collapse. True fast growth comes from controlled risk that compounds over time.
Key Idea: You cannot grow fast unless you manage risk smartly.
Part 2: What Does “Risk Smart” Really Mean?
Being risk smart doesn’t mean avoiding risk altogether. Trading is risk by nature; without risk, there is no reward. Instead, it means taking calculated risks that are aligned with your trading strategy, capital, and goals.
Core principles of being Risk Smart:
Position Sizing – Risking only a small percentage of your capital on each trade (usually 1–2%).
Stop Loss Discipline – Always knowing where you will exit if the trade goes wrong.
Diversification – Not putting all capital into one stock, sector, or instrument.
Risk/Reward Ratio – Ensuring potential reward is at least 2–3 times the risk.
Capital Allocation – Spreading money between short-term trades, long-term investments, and safe reserves.
Think of being risk smart like wearing a seatbelt while driving fast. You may enjoy the thrill of speed, but the seatbelt ensures survival if things go wrong.
Part 3: The Growth Mindset in Trading
While being risk smart focuses on protection, “grow fast” focuses on maximizing opportunities. Growth in trading is not just about profits, but also about knowledge, experience, and adaptability.
Components of the Growth Mindset:
Learning from Losses – Every loss is tuition. Smart traders don’t fear losses; they analyze them to refine strategies.
Adapting to Market Conditions – Markets change; strategies must evolve. What works in a trending market may fail in a choppy one.
Scaling Up Gradually – Growing fast doesn’t mean doubling your risk overnight. It means compounding small consistent gains until you can trade larger with confidence.
Leveraging Technology – Using charting tools, algo trading, backtesting, and data analytics to grow faster than traditional traders.
Mind and Body Discipline – Growth requires sharp focus, emotional control, and physical health. Trading is mental warfare; stamina matters.
Part 4: Balancing Risk and Growth
The challenge is balancing risk smart and grow fast. Too much focus on risk may lead to over-caution, missing opportunities. Too much focus on growth may cause reckless risk-taking.
Here’s how to strike the balance:
Risk Small, Scale Big – Start by risking 1–2% per trade. As your capital grows, absolute profits grow faster.
Compound Gains – Reinvest profits strategically instead of withdrawing all earnings.
Optimize Position Sizing – Adjust size based on volatility, conviction, and account size.
Use Asymmetric Setups – Look for trades where upside is significantly greater than downside.
Review Weekly, Act Daily – Analyze risk exposure weekly while executing growth trades daily.
Part 5: Practical Risk Smart Techniques
The 1% Rule – Never risk more than 1% of account value on a single trade.
Example: With $10,000 capital, maximum risk per trade = $100.
The 2:1 or 3:1 Rule – For every $1 risked, aim to make $2–$3.
Stop Loss & Trailing Stops – Set stop losses for protection and use trailing stops to lock profits as the trade moves in your favor.
Risk Diversification –
Across asset classes (stocks, forex, commodities, crypto).
Across sectors (IT, pharma, banking).
Across time horizons (scalping, swing, long-term).
Hedging with Options – Using protective puts or covered calls to cap downside risk.
Volatility Awareness – Adjusting position size based on market volatility (e.g., smaller trades during high VIX).
Part 6: Strategies to Grow Fast
Trend Following – Capturing large moves in trending markets. “The trend is your friend” until it bends.
Breakout Trading – Entering when price breaks major support/resistance levels with volume confirmation.
Swing Trading – Exploiting short- to medium-term price swings for consistent growth.
Position Trading – Holding positions for weeks/months based on macro or sectoral trends.
Leverage Smartly – Using moderate leverage to accelerate growth, but only when risk is tightly controlled.
Scaling In and Out – Adding to winning trades (pyramiding) and reducing exposure on uncertainty.
Part 7: Psychology of Risk Smart Growth
Trading success is 20% strategy and 80% psychology. To “risk smart, grow fast,” a trader must master their mind.
Discipline Over Impulse – Following the plan, not emotions.
Patience to Wait – Avoiding overtrading. Opportunities will always come.
Resilience to Losses – Viewing losses as part of the game, not personal failure.
Confidence Without Arrogance – Trusting your system but staying humble before markets.
Growth Mindset – Believing that skills improve with practice, not fixed by talent.
Part 8: Case Studies
Case 1: The Reckless Trader
Rahul had ₹5 lakhs and doubled it in 3 months by taking huge leveraged bets on penny stocks. But one wrong move wiped out 80% of his capital. His fast growth collapsed because he was not risk smart.
Case 2: The Risk Smart Trader
Anita had ₹5 lakhs too. She risked only 1% per trade, focused on high R/R setups, and compounded profits. In one year, she grew her account to ₹7.5 lakhs steadily. She didn’t double it overnight, but her growth was sustainable and replicable.
Lesson: Fast reckless growth often leads to collapse. Risk smart growth compounds wealth.
Part 9: Tools for Risk Smart Growth
Trading Journal – Records trades, mistakes, emotions, and improvements.
Risk Calculators – To determine position size before placing a trade.
Charting Platforms – TradingView, MetaTrader, NinjaTrader.
Backtesting Software – To validate strategies before applying real capital.
News & Data Feeds – For staying ahead of market-moving events.
AI & Algo Tools – Automating discipline and minimizing emotional decisions.
Part 10: The Roadmap to “Risk Smart, Grow Fast”
Foundation – Learn basics, risk management, and trading psychology.
System Development – Build and backtest your own trading strategy.
Capital Protection – Apply strict stop losses and position sizing.
Small Scale Trading – Start with small capital or paper trading.
Gradual Scaling – Increase trade size as consistency improves.
Compounding Phase – Reinvest profits to accelerate growth.
Mastery & Automation – Use technology and delegation for efficiency.
Conclusion
“Risk Smart, Grow Fast” is not just a slogan—it’s the essence of long-term trading success. The markets will always remain uncertain, volatile, and risky. But if you respect risk, embrace discipline, and use smart strategies, you can not only survive but thrive.
Fast growth in trading doesn’t come from reckless gambling—it comes from the slow magic of compounding, powered by smart risk management.
In the end, trading is like sailing. The winds of the market are unpredictable, but if you set your sails wisely, control your risks, and ride the waves with patience, you can reach your destination faster than you ever imagined.
Nifty Long Target - 24930, Short Target 24600 . Now @24770Nifty Futures: Long tgt 24920, Short tgt 24600, Now @ 24770. Play both sides, 10 lots can net INR ~2.5 Lakhs. Pls manage MTM.
#Nifty50 #BankNifty @TradingView
#Sensex #StockMarketIndia
@zerodhaonline
#TechnicalAnalysis
@CNBC_Awaaz
#IntradayTrading #OptionTrading #SwingTrading

NIFTY Analysis 4 SEPTEMBER, 2025 ,Morning update at 9 amNifty daily chart shows short covering from oversold zone.
On 30 minutee chart . Nifty sustained above 32.5% retracement, which may act as strong support.
Current price action indicates consolidation around 24755–24771 zone.
If Nifty sustains above 24773, momentum buyers may push towards 24860–24987.
If Nifty fails to hold 24643 and bb pattern forms on 15 min chart, then selling pressure may drag it to 24560 or 24485.
Short covering is visible but not strong trend reversal yet.
Traders must follow levels with strict confirmation.

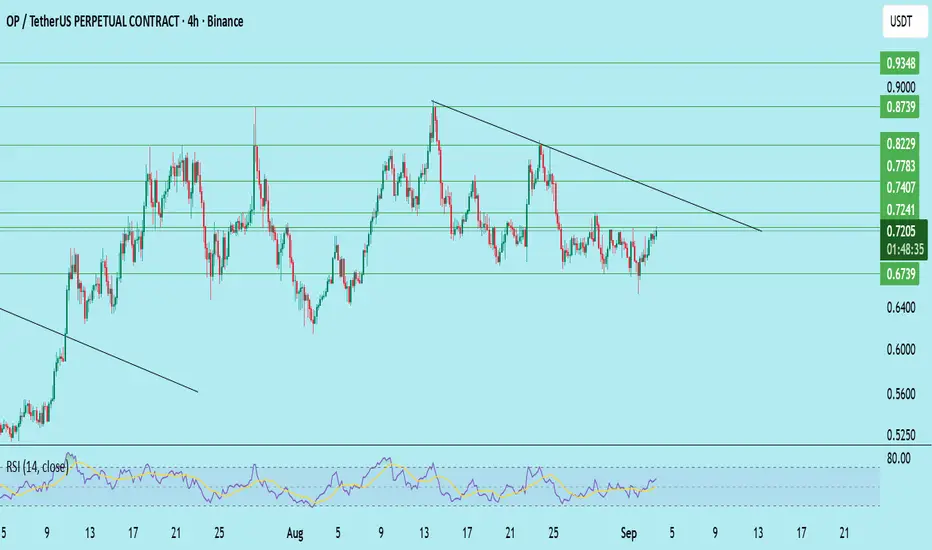
OP/USDT – Potential Breakout SetupOP has been consolidating under a descending trendline since mid-August, but buyers are stepping in around the 0.673 support zone. Recent 4H candles show strength with higher lows forming, while RSI (~58) signals building momentum without being overbought.
Technical Observations:
Descending trendline resistance around 0.724 is the key breakout level.
Price reclaimed the 0.710 zone and is pressing against resistance.
A breakout above 0.724 with strong volume could accelerate momentum toward higher levels.
Support at 0.673 is critical; losing it would invalidate this setup.
Trade Setup:
Entry zone: 0.710 – 0.724 (confirmation needed)
Stop loss: Below 0.673
Targets:
T1: 0.740
T2: 0.778
T3: 0.822
Extended: 0.873 – 0.900
Insights: If OP clears 0.724 and sustains above it, the bullish momentum could continue toward the 0.778–0.822 zone. Failure to hold may result in a retest of the 0.673 support level.
DYOR | Not Financial Advice
Trading Master Class With ExpertsBeginner-Friendly Option Trading Strategies
Let us now study some beginner-friendly option trading strategies in detail.
Covered Call Strategy
Best for: Investors who already own shares.
Market Outlook: Neutral to slightly bullish.
How it works:
Buy or hold 100 shares of a company.
Sell (write) a call option on the same stock.
Example:
You own Infosys shares bought at ₹1600.
You sell a call option at strike ₹1700 for ₹30 premium.
Outcomes:
If Infosys stays below ₹1700, you keep the ₹30 premium (profit).
If Infosys rises above ₹1700, you must sell shares at ₹1700. You still make profit because your cost was ₹1600.
Pros:
Generates steady income.
Low risk.
Cons:
Your profit is capped if stock rises sharply.
Educational takeaway: A covered call is like earning rent on a property you own.
Protective Put Strategy
Best for: Investors who want insurance for their portfolio.
Market Outlook: Bullish, but with fear of downside risk.
How it works:
Buy shares of a company.
Buy a put option for protection.
Example:
You buy TCS shares at ₹3600.
You purchase a put option with strike ₹3500 for ₹50.
If TCS falls to ₹3300, your shares lose ₹300. But your put option gains value, limiting your losses.
Pros:
Acts like insurance.
Protects against big losses.
Cons:
Premium cost reduces net return.
Educational takeaway: A protective put is like buying health insurance—you hope not to use it, but it provides safety.

PCR Trading Strategies Beginner-Friendly Option Trading Strategies
Here are the most important beginner strategies every new trader should know.
Covered Call Strategy (Low-Risk Income Strategy)
Best for: Beginners who already own stocks.
Market Outlook: Neutral to slightly bullish.
How it works:
You own 100 shares of a stock.
You sell a call option on the same stock.
Example:
You own Infosys shares at ₹1600.
You sell a call option with strike price ₹1700 for a premium of ₹30.
If Infosys stays below ₹1700, the option expires worthless, and you keep ₹30 per share as profit.
If Infosys rises above ₹1700, you sell at ₹1700 (still a profit because you bought at ₹1600).
✅ Pros: Steady income, limited risk.
❌ Cons: Profit capped if stock rallies big.
Protective Put (Insurance Strategy)
Best for: Investors who fear stock downside.
Market Outlook: Bullish but worried about risk.
How it works:
You own stock.
You buy a put option as insurance.
Example:
You own TCS shares at ₹3600.
You buy a put option at strike ₹3500 for ₹50 premium.
If TCS falls to ₹3300, your loss on stock is ₹300, but your put option gains value, protecting you.
✅ Pros: Protects against big losses.
❌ Cons: Premium cost reduces profits.

Part 1 Master Candlestick PatternRisk Management for Beginners
Risk management is the most important subject in options education. Even the best strategy fails without discipline.
Rules for beginners:
Never invest all capital in options (limit to 10–20%).
Always use stop-loss orders.
Trade in liquid contracts (like Nifty, Bank Nifty, large-cap stocks).
Understand Greeks (Delta = direction, Theta = time decay, Vega = volatility).
Avoid selling naked options (unlimited risk).
Common Mistakes Beginners Make
Buying cheap out-of-the-money options – They look attractive but often expire worthless.
Ignoring time decay – Options lose value daily.
Overtrading – Too many trades cause losses.
No exit plan – Holding losing positions too long.
Chasing quick profits – Leads to gambling behavior.
Educational Tips for Success
Start with paper trading to learn without risk.
Focus on 1–2 simple strategies first (covered call, spreads).
Keep a trading journal to track mistakes.
Read about market psychology.
Remember: protecting capital is more important than chasing profits.

Nifty Long Target : 24642 , now @ 24577Has given long signal on GANN Indicators. Will be achieved.
#Nifty50 #BankNifty @TradingView #Sensex #StockMarketIndia @zerodhaonline #TechnicalAnalysis #DayTrading @CNBC_Awaaz #IntradayTrading #OptionTrading #MarketsWithETNOW #PriceAction

Zero-Day Option Trading – A Complete GuideIntroduction
In the ever-evolving world of financial markets, few innovations have captured as much attention in recent years as Zero-Day-to-Expiration (0DTE) options, often called zero-day options. These are options contracts that expire on the same day they are traded. While options have existed for decades, the rise of same-day expirations has changed the dynamics of short-term trading, introducing new opportunities as well as new risks.
For traders seeking quick profits, hedging opportunities, or exposure to rapid intraday movements, zero-day options have become a favored tool. But they also come with significant dangers, often magnified compared to traditional options. Understanding how they work, why they have become so popular, and what strategies traders use is essential for anyone interested in modern derivatives trading.
This article explores zero-day option trading in detail, covering their mechanics, advantages, risks, strategies, psychology, and impact on markets.
1. What Are Zero-Day Options?
Options are derivative contracts that give the buyer the right, but not the obligation, to buy (call option) or sell (put option) an underlying asset at a predetermined price (strike price) before or on expiration. Traditionally, options had expiration cycles that were weekly or monthly.
Zero-Day Options (0DTE): These are options that expire on the same day they are traded. If you buy or sell such an option at 9:30 AM when the market opens, it will expire by the market close that same day.
Origins: Initially, exchanges like the Chicago Board Options Exchange (CBOE) offered weekly options on popular indices like the S&P 500 (SPX). Over time, demand for shorter expirations grew, leading to daily expirations. Today, in major U.S. indices, traders can find options expiring every trading day.
Key Example: The most liquid zero-day options are SPX 0DTE options, which allow traders to speculate or hedge intraday moves of the S&P 500.
In essence, 0DTE options compress what used to be a weeks-long or months-long trade into just a few hours.
2. Why Have Zero-Day Options Become Popular?
Several factors have fueled the explosion of interest in zero-day trading:
Rise of Retail Traders: Platforms like Robinhood and Zerodha have democratized access, allowing small traders to speculate intraday with relatively low capital.
Volatility Opportunities: Daily market fluctuations create many chances for fast profits.
Low Premiums: Because these contracts have almost no time value, their premiums are much cheaper than longer-term options, making them attractive to small traders.
Hedging Flexibility: Institutional players use 0DTE options to hedge positions in real-time without holding long-dated contracts.
Algorithmic Trading: Quant funds and high-frequency traders (HFTs) use 0DTE contracts to profit from micro-movements.
In short, they offer speed, flexibility, and leverage—three qualities traders love.
3. Characteristics of Zero-Day Options
Zero-day options differ from regular options in several ways:
Time Decay (Theta): Extremely rapid. An option may lose 50% of its value within an hour.
Implied Volatility (IV): Priced based on near-term expectations; sudden spikes can dramatically move premiums.
Gamma Risk: Very high. Small moves in the underlying asset lead to disproportionately large changes in option prices.
Liquidity: Typically very high in indices like SPX and Nifty Bank in India, enabling easy entry and exit.
Settlement: Most are cash-settled in indices, reducing delivery risk.
These properties make them both powerful trading tools and dangerous traps.
4. Advantages of Zero-Day Option Trading
High Leverage: Small premium outlay, large exposure.
Quick Turnaround: Ideal for intraday traders who want same-day settlement.
Hedging Capability: Institutions hedge unexpected intraday risks.
Lower Capital Requirement: No need to lock money for weeks.
Multiple Expiration Choices: Ability to tailor trades to exact days of market events (Fed meeting, earnings, etc.).
5. Risks of Zero-Day Option Trading
Despite the allure, 0DTE options are not for the faint-hearted:
Near-Total Premium Loss: Out-of-the-money contracts can expire worthless within hours.
Emotional Stress: Requires rapid decision-making; mistakes are common.
Gamma Squeeze Risk: Sudden moves cause exponential losses for sellers.
Limited Recovery Time: Unlike longer options, there’s no time to wait for reversal.
Overtrading: Easy access and cheap premiums tempt traders into gambling.
This is why professional traders often warn beginners against 0DTE trading unless they fully understand the risks.
6. Strategies in Zero-Day Option Trading
6.1 For Buyers
Directional Bets: Buy calls if bullish, puts if bearish. Best suited when expecting large intraday moves.
Lottery Tickets: Out-of-the-money calls/puts bought cheaply in hope of a big payoff.
6.2 For Sellers
Iron Condors / Spreads: Collect premiums by selling options with defined risk. Effective in low-volatility environments.
Straddles / Strangles: Sell both calls and puts to benefit from time decay, but risky if the market moves sharply.
Scalping with Credit Spreads: Institutions often sell 0DTE spreads to collect small but consistent income.
6.3 Advanced
Gamma Scalping: Adjusting delta exposure dynamically as prices move.
Event Plays: Trading around economic announcements (Fed rate decisions, jobs data, RBI policy in India).
7. Psychology of Zero-Day Trading
Trading 0DTE options is as much about psychology as strategy:
Discipline: Entering and exiting trades quickly.
Risk Control: Position sizing is critical since losses can escalate rapidly.
Avoiding Addiction: The lottery-like thrill can lead to compulsive trading.
Emotional Balance: Traders must accept frequent small losses and avoid revenge trading.
8. Institutional vs. Retail Participation
Retail Traders: Generally buyers, attracted to low-cost “lottery” trades.
Institutions: Primarily sellers or hedgers, using spreads and systematic strategies. They often exploit retail demand.
This asymmetry explains why retail often loses money while institutions profit consistently.
9. Zero-Day Options in India
In India, the NSE (National Stock Exchange) has introduced same-day weekly options expiries for Nifty and Bank Nifty. Every day now has an expiry, mirroring the U.S. trend.
Retail participation has surged due to low premiums.
Brokers have reported record turnover in Bank Nifty 0DTE contracts.
Regulators are closely monitoring systemic risks.
This trend is reshaping intraday derivatives trading in India.
10. Criticism and Concerns
Market Stability Risks: Some analysts argue that widespread 0DTE trading increases volatility.
Retail Losses: Evidence suggests most small traders lose money due to poor risk management.
Speculative Nature: Critics compare it to gambling, given how quickly money can be lost.
Despite these concerns, exchanges continue to expand offerings due to high demand.
Conclusion
Zero-day option trading is one of the most exciting yet dangerous developments in modern financial markets. It has transformed options into ultra-short-term instruments, blending elements of speculation, hedging, and high-frequency trading. For disciplined traders who understand risk, 0DTE options offer powerful opportunities. For undisciplined traders, they can be financial landmines.
In summary:
They offer speed, leverage, and flexibility.
They come with extreme risks, especially for retail traders.
Their rise is reshaping both U.S. and Indian derivatives markets.
Ultimately, success in zero-day options lies in combining knowledge, strategy, and psychology—while never forgetting the golden rule of trading: preserve capital first, seek profits second.
Part 9 Trading Masterclass With ExpertsIntroduction to Options
An option is a type of derivative contract. A derivative derives its value from an underlying asset, which could be a stock, index, commodity, currency, or bond. When you buy or sell an option, you don’t directly own the asset but instead own the right to buy or sell it at a pre-agreed price within a specific period.
At its core, an option is a contract between two parties:
The buyer (holder) of the option, who pays a premium for rights.
The seller (writer) of the option, who receives the premium and carries obligations.
Unlike shares, where ownership is straightforward, options deal with probabilities, rights, and conditions. This makes them flexible but also more complex.
Key Features of Options
Before diving deeper, let’s simplify the main features:
Underlying Asset – The financial instrument on which the option is based (e.g., Reliance Industries stock, Nifty50 index).
Strike Price (Exercise Price) – The price at which the underlying asset can be bought or sold.
Expiration Date (Maturity) – The last date the option can be exercised.
Option Premium – The cost of buying the option, paid upfront by the buyer to the seller.
Right but Not Obligation – The buyer can choose to exercise the option but is not compelled to.

Part 4 Institutional Trading Intermediate Strategies
(a) Bull Call Spread
Buy a call at lower strike and sell a call at higher strike.
Reduces cost but caps profit.
Good for moderately bullish markets.
(b) Bear Put Spread
Buy a put at higher strike, sell a put at lower strike.
Used in moderately bearish markets.
(c) Straddle
Buy one call and one put at the same strike and expiry.
Profits if stock makes a big move in either direction.
Expensive, requires high volatility.
(d) Strangle
Buy OTM call + OTM put.
Cheaper than straddle but needs a larger price move.
(e) Iron Condor
Combination of bull put spread + bear call spread.
Profits when price stays in a range.
Great for low-volatility environments.
