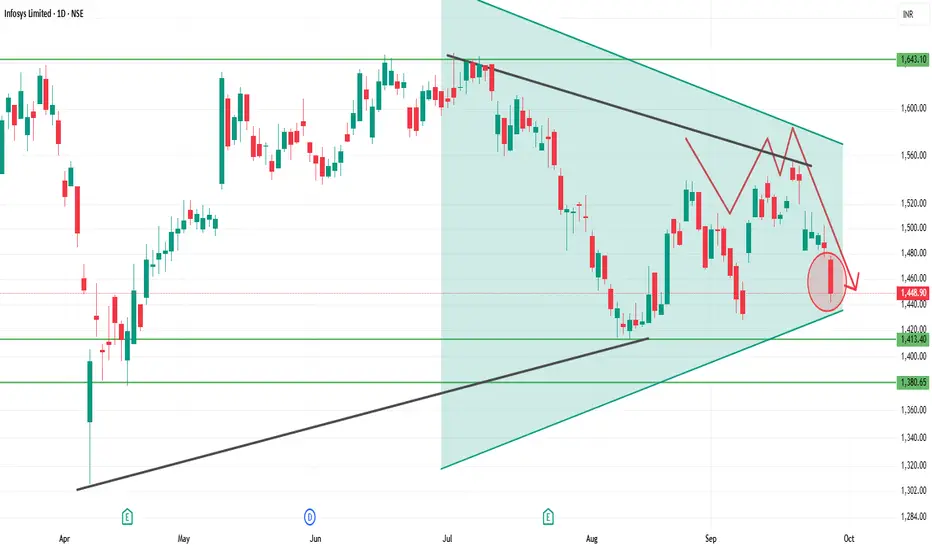
INFY 1D Time frameCurrent Zone: Around ₹1,448 – 1,450 (important support area).
Support Levels:
First support: ₹1,440 – ₹1,448
Next deeper support: ₹1,410 – ₹1,420
Resistance Levels:
Immediate resistance: ₹1,475 – ₹1,485
Strong resistance: ₹1,500 – ₹1,510
Trend Outlook:
Holding above ₹1,448 can trigger a short-term bounce.
Weakness below ₹1,440 may drag it toward ₹1,410.
A close above ₹1,485 would open upside toward ₹1,510+.
Gann
Part 1 Support and Resistance 1. Introduction to Option Trading
Option trading is a type of derivatives trading where traders buy and sell options contracts rather than the underlying asset itself. An option is a financial contract that gives the holder the right, but not the obligation, to buy or sell an underlying asset at a specified price, called the strike price, on or before a specific date (expiration date). Options are widely used in equity, commodity, index, and currency markets.
Unlike traditional stock trading, option trading allows traders to leverage small amounts of capital to potentially earn higher returns. However, with this potential comes higher risk, especially in speculative strategies.
2. Key Terms in Option Trading
Before diving deeper, it’s essential to understand the terminology:
Call Option – Gives the buyer the right to buy the underlying asset at the strike price.
Put Option – Gives the buyer the right to sell the underlying asset at the strike price.
Strike Price (Exercise Price) – The price at which the underlying asset can be bought or sold.
Expiration Date – The date on which the option expires and becomes worthless if not exercised.
Premium – The price paid to buy the option.
Intrinsic Value – The difference between the underlying asset price and the strike price.
Time Value – The portion of the premium reflecting the remaining time until expiration.
In the Money (ITM) – A call option is ITM when the underlying price > strike price; a put option is ITM when the underlying price < strike price.
Out of the Money (OTM) – A call option is OTM when the underlying price < strike price; a put option is OTM when underlying price > strike price.
At the Money (ATM) – When the underlying price = strike price.
3. How Options Work
3.1 Call Options Example
Suppose a stock is trading at ₹100, and you buy a call option with a strike price of ₹105 for a premium of ₹2. If the stock rises to ₹115:
Intrinsic Value = 115 – 105 = ₹10
Profit = 10 – 2 (premium paid) = ₹8
If the stock stays below ₹105, the option expires worthless, and the loss is limited to the premium.
3.2 Put Options Example
Suppose the stock is at ₹100, and you buy a put option with a strike price of ₹95 for a premium of ₹3. If the stock falls to ₹85:
Intrinsic Value = 95 – 85 = ₹10
Profit = 10 – 3 (premium paid) = ₹7
If the stock stays above ₹95, the put expires worthless, and the loss is limited to the premium.
4. Types of Option Trading Participants
Buyers (Holders)
Pay a premium to gain the right to buy or sell.
Risk is limited to premium paid.
Sellers (Writers)
Receive a premium in exchange for obligation to buy or sell if exercised.
Risk can be unlimited in case of naked options, limited if covered.
5. Why Trade Options?
Option trading offers several advantages:
Leverage – Control a larger position with less capital.
Hedging – Protect against price movements in underlying assets.
Income Generation – Sell options to earn premiums (covered calls).
Flexibility – Apply strategies for bullish, bearish, or neutral markets.
Risk Management – Limit losses while maximizing profit potential.

PCR Trading Strategies1. Introduction to Options
Options are financial derivatives that give the holder the right, but not the obligation, to buy or sell an underlying asset at a predetermined price (strike price) before or on a specific date (expiry). Unlike futures, which require the contract to be fulfilled, options allow flexibility. Options are widely used in stock markets, commodities, currencies, and indices.
2. Types of Options
There are two main types of options:
Call Option: Gives the buyer the right to buy the underlying asset.
Put Option: Gives the buyer the right to sell the underlying asset.
Example: Buying a call option of Tata Motors with a strike price of ₹450 allows you to buy the stock at ₹450, regardless of the market price.
3. Option Participants
Option trading involves two primary participants:
Buyer (Holder): Pays a premium and has the right to exercise the option.
Seller (Writer): Receives the premium and assumes the obligation to fulfill the contract if exercised.
4. Premium in Options
The premium is the price paid by the buyer to acquire the option. It consists of:
Intrinsic value: Difference between strike price and current market price.
Time value: Additional cost for potential future profit until expiry.
Example: If a stock is ₹500, and a call option with a ₹480 strike costs ₹25, the intrinsic value is ₹20, and the time value is ₹5.
5. Strike Price
The strike price is the predetermined price at which the underlying asset can be bought (call) or sold (put). Selecting the right strike price is crucial for option strategies.
6. Expiry Date
Options have a limited life. The expiry date determines the last day the option can be exercised. Indian markets follow weekly, monthly, and quarterly expiries.
7. Moneyness of Options
Options are categorized by their moneyness:
In-the-Money (ITM): Exercise is profitable.
At-the-Money (ATM): Strike price equals underlying price.
Out-of-the-Money (OTM): Exercise is unprofitable.
Example: A call option at ₹480 when the stock trades at ₹500 is ITM.
8. Option Greeks
Option Greeks are metrics that measure risk and price sensitivity:
Delta: Price change sensitivity to the underlying asset.
Gamma: Rate of change of Delta.
Theta: Time decay effect on option premium.
Vega: Sensitivity to volatility.
Rho: Sensitivity to interest rates.
9. Long vs. Short Positions
Long Call/Put: Buying options to profit from upward (call) or downward (put) movement.
Short Call/Put: Selling options to collect premium, often used in hedging.
10. Hedging with Options
Options are widely used for risk management. Investors hedge positions to protect against adverse market movements.
Example: If you own Infosys shares, buying a put option can limit downside risk.

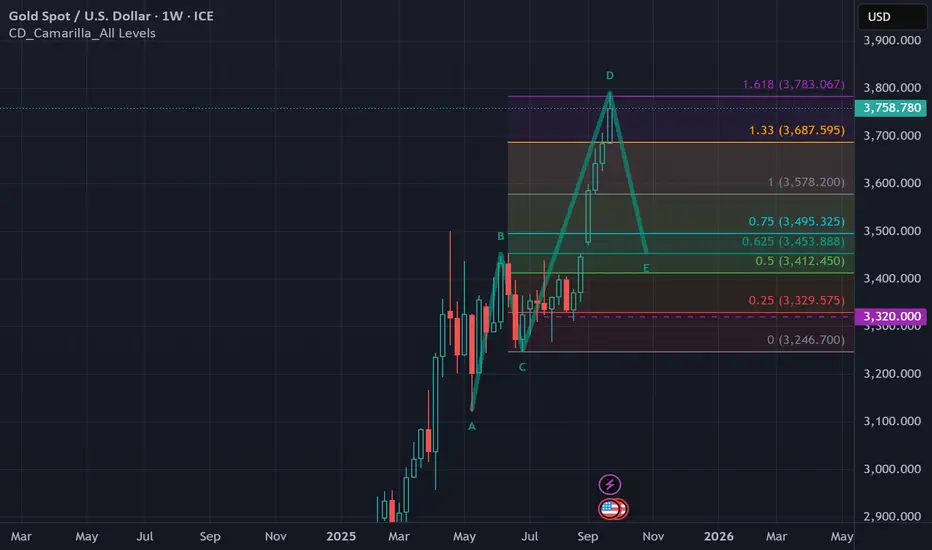
XAU - 1.618 level on 2 week swing chartInteresting to note that we have started to pull back on the 1.618 extension of the previous move on the 2 week swing chart. Only time will tell if we pull back to the 50% or even pull back to the exhaust gap.
NIFTY 50 PREDICTION & PROJECTOINThis analysis is based on previous movement of nifty, If you are looking this chart there is some fact of reversal time is mentioned as nifty taken reversal from a definite time which is 19 bars on the basis of this i am predicting TIME OF REVERSAL.
On the other hand levels are mentioned here is based on GANN FAN which is visible in the chart that levels are lines crossing points of two gann fan. this is for the information only.

Introduction to GIFT Nifty India1. Overview of GIFT Nifty India
GIFT Nifty India refers to the trading of the Nifty 50 index derivatives on the GIFT International Financial Services Centre (GIFT IFSC) in Gandhinagar, Gujarat. GIFT IFSC is India’s first international financial hub designed to provide Indian and global investors with world-class financial infrastructure, competitive taxation, and seamless access to global markets.
The GIFT Nifty index allows investors in the IFSC to trade in Nifty 50 derivatives using a framework similar to global financial markets while benefiting from liberalized rules and currency flexibility, such as trading in USD. This makes GIFT Nifty a bridge between India’s domestic equity markets and global financial players.
2. Historical Background
The GIFT City initiative was conceptualized in 2007, with the vision to create an international financial hub in India, similar to Singapore, Dubai, and Hong Kong. By 2015, the GIFT IFSC was operational, offering a platform for offshore trading, banking, and insurance services.
The introduction of GIFT Nifty derivatives was a significant step towards enabling global investors to participate in Indian equity markets while trading from a tax-friendly and internationally regulated hub. The Securities and Exchange Board of India (SEBI) and the International Financial Services Centres Authority (IFSCA) played a critical role in designing the regulatory framework for GIFT Nifty.
3. Key Objectives of GIFT Nifty
GIFT Nifty serves multiple objectives:
Global Access to Indian Markets: Enables foreign investors to trade Indian equity derivatives without entering domestic regulatory constraints.
Currency Flexibility: Allows trades in USD and other approved foreign currencies.
Risk Management: Provides advanced derivative instruments for hedging and speculative purposes.
Market Depth & Liquidity: Enhances liquidity in Indian equities by attracting international capital.
Integration with Global Financial Markets: Promotes India as a financial hub, aligning with international trading standards.
4. Structure of GIFT Nifty
GIFT Nifty is primarily structured around Nifty 50 Index derivatives, which include:
Futures: Contracts obligating the buyer to purchase and the seller to sell the underlying Nifty index at a predetermined price on a future date.
Options: Contracts giving the buyer the right, but not the obligation, to buy (call option) or sell (put option) the Nifty index at a specified price before the contract expires.
4.1 Settlement and Contracts
Currency: USD or other approved foreign currencies.
Settlement: Cash-settled, avoiding the need for physical delivery.
Contract Size: Typically aligned with domestic Nifty contracts but adjusted for international standards.
Trading Hours: Extended hours to facilitate global investor participation.
5. Regulatory Framework
The GIFT IFSC operates under a unique regulatory ecosystem:
IFSCA Regulations: IFSCA is the primary regulator for financial activities in GIFT IFSC, offering flexibility in market operations.
SEBI Oversight: Domestic regulations for securities derivatives still influence contract specifications.
Tax Benefits: Offshore investors enjoy competitive tax rates compared to domestic markets, promoting global participation.
This combination of regulatory oversight ensures transparency, investor protection, and alignment with international best practices.
6. Trading Mechanism
GIFT Nifty trades through an electronic trading platform similar to NSE and BSE in India but tailored for offshore participants.
6.1 Participants
Foreign Institutional Investors (FIIs)
Non-Resident Indians (NRIs)
Global Hedge Funds and Asset Managers
International Banks
6.2 Order Types
Limit Orders: Buy or sell at a specified price.
Market Orders: Buy or sell at the current market price.
Advanced Order Types: Stop-loss, bracket orders, and algorithmic trading for sophisticated participants.
6.3 Clearing and Settlement
GIFT Nifty derivatives are cash-settled, meaning profits and losses are transferred in cash. Clearing is facilitated by GIFT IFSC-based clearing corporations, ensuring minimal counterparty risk.
7. Risk Management in GIFT Nifty
Trading Nifty derivatives inherently involves market risk, but GIFT IFSC offers advanced risk management frameworks:
Margin Requirements: Participants must maintain margins to mitigate default risks.
Position Limits: Regulatory limits on positions prevent excessive speculation.
Volatility Controls: Circuit breakers and price bands reduce the impact of sudden market movements.
Hedging: Institutional investors often use GIFT Nifty for hedging exposure in domestic Indian markets or international portfolios.
8. Importance for Investors
8.1 For Domestic Investors
Access to offshore markets without leaving India.
Exposure to USD-denominated Nifty derivatives.
Tax efficiency for international trades.
8.2 For Global Investors
Direct exposure to India’s top 50 listed companies.
Flexibility to hedge or speculate using advanced derivatives.
Participation in India’s economic growth story through a regulated, secure platform.
9. Advantages of GIFT Nifty
Global Participation: Enables investors worldwide to trade Indian indices without domestic account constraints.
Liquidity Enhancement: Additional trading volumes increase market depth.
Currency Diversification: Trading in USD or other approved currencies provides an alternative to INR exposure.
Tax Benefits: Offshore tax rules are generally more favorable.
Infrastructure: State-of-the-art trading technology ensures seamless execution.
10. Challenges and Considerations
Despite its advantages, GIFT Nifty comes with certain challenges:
Market Awareness: Global investors need awareness about India-specific market nuances.
Currency Risk: Trading in foreign currencies exposes participants to exchange rate volatility.
Regulatory Complexity: Understanding the dual oversight by SEBI and IFSCA is crucial.
Liquidity Differences: Offshore liquidity may be lower than domestic NSE/BSE markets initially.
Conclusion
GIFT Nifty India represents a milestone in India’s financial evolution, combining domestic equity strength with international trading standards. It provides a platform for global and domestic investors to participate in India’s equity market in a regulated, tax-efficient, and technologically advanced environment.
By bridging the gap between domestic and international markets, GIFT Nifty contributes to liquidity, market depth, and India’s vision of becoming a global financial hub. Its success relies on awareness, liquidity development, continuous innovation, and integration with global financial trends.
In essence, GIFT Nifty India is not just a trading instrument; it is a symbol of India’s growing economic and financial maturity, offering opportunities for risk management, investment, and strategic growth for participants worldwide.

How to plot Gann fan in any stock chartsA Gann Fan is a technical analysis tool developed by W.D. Gann in the early 20th century. It consists of a series of diagonal lines (called Gann angles) emanating from a significant high or low point on a price chart. These lines represent different ratios of price movement to time (e.g., 1x1 for a 45-degree angle, where price changes by 1 unit per 1 unit of time). The tool helps identify potential support and resistance levels, trend strength, and reversal points by assuming markets move in geometric and cyclical patterns.
Common angles include:
1x8 (shallow, ~82.5°)
1x4 (~75°)
1x3 (~71.25°)
1x2 (~63.75°)
1x1 (45° – the key "trendline")
2x1 (~26.25°)
3x1 (~18.75°)
4x1 (~15°)
8x1 (steep, ~7.5°)
In an uptrend, prices above the 1x1 line are bullish; below it, bearish. The fan is most effective on linear-scaled charts where time and price units are equidistant.

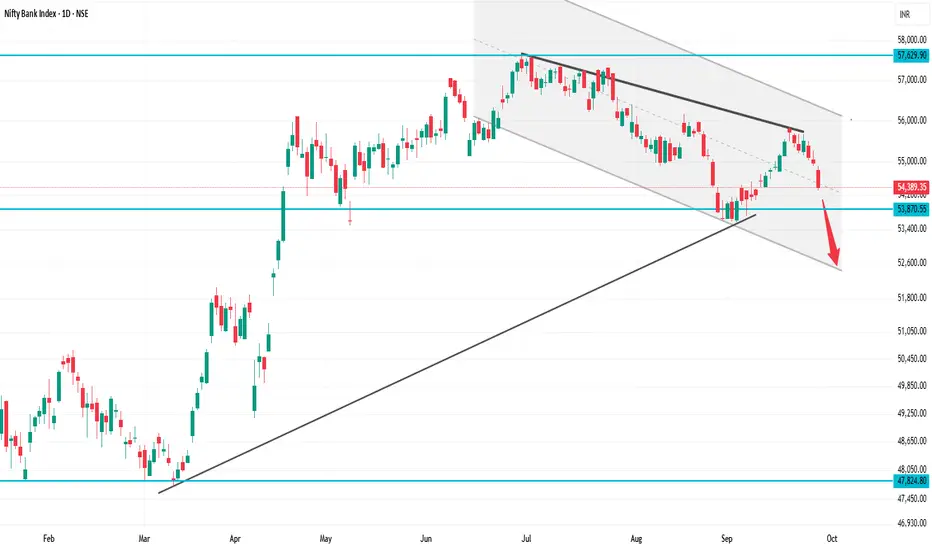
BANKNIFTY 1D Time frame
Previous Close: 55,121
Today Open: 55,061
Day’s High: 55,276
Day’s Low / Last: 54,389
⚡ Strategy
For Intraday / Short-Term Traders:
If BankNIFTY holds above 54,400 – 54,500, a small bounce toward 54,800 – 55,000 is possible.
If it fails to hold 54,400, expect more downside toward 54,000 – 53,800.
Bullish View (Only if recovery): Buy above 54,800 for targets 55,100 – 55,250, SL below 54,500.
Bearish View (Preferred): Sell on rise near 54,700 – 54,900 with SL above 55,000, targets 54,300 → 54,000.
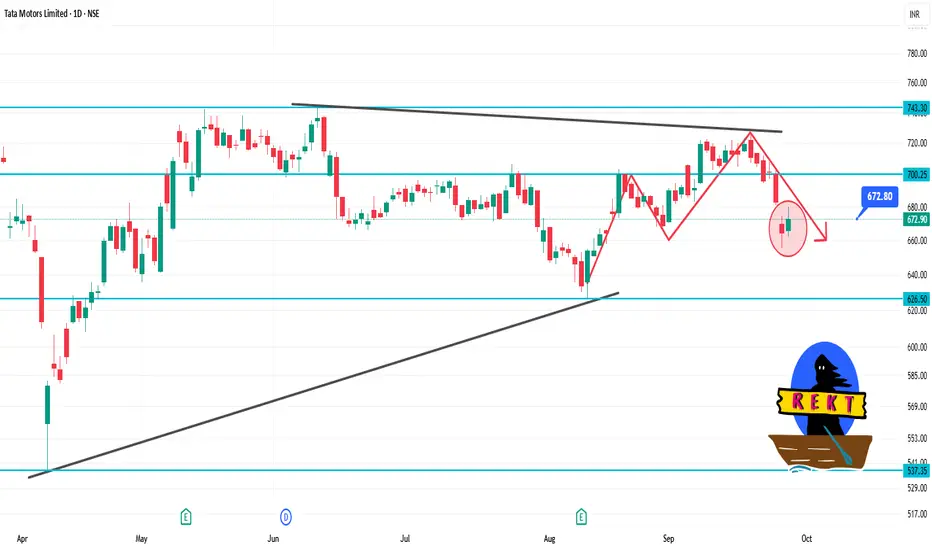
TATAMOTORS 1D Time frameCurrent Price: ₹673.00
Day's Range: ₹662.35 – ₹680.35
Previous Close: ₹664.30
Volume: 15,780,434 shares traded
Market Cap: ₹247,780 crore
52-Week High: ₹1,000.40
52-Week Low: ₹535.75
Face Value: ₹2.00
Beta: 1.30
🧾 Financial Highlights
P/E Ratio (TTM): 11.69
P/B Ratio: 0.00
EPS (TTM): ₹57.54
Dividend Yield: 0.89%
ROE: 28.1%
Book Value: ₹315
📈 Technical Insights
Trend: The stock has shown resilience with strong long-term performance over three years, despite recent challenges compared to the Sensex.
Support Levels: ₹662.35, ₹650.00
Resistance Levels: ₹680.35, ₹700.00
📌 Key Takeaways
Recent Performance: Tata Motors' shares rose over 2% today, snapping a two-day decline, following the announcement that Jaguar Land Rover (JLR) had commenced a phased restart of its operations after a cyberattack.
Analyst Sentiment: Despite recent volatility, Tata Motors remains a top pick among analysts for long-term investment.
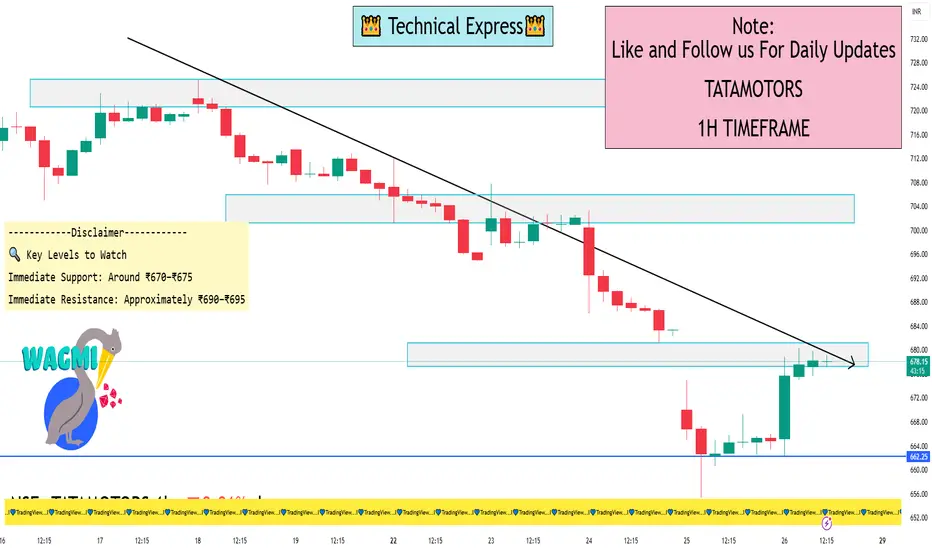
TATAMOTORS 1 Hour ViewOn the 1-hour chart, Tata Motors exhibits a neutral trend, indicating indecision in the short term. Key technical indicators are as follows:
Relative Strength Index (RSI): Approximately 50, suggesting balanced buying and selling pressures.
Moving Averages: The stock is trading near its short-term moving averages, with no clear bullish or bearish crossover.
Volume: Trading volume is consistent with recent averages, showing no significant spikes.
Given these indicators, the stock is consolidating within a range, awaiting a catalyst for a directional move.
🔍 Key Levels to Watch
Immediate Support: Around ₹670–₹675. A breakdown below this level could lead to a retest of ₹650.
Immediate Resistance: Approximately ₹690–₹695. A breakout above this zone may target ₹720–₹730.
⚠️ Market Context
The recent uptick follows a challenging period marked by a cyberattack at Jaguar Land Rover, which had a significant financial impact. While operations are resuming, the stock remains sensitive to further developments.
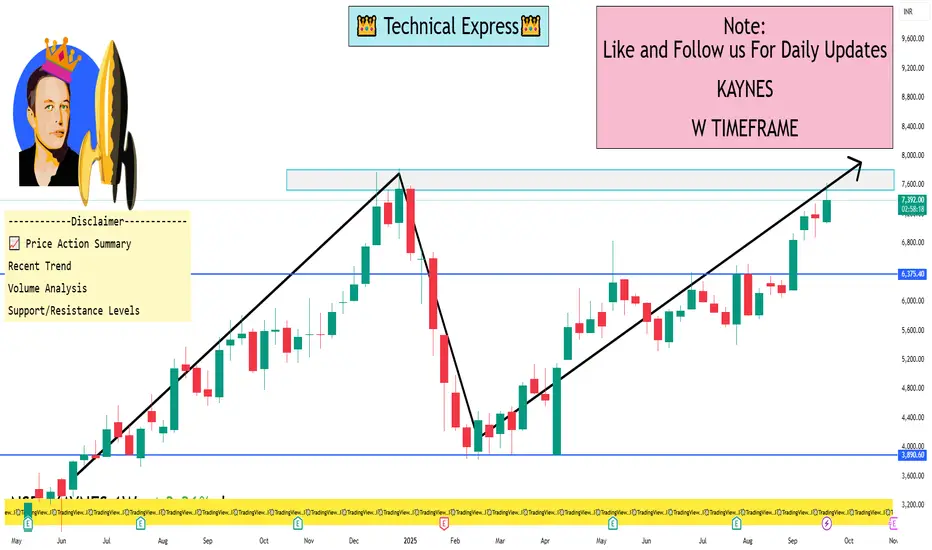
KAYNES 1 Week View 📊 Current Market Snapshot
Current Price: ₹7,379.00
Day's Range: ₹7,375.00 – ₹7,509.00
Previous Close: ₹7,503.00
VWAP (Volume Weighted Average Price): ₹7,445.71
Market Cap: ₹49,725.69 Cr
52-Week High/Low: ₹7,822.00 / ₹3,825.15
P/E Ratio: 156.62
Dividend Yield: 0.00%
Beta: 1.39
Face Value: ₹10.00
Volume: 194,246 shares
🔍 Technical Indicators (1-Day Timeframe)
Moving Averages: Mixed signals; no clear trend direction.
Oscillators: Neutral; no strong buy or sell signals.
Pivot Points: Support around ₹7,375.00; resistance near ₹7,509.00.
MACD: Recently crossed over on September 24, 2025, indicating potential upward momentum.
📈 Price Action Summary
Recent Trend: The stock has shown a slight decline of 1.66% from the previous close, indicating a minor pullback.
Volume Analysis: Trading volume remains moderate, suggesting steady investor interest without significant volatility.
Support/Resistance Levels: Immediate support at ₹7,375.00; resistance at ₹7,509.00. A breakout above resistance could signal a continuation of the upward trend; a drop below support may indicate further downside.
🧠 Market Sentiment
Investor sentiment appears cautiously optimistic, with recent developments such as the company's expansion into OSAT and PCB manufacturing, backed by government subsidies, potentially contributing to positive outlooks.
Key Trading Terminology Every Pro Should Know1. Market Basics
1.1 Asset Classes
Understanding asset classes is fundamental. These include:
Equities/Stocks: Ownership shares in a company.
Bonds: Debt instruments representing a loan made by an investor to a borrower.
Commodities: Physical goods like gold, oil, and wheat traded on exchanges.
Forex: Currency pairs traded in the global foreign exchange market.
Derivatives: Financial instruments whose value derives from an underlying asset, including options and futures.
1.2 Market Participants
Key players in markets include:
Retail Traders: Individual investors trading with personal capital.
Institutional Traders: Organizations such as mutual funds, hedge funds, and banks.
Market Makers: Entities that provide liquidity by quoting buy and sell prices.
Brokers: Intermediaries facilitating trading for clients.
HFT Firms: High-frequency traders using algorithms for rapid trades.
1.3 Market Orders
Orders are instructions to buy or sell an asset:
Market Order: Executed immediately at the current market price.
Limit Order: Executed only at a specified price or better.
Stop Order: Becomes a market order once a specific price is reached.
Stop-Limit Order: Combines stop and limit orders for precise execution.
2. Trading Styles and Strategies
2.1 Day Trading
Buying and selling within the same trading day to capitalize on intraday price movements.
2.2 Swing Trading
Holding positions for several days to weeks to profit from medium-term price swings.
2.3 Position Trading
Longer-term trades based on trends over weeks or months.
2.4 Scalping
Ultra-short-term trading, often seconds to minutes, targeting small profits.
2.5 Algorithmic Trading
Using automated programs to execute trades based on predefined strategies.
3. Technical Analysis Terminology
3.1 Candlestick Patterns
Visual representations of price movements:
Doji: Indicates market indecision.
Hammer: Potential bullish reversal signal.
Shooting Star: Possible bearish reversal.
3.2 Support and Resistance
Support: Price level where buying pressure prevents further decline.
Resistance: Price level where selling pressure prevents further rise.
3.3 Trend and Trendlines
Uptrend: Series of higher highs and higher lows.
Downtrend: Series of lower highs and lower lows.
Trendline: Straight line connecting significant price points to identify direction.
3.4 Indicators and Oscillators
Moving Averages: Smooth price data to identify trends (SMA, EMA).
RSI (Relative Strength Index): Measures overbought or oversold conditions.
MACD (Moving Average Convergence Divergence): Trend-following momentum indicator.
Bollinger Bands: Volatility-based price envelopes.
4. Fundamental Analysis Terminology
4.1 Key Financial Ratios
P/E Ratio: Price-to-earnings ratio indicating valuation.
P/B Ratio: Price-to-book ratio reflecting company worth relative to book value.
ROE (Return on Equity): Profitability relative to shareholder equity.
Debt-to-Equity Ratio: Financial leverage indicator.
4.2 Earnings and Revenue
EPS (Earnings Per Share): Profit allocated per outstanding share.
Revenue Growth: Increase in sales over time.
Profit Margin: Percentage of revenue converted to profit.
4.3 Macroeconomic Indicators
GDP Growth: Economic expansion rate.
Inflation (CPI/WPI): Changes in price levels.
Interest Rates: Cost of borrowing money.
5. Risk Management Terminology
5.1 Position Sizing
Determining the size of each trade relative to portfolio capital.
5.2 Stop Loss and Take Profit
Stop Loss: Limits losses if the market moves against you.
Take Profit: Automatically closes a trade when a target profit is reached.
5.3 Risk-to-Reward Ratio
Ratio of potential loss to potential gain; crucial for evaluating trade viability.
5.4 Diversification
Spreading investments across multiple assets to reduce risk exposure.
6. Derivatives and Options Terminology
6.1 Futures
Contracts to buy/sell an asset at a predetermined price and date.
6.2 Options
Contracts giving the right but not obligation to buy (call) or sell (put) an asset.
6.3 Greeks
Measure sensitivity to various factors:
Delta: Price change relative to underlying asset.
Gamma: Rate of change of delta.
Theta: Time decay of option value.
Vega: Sensitivity to volatility changes.
6.4 Leverage
Using borrowed funds to amplify trading exposure; increases potential gains and losses.
7. Market Conditions and Events
7.1 Bull and Bear Markets
Bull Market: Rising prices and investor optimism.
Bear Market: Falling prices and investor pessimism.
7.2 Volatility
Degree of price fluctuations; often measured by VIX for equities.
7.3 Liquidity
Ability to buy/sell assets quickly without affecting price significantly.
7.4 Gap
Difference between closing and opening prices across trading sessions.
7.5 Market Sentiment
Overall attitude of investors toward a market or asset.
8. Order Types and Execution Terms
Fill: Execution of an order.
Partial Fill: Only part of the order is executed.
Slippage: Difference between expected price and execution price.
Spread: Difference between bid and ask prices.
Bid/Ask: Highest price buyers are willing to pay vs lowest sellers accept.
9. Advanced Trading Terminology
9.1 Arbitrage
Exploiting price differences between markets to earn risk-free profits.
9.2 Hedging
Using instruments to offset potential losses in another investment.
9.3 Short Selling
Selling borrowed shares anticipating a price decline to buy back at lower prices.
9.4 Margin
Borrowed funds to increase position size.
9.5 Carry Trade
Borrowing at a low interest rate to invest in higher-yielding assets.
9.6 Position vs Exposure
Position: Current holdings in an asset.
Exposure: Potential risk from current positions.
10. Psychological and Behavioral Terms
FOMO (Fear of Missing Out): Emotional bias leading to impulsive trades.
Fear and Greed Index: Measures market sentiment extremes.
Overtrading: Excessive trades driven by emotions rather than strategy.
Confirmation Bias: Seeking information that supports pre-existing views.
Loss Aversion: Tendency to fear losses more than value gains.
11. Key Metrics and Reporting Terms
Volume: Number of shares/contracts traded.
Open Interest: Total outstanding derivative contracts.
Volatility Index (VIX): Market’s expectation of future volatility.
Market Capitalization: Total value of a company’s shares.
Index: Measurement of market performance (e.g., Nifty 50, S&P 500).
12. Global Market Terms
ADR/GDR: Instruments for trading foreign shares in domestic markets.
Forex Pairs: Currency combinations like EUR/USD or USD/JPY.
Emerging Markets: Developing economies with growth potential but higher risk.
Commodities Exchange: Platforms like MCX, NYMEX for commodity trading.
13. Regulatory and Compliance Terms
SEBI/NSE/BSE Regulations: Regulatory frameworks governing trading in India.
FATCA/AML: Compliance rules for taxation and anti-money laundering.
Circuit Breaker: Market mechanism to halt trading during extreme volatility.
14. Conclusion: Why Terminology Matters
Mastering trading terminology is crucial for professional success. Knowledge of terms enhances decision-making, improves risk management, and fosters confidence when interpreting market conditions. Professional traders are not just skilled in execution—they understand the language of the market. From basic orders to complex derivatives, every term is a tool to decode price movements, optimize strategy, and ultimately, achieve consistent profitability.
BTCUSD- BUYPerfect support zone good condition to buy
My buying is on 15 min candel with good volume
Low risk trade

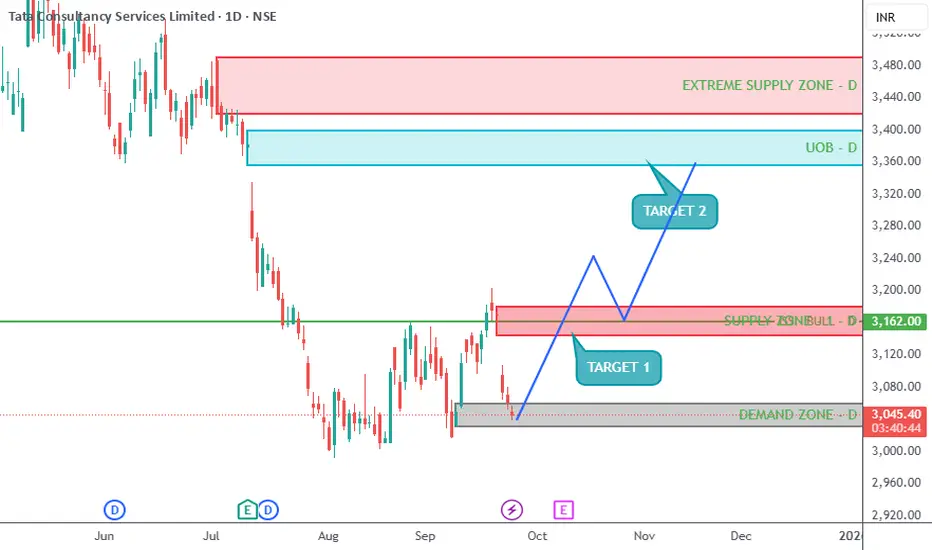
BULLISH TREND - TCS - CASH OR OCT FUTURETCS is being respected at the extreme demand zone and now upside movement will start. TCS can be bought with the stoploss of 3000 and extreme target of 3500. INTERMEDIATE target of 3150-3300 are also there.
TOTAL BULLISH ON TCS TILL NOVEMBER 2025
📉 THIS CHANNEL IS ONLY FOR EDUCATIONAL PURPOSES.
Disclaimer: I am Not a SEBI registered analyst. I just share my positions to do paper trading and no where its a recommendation! Please do your own analysis before taking any trade.
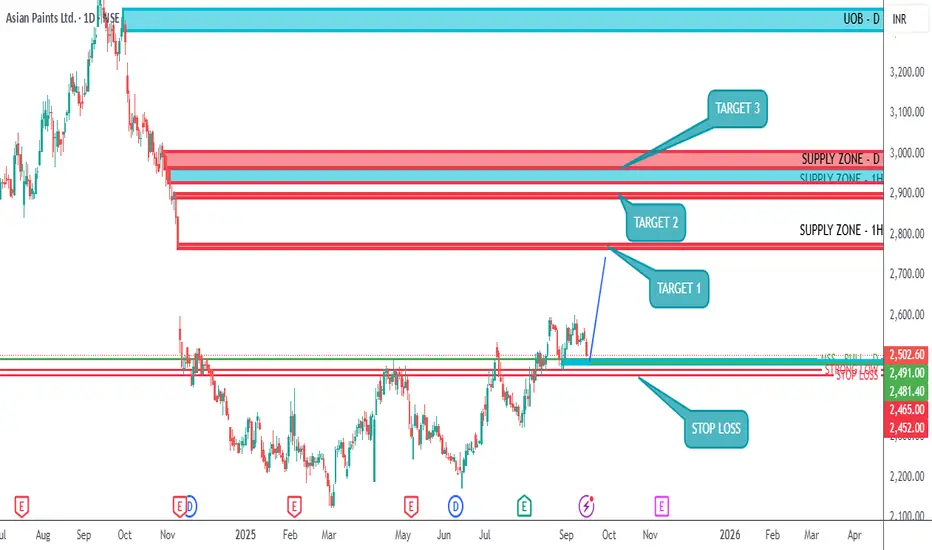
ASIANPAINT - BULLISH TRENDASIANPAINT is looking bullish with an uptrend towards 3000 mark in upcoming 4-5 months. ASIANPAINT has broken the Strong Lower High for a Market Shift of the Structure to bullish and moving towards 3000 mark very soon.
ASIANPAINT has many unmitigated order blocks and unmitigated supply zones at higher levels to be touched and processed.
Bought ASIANPAINT IN CASH at 2500 with a Stop Loss of 2440 for the first target of 2770 by next month and 2900 - 3000 in another 4 - 5 months.
📉 THIS CHANNEL IS ONLY FOR EDUCATIONAL PURPOSES.
Disclaimer: I am Not a SEBI registered analyst. I just share my positions to do paper trading and no where its a recommendation! Please do your own analysis before taking any trade.
USDJPY TRADE || M15 SETUPPrice aggressively retraced after a sharp bullish rally, sweeping equal lows and tapping into a refined demand zone. Now showing a bullish reaction from the zone with clean imbalance above acting as draw on liquidity.
🔹 Key Notes:
– Liquidity grab below short-term low ✅
– Demand zone tapped + bullish order block ✅
– Imbalance above as target ✅
– Tight SL, favorable RR
Looking for price to push back into premium levels, filling inefficiency and taking out internal liquidity on the way up.

DIvergence SecretsUnderstanding Options Trading
With the help of Options Trading, an investor/trader can buy or sell stocks, ETFs, and others, at a certain price and within a certain date. It is a type of trading that offers investors fair flexibility to not purchase a security at a certain date/price.
How Does Options Trading Work?
When a trader/investor purchase or sell options, they attain a right to apply that option at any point in time, although before the expiration date. Merely buying/selling an option does not require an individual to exercise at the time of expiration.
Strategies in Option Trading
Long call options trading strategy
Short call options trading strategy
Long put options trading strategy
Short put options trading strategy
Long straddle options trading strategy
Short straddle options trading strategy
Participants in Options
1. Buyer of an Option
The one who, by paying the premium, buys the right to exercise his option on the seller/writer.
2. Writer/seller of an Option
The one who receives the premium of the option and thus is obliged to sell/buy the asset if the buyer of the option exercises it.
3. Call Option
A call option is an option that provides the holder the right but not the obligation to buy an asset at a set price before a certain date.
4. Put Option
A put option is an option that offers the holder, the right but not the obligation, to sell an asset at a set price before a certain date.
Notable Terms in Options Trading
1. Premium
The price that the option buyer pays to the option seller is referred to as the option premium.
2. Expiry Date
The date specified in an option contract is known as the expiry date or the exercise date.
3. Strike Price
The price at which the contract is entered is the strike price or the exercise price.
4. American Option
The option that can be exercised at any date until the expiry date.
5. European Option
The option that can be exercised only on the expiry date.
6. Index Options
These are the options that have an index as the underlying. In India, the regulators authorized the European style of settlement. Examples of such options include Nifty options, Bank Nifty options, etc.
7. Stock Options
These are options on the individual stocks (with stock as the underlying). The contract gives the holder the right to buy or sell the underlying shares at the specified price. The regulator has also authorized the American style of settlement for such options.

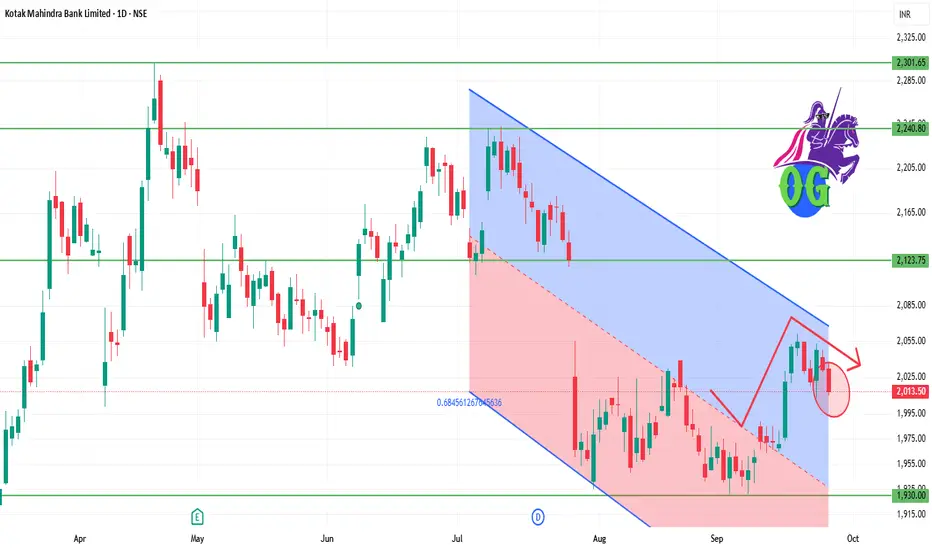
KOTAKBANK 1D Time frame📊 Daily Snapshot
Closing Price: ₹2,013.60
Day’s Range: ₹2,012.50 – ₹2,031.30
Previous Close: ₹2,031.30
Change: Down –0.72%
52-Week Range: ₹1,679.00 – ₹2,302.00
Market Cap: ₹4.04 lakh crore
P/E Ratio: 21.09
Dividend Yield: 0.12%
EPS (TTM): ₹96.30
Beta: 0.80 (indicating lower volatility)
🔑 Key Technical Levels
Immediate Support: ₹2,000.00
Immediate Resistance: ₹2,030.00
All-Time High: ₹2,302.00
📈 Technical Indicators
RSI (14-day): 45.2 – indicating a neutral condition.
MACD: Negative, suggesting bearish momentum.
Moving Averages: Trading below the 50-day and 200-day moving averages, indicating a bearish trend.
📉 Market Sentiment
Recent Performance: Kotak Mahindra Bank's stock declined by 0.72% on September 25, 2025, underperforming the broader market.
Volume: Trading volume was significantly lower than its 50-day average, indicating decreased investor activity.
📈 Strategy (1D Timeframe)
1. Bullish Scenario
Entry: Above ₹2,030.00
Stop-Loss: ₹2,000.00
Target: ₹2,050.00 → ₹2,070.00
2. Bearish Scenario
Entry: Below ₹2,000.00
Stop-Loss: ₹2,030.00
Target: ₹1,980.00 → ₹1,960.00
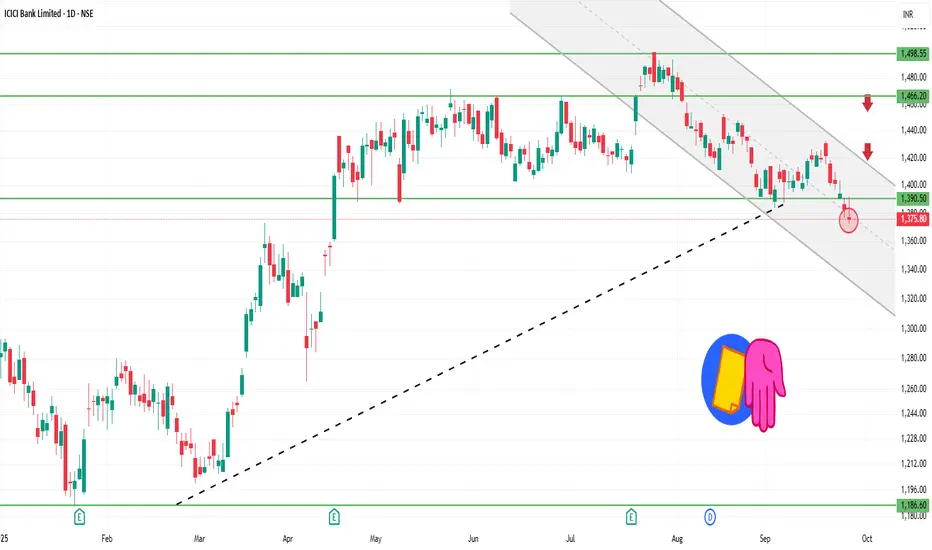
ICICIBANK 1D Time frame📊 Daily Snapshot
Closing Price: ₹1,375.50
Day’s Range: ₹1,371.80 – ₹1,391.50
Previous Close: ₹1,382.70
Change: Down –0.52%
52-Week Range: ₹1,018.85 – ₹1,494.10
Market Cap: ₹9.7 lakh crore
P/E Ratio: 20.5
Dividend Yield: 1.2%
EPS (TTM): ₹67.00
Beta: 1.05 (moderate volatility)
🔑 Key Technical Levels
Support Zone: ₹1,370 – ₹1,375
Resistance Zone: ₹1,390 – ₹1,400
All-Time High: ₹1,494.10
📈 Technical Indicators
RSI (14-day): 34.1 – approaching oversold territory, suggesting potential for a rebound.
MACD: Negative, indicating bearish momentum.
Moving Averages: Trading below the 150-day moving average, indicating a bearish trend.
Candlestick Patterns: Recent formation of a Bearish Engulfing pattern, suggesting potential for further downside.
📉 Market Sentiment
Recent Performance: ICICI Bank has experienced a decline for the fifth consecutive session, underperforming the broader market.
Sector Performance: The NIFTY BANK index also closed lower, reflecting sector-wide weakness.
📈 Strategy (1D Timeframe)
1. Bullish Scenario
Entry: Above ₹1,390
Stop-Loss: ₹1,370
Target: ₹1,405 → ₹1,420
2. Bearish Scenario
Entry: Below ₹1,370
Stop-Loss: ₹1,390
Target: ₹1,355 → ₹1,340
Part 2 Candle Stick PatternParticipants in Options Trading
Options markets consist of four main participants:
Buyers of Calls – Expect the underlying asset’s price to rise. Risk limited to premium.
Buyers of Puts – Expect the underlying asset’s price to fall. Risk limited to premium.
Sellers (Writers) of Calls – Expect prices to remain below the strike price. Risk is theoretically unlimited for naked calls.
Sellers (Writers) of Puts – Expect prices to remain above the strike price. Risk is substantial if the asset falls sharply.
Options Strategies
Option trading is highly versatile. Traders can employ strategies ranging from conservative hedging to speculative bets:
Covered Call: Holding the underlying asset while selling call options to generate income from premiums.
Protective Put: Buying puts while holding the asset to protect against downside risk.
Straddle: Buying a call and a put with the same strike price and expiration, expecting high volatility.
Strangle: Buying out-of-the-money call and put options for lower cost but with a wider price movement range.
Spreads: Combining multiple options to limit risk and potential profit (e.g., bull call spread, bear put spread).
Option Pricing Factors
Option prices are influenced by several variables:
Underlying Asset Price: Higher asset prices increase call values and decrease put values.
Strike Price: The proximity of the strike to the current asset price affects intrinsic value.
Time to Expiration: More time increases time value and option price.
Volatility: Greater market volatility increases the likelihood of significant price changes, raising premiums.
Interest Rates & Dividends: Rising interest rates increase call values and reduce put values; dividend payouts impact stock options.
The most widely used pricing model is the Black-Scholes Model, which calculates theoretical option prices based on these factors.
Advantages of Option Trading
Leverage: Control a larger position with a smaller capital outlay.
Hedging: Protect portfolios against adverse price movements.
Flexibility: Execute a wide range of strategies for bullish, bearish, or neutral markets.
Defined Risk: Maximum loss for buyers is limited to the premium paid.
Profit in Any Market: Options allow for profit in rising, falling, or sideways markets.
Risks of Option Trading
Options are complex and involve risks:
Premium Loss: Buyers can lose the entire premium if the option expires worthless.
Leverage Risk: While leverage amplifies gains, it also amplifies losses for sellers or advanced strategies.
Time Decay (Theta): Options lose value as expiration nears if the underlying price does not move favorably.
Volatility Risk (Vega): Changes in market volatility affect option prices.
Complexity: Advanced strategies can involve multiple positions and require careful monitoring.

Importance of Option Greeks in Trading and Risk Management1. Understanding Options and Their Intrinsic Complexity
Options are contracts that provide the holder with the right, but not the obligation, to buy or sell an underlying asset at a predetermined price (strike price) on or before a specific date (expiration). There are two primary types of options:
Call Options: Give the right to buy an asset.
Put Options: Give the right to sell an asset.
The value of an option is influenced by several factors, including:
Underlying asset price
Strike price
Time to expiration
Volatility of the underlying asset
Risk-free interest rate
Dividends (if any)
While these factors determine an option's price, the dynamic nature of the market requires traders to quantify how sensitive an option is to changes in these variables. This is where Option Greeks come into play. Greeks are named after Greek letters, each representing a specific sensitivity measure.
2. What Are Option Greeks?
Option Greeks are mathematical measures that indicate how the price of an option responds to various market factors. They provide traders with a way to quantify risk and manage exposure systematically.
The primary Option Greeks include:
Delta (Δ) – Sensitivity to underlying price changes
Gamma (Γ) – Sensitivity of Delta to underlying price changes
Theta (Θ) – Sensitivity to time decay
Vega (ν) – Sensitivity to volatility
Rho (ρ) – Sensitivity to interest rates
Each Greek serves a distinct purpose in options trading and risk management.
3. Delta (Δ): The Directional Sensitivity
Definition: Delta measures the rate of change of an option’s price relative to the change in the underlying asset's price. In simpler terms, it tells traders how much the option price is expected to move for a 1-unit move in the underlying asset.
Call options: Delta ranges from 0 to +1
Put options: Delta ranges from 0 to -1
Example:
If a call option has a Delta of 0.60 and the underlying stock moves up by $1, the option price is expected to rise by $0.60.
Importance in Trading:
Delta provides insight into the directional exposure of an options position. Traders can use Delta to:
Hedge stock positions
Estimate probability of an option expiring in the money
Construct Delta-neutral strategies
Delta Hedging:
Traders often aim to maintain a Delta-neutral portfolio to minimize the directional risk of underlying price movements. By adjusting the ratio of options and underlying assets, Delta hedging reduces the portfolio’s sensitivity to small price fluctuations.
4. Gamma (Γ): Measuring the Rate of Change of Delta
Definition: Gamma measures the rate of change of Delta with respect to changes in the underlying asset price. Essentially, Gamma tells traders how much Delta will change if the underlying price moves by one unit.
High Gamma: Delta is highly sensitive to price changes.
Low Gamma: Delta changes slowly.
Example:
If a call option has a Gamma of 0.05, a $1 increase in the stock price increases the Delta by 0.05.
Importance in Trading:
Gamma is crucial for understanding non-linear risk in options positions:
Helps traders gauge the stability of Delta.
High Gamma options are sensitive to price swings, requiring more active risk management.
Traders managing Delta-neutral portfolios monitor Gamma to adjust hedges frequently.
Practical Application:
Gamma is particularly significant for near-the-money options nearing expiration, as small price movements can cause rapid Delta changes.
5. Theta (Θ): Understanding Time Decay
Definition: Theta measures the sensitivity of an option’s price to the passage of time, also known as time decay. Theta is typically negative for long options positions because options lose value as expiration approaches, assuming all else remains constant.
Example:
If a call option has a Theta of -0.03, the option’s price will decrease by $0.03 per day due to time decay.
Importance in Trading:
Theta is critical for understanding the impact of time on option value:
Option sellers benefit from positive Theta as options lose value over time.
Option buyers experience negative Theta, requiring profitable moves in the underlying asset to offset time decay.
Practical Application:
Theta helps traders design income strategies such as:
Covered calls
Iron condors
Short straddles/strangles
Time decay can be a predictable source of profit if managed correctly.
6. Vega (ν): Sensitivity to Volatility
Definition: Vega measures the sensitivity of an option’s price to changes in implied volatility. Implied volatility reflects the market’s expectation of future price fluctuations in the underlying asset.
Example:
If a call option has a Vega of 0.10 and implied volatility rises by 1%, the option’s price increases by $0.10.
Importance in Trading:
Vega is critical for understanding the volatility risk:
High Vega options are more sensitive to changes in market volatility.
Traders use Vega to benefit from volatility trading, regardless of directional moves.
Practical Application:
Vega is central to strategies like:
Long straddles or strangles (profit from increased volatility)
Short volatility trades (profit from declining volatility)
Volatility management is especially important during earnings announcements, economic releases, or geopolitical events.
7. Rho (ρ): Interest Rate Sensitivity
Definition: Rho measures the sensitivity of an option’s price to changes in risk-free interest rates. Rho is more relevant for long-dated options, as interest rate fluctuations impact the present value of the strike price.
Example:
If a call option has a Rho of 0.05 and interest rates increase by 1%, the option price increases by $0.05.
Importance in Trading:
Rho is often less critical than Delta, Gamma, Theta, or Vega for short-term traders but is essential for long-term options strategies or interest-sensitive markets.
Practical Application:
Traders managing options in low-interest-rate vs. high-interest-rate environments monitor Rho to adjust risk exposures.
8. Interdependence of Greeks: The Dynamic Nature of Options
Option Greeks are not isolated; they interact dynamically:
Delta changes with Gamma.
Theta and Vega are interlinked as volatility affects time decay.
Multi-Greek analysis is necessary for sophisticated risk management.
For example, a near-the-money option with high Gamma and low Theta requires frequent adjustments to maintain Delta neutrality, whereas a far-out-of-the-money option with low Gamma and high Vega may be used for volatility plays.
9. Practical Applications in Trading
Option Greeks are critical tools for traders, hedgers, and portfolio managers. Some practical applications include:
9.1 Hedging Strategies
Delta Hedging: Neutralizes directional risk by balancing option and underlying asset positions.
Gamma Hedging: Ensures Delta remains stable as the underlying price moves.
Vega Hedging: Protects against volatility swings in options portfolios.
9.2 Risk Management
Identifying portfolio exposures across multiple Greeks.
Stress-testing scenarios: How would the portfolio behave under extreme price or volatility moves?
Adjusting positions dynamically to reduce undesirable risk.
9.3 Profit Optimization
Exploiting Theta decay through income-generating strategies.
Benefiting from volatility spikes using Vega-sensitive trades.
Structuring multi-leg trades with balanced Greeks for optimal risk-return.
10. Common Trading Strategies and Greeks Usage
Covered Call:
Positive Theta (time decay works in favor)
Delta is partially hedged
Protective Put:
Delta neutralizes stock exposure
Vega protects against volatility rise
Iron Condor:
Positive Theta (benefit from time decay)
Delta-neutral to minimize directional risk
Straddle/Strangle:
High Vega sensitivity (profit from volatility changes)
Requires Gamma and Theta monitoring
11. Advanced Risk Management Techniques Using Greeks
Multi-Greek Hedging:
Professional traders hedge multiple Greeks simultaneously to reduce exposure. Example: Balancing Delta, Gamma, and Vega to create a portfolio resilient to price, volatility, and time changes.
Dynamic Rebalancing:
Greeks change as market conditions evolve. Continuous monitoring and rebalancing of positions help maintain desired risk profiles.
Stress Testing and Scenario Analysis:
Using Greeks to simulate market scenarios and predict option portfolio performance. This is essential for protecting against tail risks and market shocks.
Portfolio Greeks Aggregation:
Large institutions aggregate Greeks across multiple options positions to quantify overall portfolio risk and identify vulnerabilities.
12. Importance for Retail and Institutional Traders
Option Greeks are indispensable tools for both retail traders and institutional investors:
Retail Traders:
Use Greeks to understand basic option sensitivities.
Implement strategies like covered calls, spreads, or protective puts with greater confidence.
Institutional Traders:
Conduct multi-dimensional risk management.
Hedge large portfolios using Delta, Gamma, Vega, Theta, and Rho.
Optimize portfolio performance using scenario analysis and stress testing.
13. Challenges in Using Option Greeks
While Greeks are highly useful, they come with challenges:
Complexity:
Requires understanding of multiple interacting factors.
New traders may find it overwhelming.
Dynamic Nature:
Greeks change with market movements, requiring constant monitoring.
Model Dependence:
Option Greeks are derived from pricing models (like Black-Scholes).
Model assumptions may not hold in extreme market conditions.
Liquidity and Slippage:
Large trades may not perfectly reflect calculated Greek hedges.
Despite these challenges, the benefits of using Option Greeks far outweigh the drawbacks for serious traders.
14. Conclusion
Option Greeks are fundamental tools for anyone serious about options trading and risk management. They quantify sensitivity to market variables such as price movements, volatility, time decay, and interest rates. By understanding and effectively managing Delta, Gamma, Theta, Vega, and Rho, traders can:
Reduce exposure to unwanted risks
Optimize returns
Implement complex hedging and trading strategies
Navigate volatile markets with confidence
In modern financial markets, where volatility and uncertainty are constants, Greeks offer a structured approach to understanding risk and opportunity in options trading. Mastering them is not merely a technical exercise—it is a crucial step toward becoming a disciplined, informed, and successful trader.
Option Greeks transform options from complex derivatives into measurable, manageable, and strategically valuable financial instruments, empowering traders to navigate the markets with precision and foresight.
Bitcoin Bybit chart analysis September 23Hello
It's a Bitcoin Guide.
If you "follow"
You can receive real-time movement paths and comment notifications on major sections.
If my analysis was helpful,
Please click the booster button at the bottom.
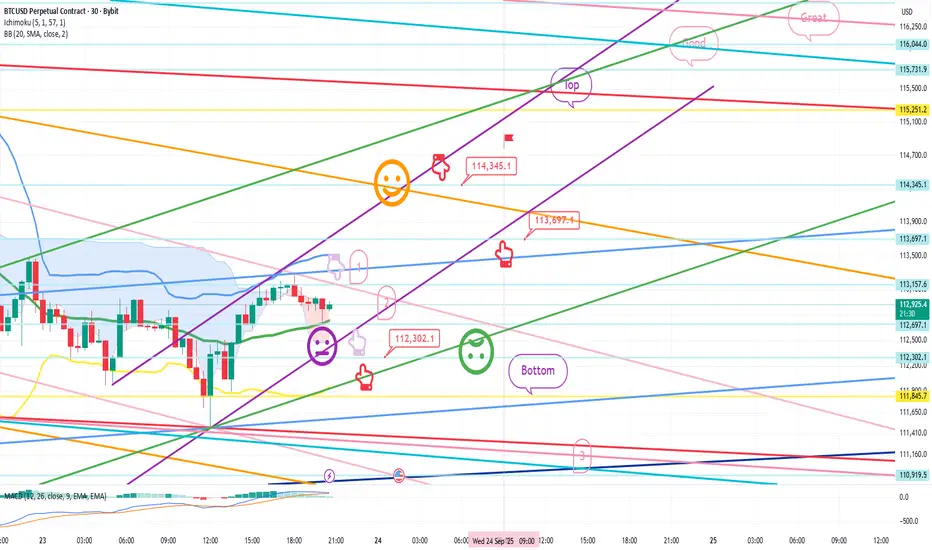
This is Bitcoin's 30-minute chart.
There's an indicator release near 11:00 AM on the Nasdaq,
and I expected a small fluctuation.
I proceeded as safely as possible, considering the current situation.
*When the red finger moves,
One-way long position strategy:
1. Long position entry point at $112,302.1 / Stop loss price if the green support line is broken.
2. Long position initial target at $114,345.1 -> Target prices in order of Top, Good, Great.
After reaching the target price of $114.3K,
you can re-enter the long position at the indicated price of $113.6K.
In the case of 1->2 above,
there's a strong possibility of an upward movement along the purple parallel line. (The 5+15 pattern is still in place.)
The current rebound has already formed a double bottom,
so a drop below the bottom
is not a good move for long positions.
In case of a delay, I've indicated up to section 3 at the bottom.
Thanks to the recent interest from newcomers,
I've made this post publicly available for the first time in a while.
Please use my analysis for reference only.
I hope you operate safely, with a focus on principled trading and stop-loss orders.
Thank you.
Part 2 Ride The Big Moves 1. Option Pricing and Valuation
Option prices are determined by two main components:
1.1 Intrinsic Value
The difference between the current price of the underlying asset and the option’s strike price.
1.2 Time Value
The remaining portion of the premium, reflecting time until expiration and volatility. Options with longer time to expiration usually have higher time value.
1.3 Factors Affecting Option Prices
Underlying Asset Price: Movement in the underlying asset directly affects the option’s value.
Strike Price: Determines whether the option is ITM, ATM, or OTM.
Time to Expiration: Longer expiration provides higher flexibility and premium.
Volatility: Higher volatility increases option premiums.
Interest Rates: Rising interest rates can increase call option values and decrease put option values.
Dividends: Expected dividends reduce the value of call options.
1.4 Option Pricing Models
Black-Scholes Model: Widely used for European options, factoring in asset price, strike price, time, volatility, and risk-free rate.
Binomial Model: Flexible and suitable for American options, where early exercise is possible.
2. Risk and Reward in Options Trading
2.1 Risk for Option Buyers
The maximum risk for buyers is limited to the premium paid. If the market moves unfavorably, the option can expire worthless, but the loss cannot exceed the initial investment.
2.2 Risk for Option Sellers (Writers)
Sellers face potentially unlimited risk:
For a call writer without owning the underlying asset (naked call), losses can be infinite if the asset price rises sharply.
For put writers, losses occur if the asset price falls significantly below the strike price.
2.3 Reward Potential
Buyers have unlimited profit potential for calls and substantial profit for puts if the market moves favorably.
Sellers earn the premium as maximum profit, regardless of market movement, assuming they manage positions correctly.
3. Hedging and Speculation Using Options
3.1 Hedging
Options are a powerful tool for risk management. For instance:
Investors holding a stock can buy put options to protect against downside risk.
Traders can use options to lock in profit targets or minimize losses.
3.2 Speculation
Speculators use options to capitalize on market movements with limited capital. Examples:
Buying calls to profit from an anticipated rise.
Buying puts to profit from an anticipated fall.
Using complex strategies to exploit volatility or time decay.
4. Options in Different Markets
4.1 Stock Options
Options on individual stocks are most popular and widely traded. They provide leverage and hedging opportunities.
4.2 Index Options
Options on market indices like Nifty or S&P 500 allow traders to speculate on broader market trends.
4.3 Commodity Options
Used in commodities markets like gold, crude oil, and agricultural products for hedging or speculation.
4.4 Currency Options
Provide protection or speculation opportunities in the forex market against currency fluctuations.
