Smart Money Secrets: Unlocking the Strategies of Market Insiders1. Understanding Smart Money
Smart money refers to capital controlled by institutional investors, hedge funds, central banks, high-net-worth individuals, or other financial entities that have access to superior information, resources, and analytical tools. Unlike retail traders, who often react emotionally to market events, smart money acts strategically, often positioning itself ahead of major market moves.
Key Characteristics of Smart Money
Informed Decision-Making: Smart money is guided by deep research, access to non-public or early public information, and advanced analytics.
Long-Term Strategy: While retail traders may chase short-term gains, smart money focuses on sustainable trends and risk-adjusted returns.
Market Influence: Large trades by institutional investors can move entire markets, influencing liquidity, price trends, and volatility.
Contrarian Behavior: Often, smart money goes against public sentiment, buying when retail panic sells and selling when retail greed drives prices up.
The essence of smart money is that it is strategically positioned, informed, and patient, making it a crucial concept for anyone seeking to understand market dynamics.
2. How Smart Money Moves
Smart money doesn’t just jump in randomly; its movements are deliberate, carefully calculated, and often hidden until the right moment.
a. Accumulation Phase
This is when smart money quietly starts buying a stock or asset without attracting attention. Retail traders may not notice, and prices may remain relatively flat. The goal is to accumulate a significant position at favorable prices.
Indicators of accumulation:
Increasing volume without major price movement.
Gradual upward trend after a prolonged downtrend.
Strong institutional buying reported in filings (e.g., 13F filings in the U.S.).
b. Markup Phase
Once enough positions are accumulated, smart money begins to push prices higher. This phase attracts retail traders and media attention. Prices may accelerate as momentum builds.
Indicators of markup:
Rising volume coinciding with price increase.
Breakouts above previous resistance levels.
Positive news and analyst upgrades (sometimes intentionally leaked).
c. Distribution Phase
Smart money slowly exits its positions, often selling to late-coming retail traders who are driven by hype. Despite the selling, the market may still appear bullish.
Indicators of distribution:
Volume spikes with minimal price change (selling into demand).
Repeated price rejection at key resistance levels.
Contradictory market sentiment (euphoria among retail investors).
d. Markdown Phase
Finally, the market corrects sharply as smart money has exited, leaving retail traders exposed. This phase often follows peaks in media coverage and public attention.
Indicators of markdown:
Price declines with increasing volume.
Negative news amplifying fear and panic selling.
Technical breakdowns through key support levels.
3. Tools to Track Smart Money
Identifying smart money movements requires using both technical and fundamental tools. Here are some widely used methods:
a. Volume Analysis
Volume spikes often indicate institutional activity. Unlike retail traders who trade in smaller sizes, large trades by institutions create noticeable volume patterns.
On-Balance Volume (OBV) and Volume Weighted Average Price (VWAP) can reveal buying or selling pressure not immediately visible in price charts.
b. Commitment of Traders (COT) Reports
COT reports, available for commodities and futures markets, show the positions of commercial and non-commercial traders. Sharp increases in commercial positions often signal smart money entering the market.
c. Options Market Activity
Unusual activity in call and put options may indicate that insiders or institutions are hedging large trades or anticipating significant moves.
Open interest changes and implied volatility spikes are useful signals.
d. Insider Trading Filings
In publicly traded companies, insider buying or selling can offer clues about smart money sentiment. While insiders may trade for personal reasons, consistent buying from executives can be a strong bullish signal.
e. Dark Pools
Large institutional trades are sometimes executed in private exchanges called dark pools to avoid affecting public prices. Tracking dark pool activity can give insights into hidden accumulation or distribution.
4. Psychology Behind Smart Money
Understanding smart money isn’t just about charts or filings—it’s also about human behavior and market psychology.
Fear and Greed: Retail traders often act on emotional impulses. Smart money exploits these emotions, buying when others fear and selling when others greed.
Patience and Discipline: Smart money waits for the right setup, unlike retail traders who chase immediate profits.
Contrarian Thinking: Going against the crowd is often a hallmark of smart money. Identifying overbought or oversold conditions allows them to capitalize on market sentiment extremes.
5. Strategies to Follow Smart Money
While replicating institutional strategies directly can be challenging due to scale and access, retail traders can learn and adapt techniques inspired by smart money principles.
a. Trend Following
Identify accumulation zones through volume and price analysis.
Ride trends in the markup phase while managing risk.
Avoid panic during minor corrections, focusing on broader smart money-driven trends.
b. Contrarian Investing
Look for areas where retail sentiment is extremely bullish (potential distribution) or extremely bearish (potential accumulation).
Use indicators like Fear & Greed Index, social media sentiment, and retail positioning metrics.
c. Risk Management
Smart money is always risk-aware. Proper position sizing, stop-loss strategies, and portfolio diversification help protect against unexpected moves.
Using tools like options for hedging can replicate professional risk management approaches.
d. Multi-Timeframe Analysis
Smart money operates across multiple timeframes—from intraday moves to multi-year positions.
Combining short-term and long-term charts can reveal where institutional positions are being built and unwound.
6. Common Smart Money Indicators
Several technical and market indicators are considered proxies for smart money activity:
Volume-Price Trend (VPT): Combines volume and price movement to indicate accumulation or distribution.
Accumulation/Distribution Line: Highlights whether a stock is being accumulated (bought) or distributed (sold).
Money Flow Index (MFI): A volume-weighted RSI that can reveal hidden buying/selling pressure.
VWAP (Volume Weighted Average Price): Tracks the average price weighted by volume—smart money often buys below VWAP and sells above it.
Conclusion
The secrets of smart money are not about mystical insider knowledge—they are about observation, discipline, and strategy. By studying market behavior, volume patterns, institutional filings, and psychological trends, retail traders can gain insights into the movements of the largest and most informed market players. While mimicking smart money directly is impossible for most individuals, understanding their methods, motives, and timing can provide a strategic edge, helping you make more informed and confident investment decisions.
Smart money strategies emphasize preparation, patience, and precision. By applying these principles consistently, retail traders can shift from reactive decision-making to proactive, informed, and strategic market engagement.
Gann
BALRAMCHIN Gann fan 45 DegreeApplying the Gann Fan (45° method), the scrip is approaching a strong support zone. Based on this setup, I anticipate the possibility of a sustained uptrend in the coming months. Let’s observe how the price action unfolds in line with the technical outlook.”

BAJFINANCE 1D Time frame1. Pivot Level
₹992 → key short-term pivot.
Above ₹992 → bullish bias.
Below ₹992 → bearish bias.
2. Bullish Setup (if price holds above ₹992)
Entry: Around ₹995–₹998 (after confirming bounce above pivot).
Target:
First target → ₹1,010–₹1,012
Second target → ₹1,020–₹1,025 (if momentum continues)
Stop Loss: ₹990 (just below pivot)
Risk/Reward: Good, roughly 2–3x potential vs stop.
3. Bearish Setup (if price falls below ₹992)
Entry: Around ₹990–₹988 (if close below pivot confirmed).
Target:
First target → ₹980
Second target → ₹965–₹960
Stop Loss: ₹995 (just above pivot)
Risk/Reward: Decent for short-term pullback trade.
4. Notes / Idea Logic
Why it works: ₹992 is acting as a short-term pivot — price respecting this shows strength; breaking it signals weakness.
Volume confirmation: If buying comes with strong volume → bullish; if selling is strong → bearish.
Time frame: This is mainly for 1–3 day trades on the daily chart.
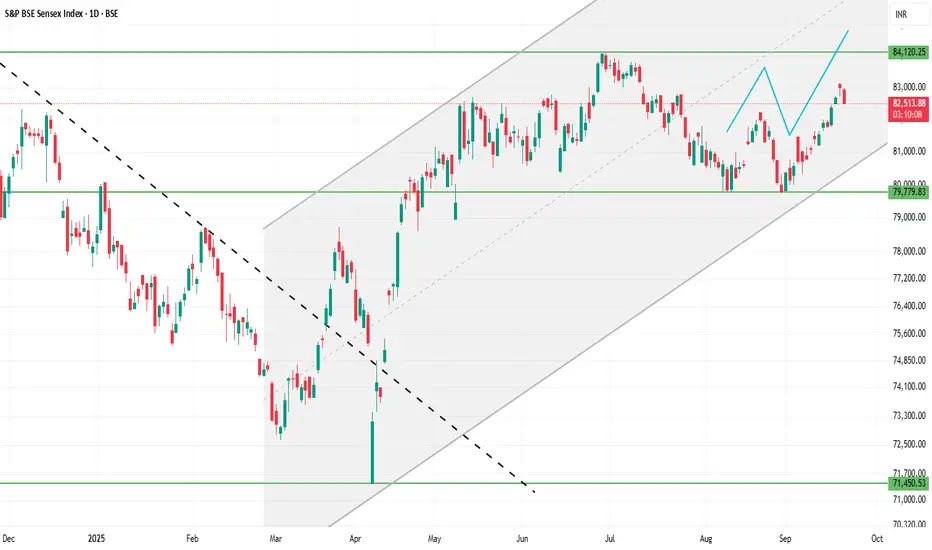
SENSEX 1D Time frameCurrent Facts
Current Level: 82,590.45 - 82,616.13
Trend: Mildly bullish; trading above short-term moving averages (20-day & 50-day EMA).
Momentum Indicators:
RSI (14-day): ~60 → bullish but not overbought.
MACD: Positive → supporting the uptrend.
Price Action: Daily candles show small upper wicks → minor profit-taking near resistance.
⚙️ Outlook
Bullish Scenario:
Holding above 82,450 → retest 82,650–82,700 and possibly 82,850–82,900.
Range / Consolidation:
Price oscillates between 82,400 – 82,650 → sideways trading likely.
Bearish Scenario:
Close below 82,400 → downside risk toward 82,250–82,300 or lower.
⚠️ Key Facts
82,500–82,600 acts as a short-term pivot: above it favors bulls, below it favors bears.
Resistance at 82,650–82,700 is key; breakout here may trigger further upside.
Support at 82,400–82,450 is critical; failing to hold may lead to short-term correction.
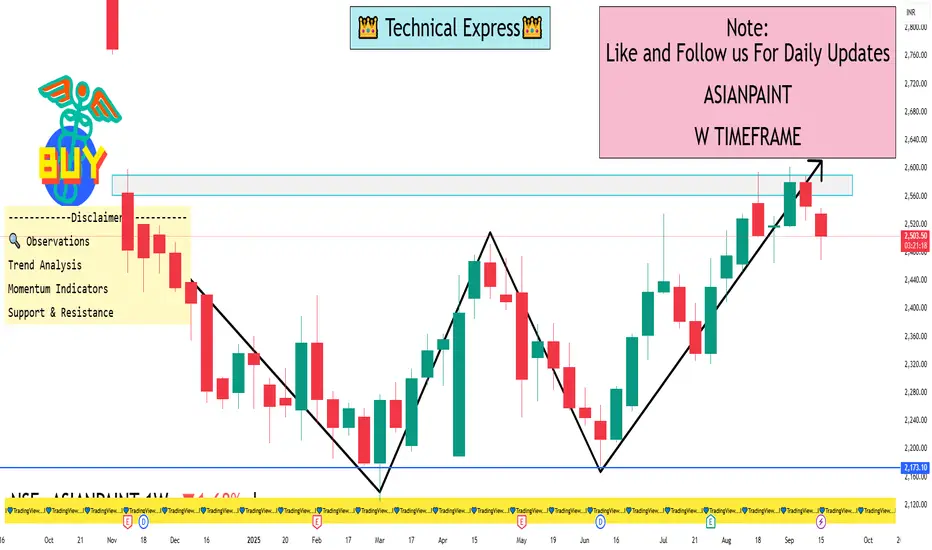
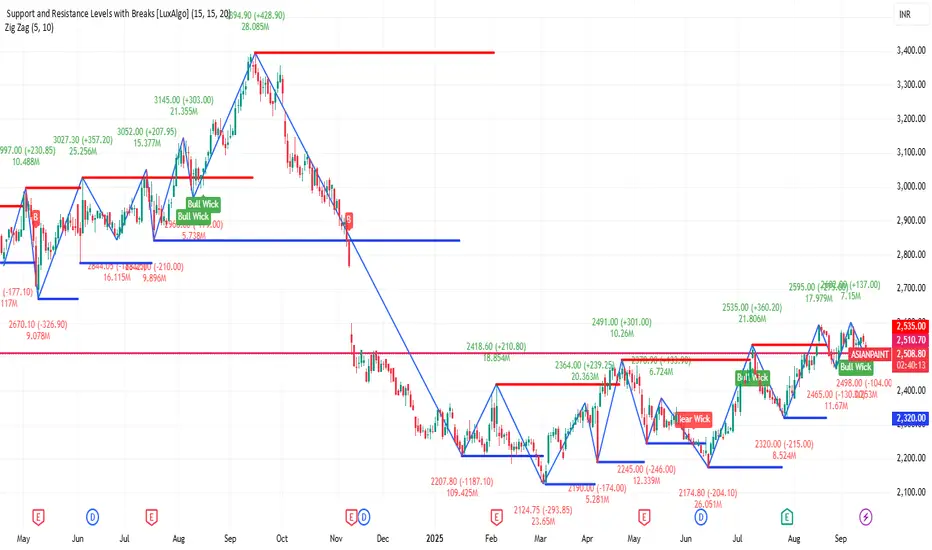
ASIANPAINT 1 Week View📊 Weekly Support & Resistance Levels
Support Levels:
S1: ₹2,524.63
S2: ₹2,502.97
S3: ₹2,481.13
S4: ₹2,452.73
Central Pivot: ₹2,553.57
Resistance Levels:
R1: ₹2,568.13
R2: ₹2,589.97
R3: ₹2,611.63
R4: ₹2,647.13
Central Pivot: ₹2,553.57
📈 Technical Indicators (Weekly Timeframe)
Relative Strength Index (RSI): Indicates a bullish trend.
Moving Average Convergence Divergence (MACD): Shows a bullish crossover, supporting upward momentum.
Moving Averages: Both 50-day and 200-day moving averages are trending upwards, confirming a positive short-term outlook.
Pivot Points: Trading above the central pivot suggests a bullish bias.
🔍 Observations
Asian Paints has been trading within a parallel channel since May 2021. A significant gap-down breakdown occurred in November 2024, followed by a series of bearish candles. If the current momentum persists, further downward movement is possible. However, the stock is approaching key support levels, which may act as a cushion against further declines.
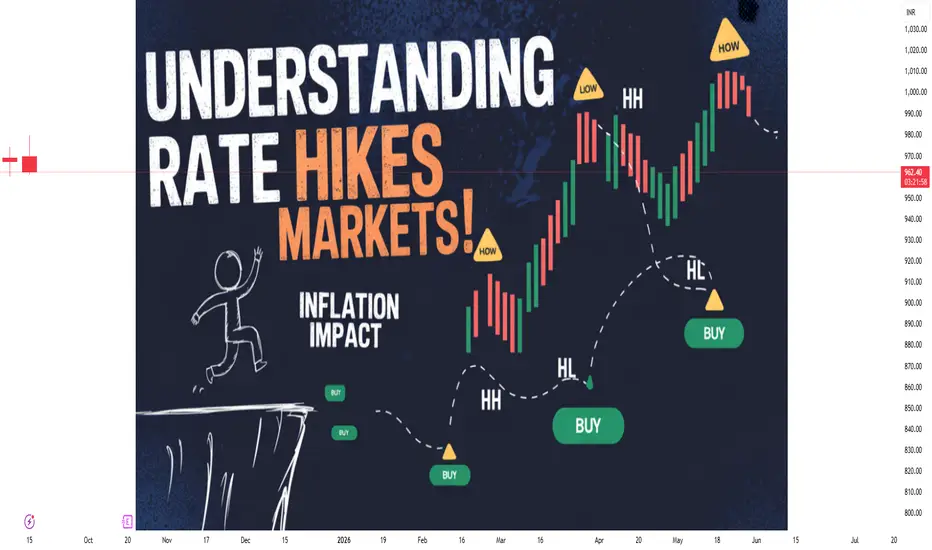
Rate Hikes: Interest Rates vs. Inflation1. Introduction: The Relationship Between Interest Rates and Inflation
At its core, inflation refers to the sustained rise in the general price level of goods and services in an economy over time. When prices rise faster than incomes, purchasing power declines, impacting consumers, businesses, and investors.
Interest rates, on the other hand, represent the cost of borrowing money or the reward for saving. Central banks, like the Federal Reserve (US), Reserve Bank of India (RBI), or European Central Bank (ECB), manipulate policy interest rates to influence economic activity.
Key relationship:
When inflation rises beyond the central bank’s target, interest rates are often increased (a process called a “rate hike”) to curb spending and borrowing.
Conversely, during periods of low inflation or deflation, central banks may lower interest rates to stimulate demand.
2. How Central Banks Use Rate Hikes to Control Inflation
2.1 The Mechanism of Monetary Policy
Central banks influence inflation primarily through monetary policy tools. Rate hikes are part of tightening monetary policy, which affects the economy in several ways:
Borrowing Costs Increase: Higher interest rates make loans for businesses and consumers more expensive. This reduces spending on big-ticket items like houses, cars, and capital investments.
Savings Become Attractive: As banks offer higher returns on deposits, consumers may save more and spend less, reducing aggregate demand.
Currency Appreciation: Higher rates often attract foreign capital, strengthening the domestic currency. A stronger currency makes imports cheaper, which can reduce imported inflation.
Expectations Management: Rate hikes signal the central bank’s commitment to controlling inflation, which can influence wage negotiations, business pricing decisions, and consumer behavior.
2.2 Transmission Mechanism
The impact of rate hikes on inflation is not instantaneous. It passes through the economy via the interest rate transmission mechanism, which works through:
Credit channel: Expensive credit discourages borrowing.
Asset price channel: Rising rates reduce stock and real estate valuations, leading to lower wealth effect and reduced spending.
Exchange rate channel: Higher rates attract capital inflows, boosting the currency, reducing import costs, and easing inflation.
Typically, the full impact of a rate hike is observed over 12–24 months.
3. Types of Inflation and Rate Hikes
Not all inflation is the same, and the effectiveness of interest rate hikes depends on the source of inflation:
3.1 Demand-Pull Inflation
Occurs when aggregate demand exceeds supply.
Example: Booming economy with high consumer spending.
Rate hike effect: Very effective, as higher borrowing costs reduce spending.
3.2 Cost-Push Inflation
Occurs when production costs rise, e.g., due to higher wages, oil prices, or supply chain disruptions.
Rate hike effect: Less effective, as inflation is supply-driven rather than demand-driven.
3.3 Built-in Inflation
Caused by adaptive expectations, where past inflation influences future wage and price increases.
Rate hike effect: Moderate, but signaling by the central bank can anchor inflation expectations.
4. Historical Perspective on Rate Hikes and Inflation
Studying historical trends helps illustrate how interest rate adjustments influence inflation:
4.1 US Experience
1970s: Stagflation with double-digit inflation. The Fed raised rates sharply under Paul Volcker, with the federal funds rate peaking at ~20%. Inflation eventually came under control, but the economy experienced a severe recession.
2000s–2020s: Post-2008 financial crisis, rates were near zero to stimulate the economy. Inflation remained low, demonstrating that low rates don’t always trigger high inflation if other conditions (like excess capacity) persist.
4.2 Indian Experience
RBI uses repo rates to manage inflation, targeting CPI (Consumer Price Index) inflation around 4% ±2%.
Example: During 2010–2013, high food and fuel inflation prompted the RBI to raise repo rates to curb prices, stabilizing inflation over time.
4.3 Emerging Markets
Rate hikes in emerging markets often have the dual objective of controlling inflation and maintaining currency stability.
Over-tightening can trigger slowdowns, especially in economies with high debt levels.
5. Rate Hikes vs. Economic Growth
While rate hikes are effective in controlling inflation, they have trade-offs:
5.1 Impact on Investment
Higher borrowing costs reduce business investments in new projects.
Stock markets often react negatively, especially for high-debt sectors.
5.2 Impact on Consumers
Loans (housing, education, personal loans) become more expensive, reducing disposable income.
Luxury and discretionary spending decline.
5.3 Risk of Recession
Aggressive rate hikes can slow the economy too much, leading to contraction.
Policymakers must balance inflation control with growth sustainability.
6. Rate Hikes and Financial Markets
Financial markets react dynamically to rate hikes:
6.1 Stock Markets
Typically, rate hikes are bearish for equities as corporate profits may decline due to higher financing costs.
Growth stocks (tech) are more sensitive than value stocks.
6.2 Bond Markets
Bond prices fall as yields rise.
Investors shift to shorter-duration bonds during rate hike cycles.
6.3 Forex Markets
Domestic currency tends to strengthen as higher rates attract foreign capital.
This can impact export competitiveness but reduce import-driven inflation.
6.4 Commodities
Commodities priced in USD may decline as stronger currency reduces local demand.
Gold often falls during rate hikes because it doesn’t yield interest.
7. Rate Hikes in a Global Context
Interest rate policy in one country can influence others:
7.1 Spillover Effects
Higher US rates often lead to capital outflows from emerging markets.
Countries may raise rates in tandem to protect their currency and control inflation.
7.2 Global Inflation Trends
Oil prices, supply chain disruptions, and geopolitical events can override local rate hikes.
Central banks must consider global factors while adjusting rates.
8. Challenges in Managing Inflation Through Rate Hikes
8.1 Lag Effect
Monetary policy effects are delayed; policymakers often act based on inflation expectations rather than current data.
8.2 Supply-Side Constraints
Rate hikes cannot solve inflation caused by supply shortages or geopolitical disruptions.
8.3 Debt Burden
Economies with high corporate or household debt may be more sensitive to rate hikes, risking defaults.
8.4 Policy Communication
Miscommunication can destabilize markets. Clear forward guidance is crucial.
Conclusion
Interest rates and inflation are intricately linked. Rate hikes are a powerful tool to control inflation, but they come with trade-offs for growth, investment, and financial markets.
Key takeaways:
Rate hikes reduce demand and curb inflation but may slow growth.
Demand-pull inflation responds better to rate hikes than supply-driven inflation.
Timing, magnitude, and communication of rate hikes are crucial.
Global interdependencies mean domestic rate policy must consider international factors.
Investors and traders must adapt strategies in response to rate hikes, balancing risk and opportunity.
Ultimately, the goal of rate hikes is stability—stable prices, sustainable growth, and predictable financial markets. Policymakers walk a delicate tightrope, balancing inflation control with the need to foster economic activity, making the study of interest rates versus inflation an essential part of modern finance and economics.
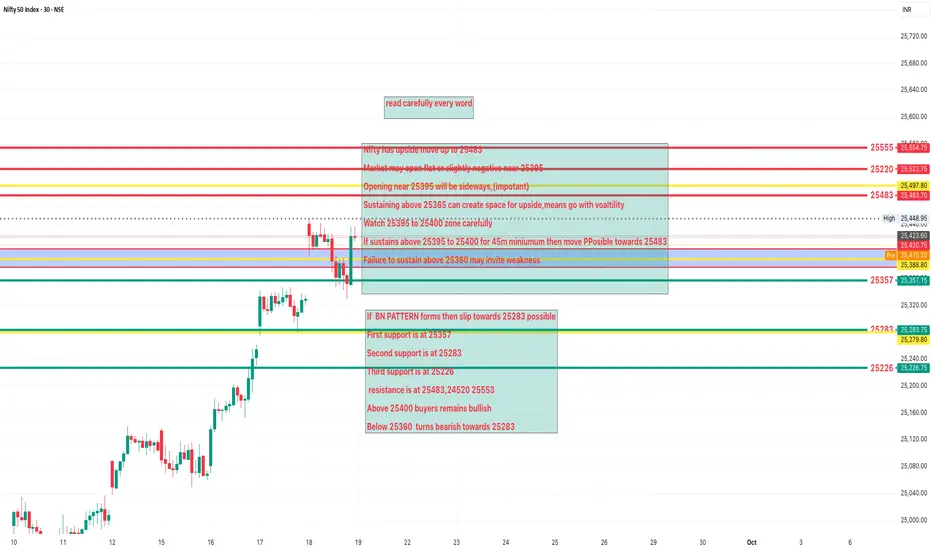
NIFTY Analysis 19 SEPTEMBER, 2025 ,Daily Morning update at 9 amTodays lavels based on 45 minut time frame of 1 month
Nifty has upside move show up to 25483
Market may open flat or slightly negative near 25395
Opening near 25395 will be sideways,(impotant)
Sustaining above 25365 can create space for upside,means go with voaltility
Watch 25395 to 25400 zone carefully
If sustains above 25395 to 25400 for 45m miniumum then move PPosible towards 25483
Failure to sustain above 25360 may invite weakness
If BN PATTERN forms then slip towards 25283 possible
First support is at 25357
Second support is at 25283
Third support is at 25226
resistance is at 25483,24520 25553
Above 25400 buyers remains bullish
Below 25360 turns bearish towards 25283
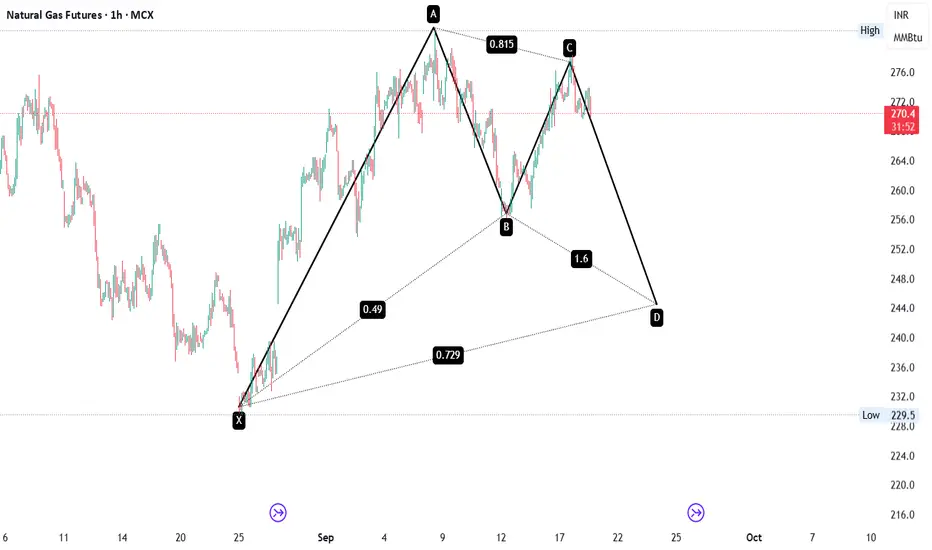
NATURAL GAS HARMONIC PATTERN
📈 Chart Pattern: Bearish Harmonic (Possibly Bearish Bat or Gartley Variant)
⚠️ Price Structure Breakdown:
A clean XABCD Harmonic Pattern is visible on the 1H timeframe:
🔹 XA Leg: Sharp impulsive rally from ₹229 → ₹281
🔹 AB Leg: Pullback retraced 49% of XA
🔹 BC Leg: Strong recovery to 81.5% of AB
🔹 CD Projection: 1.6x extension of BC, projecting a potential D point near ₹244–248 zone
📌 Key Technical Highlights:
✅ Pattern in play: Bearish harmonic indicating upcoming correction phase
🧲 D target zone aligns with previous demand cluster from late August
🔄 Ideal reversal zone between ₹244–248 (Watch for price-action confirmation near D)
🎯 Possible Trade Setup (Anticipated Post Completion at Point D):
📉 Sell NG Futures near ₹244–248 (on reversal confirmation)
🎯 Targets: ₹234 → ₹229
🛑 SL: Above ₹251 (on closing basis)
🧠 Why This Matters:
Harmonic patterns like this, especially with clean Fibonacci alignment, often mark high-probability reversal zones. Combined with volume + divergence filters, this zone could provide a lucrative swing trade setup.
BANKNIFTY FUTURE TRG 55584Banknifty Futures Bullish above 54385 for Trg 55584. Exit if closes below previous day low on trailing basis. Imp Date 15th Sept Mark H/L
Trgs are derived from Time & Angles.
Chk for updates.

Part 3 Institutional Trading Role of Options in Hedging
Options are commonly used to hedge portfolios against adverse market movements:
Protective Put for Stocks: Investors holding equities can buy puts to protect against downside risks.
Portfolio Insurance: Institutions use options to safeguard large portfolios against market crashes.
Income Generation: Covered call writing allows long-term holders to earn additional income while maintaining exposure.
Hedging with options is especially popular in volatile markets where risk management is critical.
Pricing Models and Market Mechanics
Professional traders often rely on option pricing models, like the Black-Scholes model, to determine fair premiums. These models factor in:
Current price of the underlying asset
Strike price
Time to expiration
Volatility
Risk-free interest rate
Options markets operate through exchanges with standardized contracts. Market makers provide liquidity, and the bid-ask spread reflects supply-demand dynamics. In OTC markets, options can be customized to suit specific investor requirements.
Advantages of Options Trading
Leverage: Control a larger position for smaller capital.
Flexibility: Strategies for bullish, bearish, or neutral markets.
Hedging: Effective risk management tool.
Profit in Any Market: Can profit in rising, falling, or sideways markets with the right strategy.
Defined Risk (for Buyers): Limited to premium paid.
Challenges and Considerations
Complexity: Options require understanding of multiple factors affecting pricing.
Time Sensitivity: Options lose value as expiration nears.
Volatility Risk: Price swings can be unpredictable.
Liquidity Issues: Not all options have sufficient trading volume.
Psychological Pressure: Rapid movements and leverage can lead to emotional decisions.

The Rise of Retail Traders and the Influence of Social MediaIntroduction
The landscape of financial markets has undergone a profound transformation in recent years, driven by the convergence of technological advancements and the democratization of information. Central to this evolution is the rise of retail traders—individual investors who engage in trading activities traditionally dominated by institutional players. This shift has been significantly influenced by the pervasive reach of social media platforms, which have become pivotal in shaping investment behaviors, disseminating financial information, and fostering online trading communities.
The Emergence of Retail Traders
Historically, access to financial markets was primarily the domain of institutional investors, hedge funds, and high-net-worth individuals. However, the advent of online trading platforms, coupled with the proliferation of mobile technology, has lowered the barriers to entry for individual investors. Platforms like Robinhood, Zerodha, and Upstox have democratized access to trading by offering commission-free trades, user-friendly interfaces, and educational resources. This accessibility has led to a surge in retail trading activity, with platforms reporting significant increases in user sign-ups and trading volumes.
For instance, Robinhood reported that nearly 40% of 25-year-olds used investment accounts in 2024, a sharp rise from 6% in 2015
Investopedia
. Similarly, in India, the number of retail investors has seen exponential growth, with millions participating in equity markets for the first time.
Social Media: The New Financial Frontier
Social media platforms have emerged as influential channels for financial discourse, information dissemination, and community building. Platforms such as Reddit, Twitter (now X), TikTok, and YouTube have become hubs where financial news, investment strategies, and market analyses are shared in real-time. The accessibility and immediacy of these platforms have empowered retail traders to make informed decisions, often in collaboration with like-minded individuals.
A notable example is Reddit's r/WallStreetBets community, where members engage in discussions about high-risk trading strategies, share investment insights, and collectively influence market movements. The GameStop short squeeze in early 2021 exemplified the power of social media in mobilizing retail traders to challenge institutional investors, leading to unprecedented volatility in the stock's price
TIME
.
The Role of Financial Influencers (Finfluencers)
The rise of social media has also given birth to a new class of financial content creators known as "finfluencers." These individuals leverage their online presence to share investment tips, market analyses, and trading strategies with their followers. While some finfluencers provide valuable insights, others may promote high-risk investments or products without adequate disclosures, raising concerns about the quality and reliability of financial advice available online
Financial Times
.
The influence of finfluencers is amplified by their ability to reach large audiences quickly and the trust that followers place in their recommendations. This dynamic has led to instances where retail traders, influenced by social media content, make investment decisions that may not align with traditional financial principles, potentially exposing them to increased risks.
Behavioral Implications and Market Dynamics
The integration of social media into trading practices has introduced new behavioral dynamics among retail traders. The constant flow of information, coupled with the desire for quick financial gains, can lead to impulsive decision-making and herd behavior. Retail traders may be swayed by trending stocks or viral content, often disregarding fundamental analyses.
Studies have shown that social media discussions can significantly influence investor sentiment and trading volumes. For example, the volume of comments and discussions on platforms like Reddit has been correlated with subsequent stock price movements, indicating that collective online sentiment can impact market dynamics
arXiv
.
Moreover, the phenomenon of "upward social comparison"—where individuals compare their financial achievements with those of others—can lead to increased risk-taking and trading activity. Investors exposed to peers' successes may feel compelled to emulate similar strategies, sometimes without fully understanding the associated risks
Nature
.
Regulatory Challenges and Misinformation
The rapid growth of retail trading and the pervasive influence of social media have posed significant challenges for regulators. The decentralized nature of information dissemination on social platforms makes it difficult to monitor and control the spread of misinformation, fraudulent schemes, and manipulative practices.
Regulatory bodies in various countries have begun to address these challenges by implementing measures to enhance transparency and protect investors. For instance, the UK's Financial Conduct Authority has introduced regulations under the Financial Promotions Regime to combat misleading financial content and has prosecuted violators
Financial Times
.
In India, the Securities and Exchange Board of India (SEBI) has issued advisories cautioning investors about the risks associated with financial influencers and the potential for deepfake videos to mislead investors
Reuters
. These efforts highlight the need for a balanced approach that fosters innovation while safeguarding investor interests.
The Future of Retail Trading and Social Media
Looking ahead, the intersection of retail trading and social media is poised to continue evolving. Advancements in artificial intelligence, machine learning, and data analytics are expected to further personalize trading experiences, offering tailored recommendations and predictive insights to individual investors.
Simultaneously, the role of social media in shaping market trends will likely intensify, with platforms developing more sophisticated tools to facilitate trading and investment discussions. The integration of social features into trading platforms, such as Robinhood's "Robinhood Social," exemplifies this trend by allowing users to follow and emulate successful traders in real-time
Investopedia
.
However, as the influence of social media grows, so too does the responsibility of platforms, influencers, and regulators to ensure that retail traders have access to accurate, reliable, and ethical financial information. The future of retail trading will depend on striking a balance between innovation, education, and regulation to create a sustainable and equitable financial ecosystem.
Conclusion
The rise of retail traders, fueled by the pervasive influence of social media, has transformed the financial landscape, democratizing access to trading and investment opportunities. While this shift has empowered individual investors, it has also introduced new challenges related to information reliability, behavioral biases, and regulatory oversight.
As the financial ecosystem continues to evolve, it is imperative for stakeholders—including investors, influencers, platforms, and regulators—to collaborate in fostering an environment that promotes informed decision-making, ethical practices, and financial literacy. By doing so, the potential of retail traders can be harnessed to contribute positively to the broader financial markets, ensuring that the benefits of this transformation are realized in a responsible and sustainable manner.

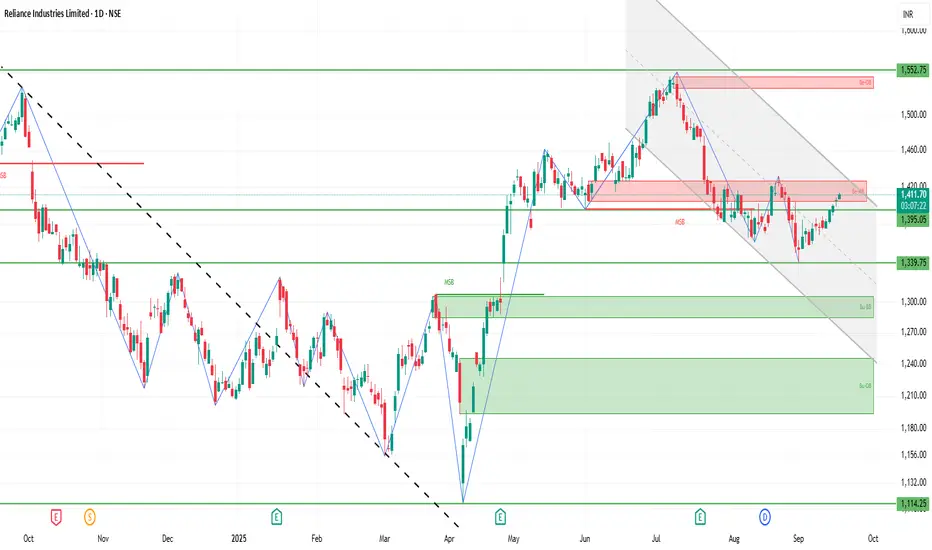
RELIANCE 1D Time frameCurrent Stock Price
Current Price: ₹1,411.60
Day’s Range: ₹1,406.90 – ₹1,412.50
52-Week Range: ₹1,114.85 – ₹1,551.00
Market Cap: ₹19.09 lakh crore
P/E Ratio: 23.43 (lower than sector average)
Dividend Yield: 0.39%
Book Value: ₹605.55
TTM EPS: ₹60.23 (+18.56% YoY)
📈 Trend & Outlook
Short-Term Trend: Mildly bullish; the stock has risen for five consecutive sessions.
Resistance Levels: ₹1,412.50 (day’s high), ₹1,551.00 (52-week high).
Support Levels: ₹1,406.90 (day’s low), ₹1,375.00 (recent low).
Investor Sentiment: Positive, with expectations around upcoming IPOs for Jio and Retail in 2026 and 2027, respectively.
🧭 Analyst Insights
Citi Group has a target price of ₹2,020, citing improved sentiment post-SEBI’s new listing norms for Jio and Retail.
Quant Mutual Fund increased its stake in Reliance Industries in August, indicating institutional confidence.
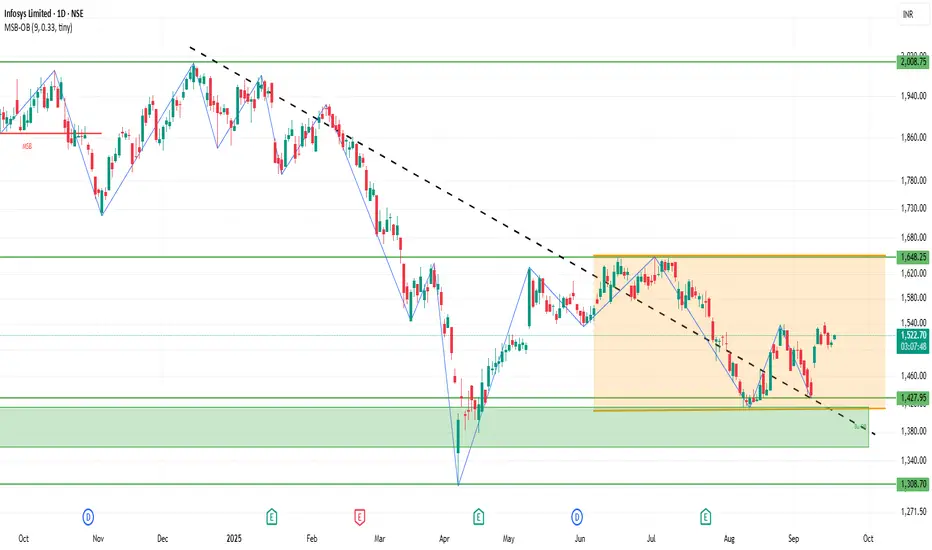
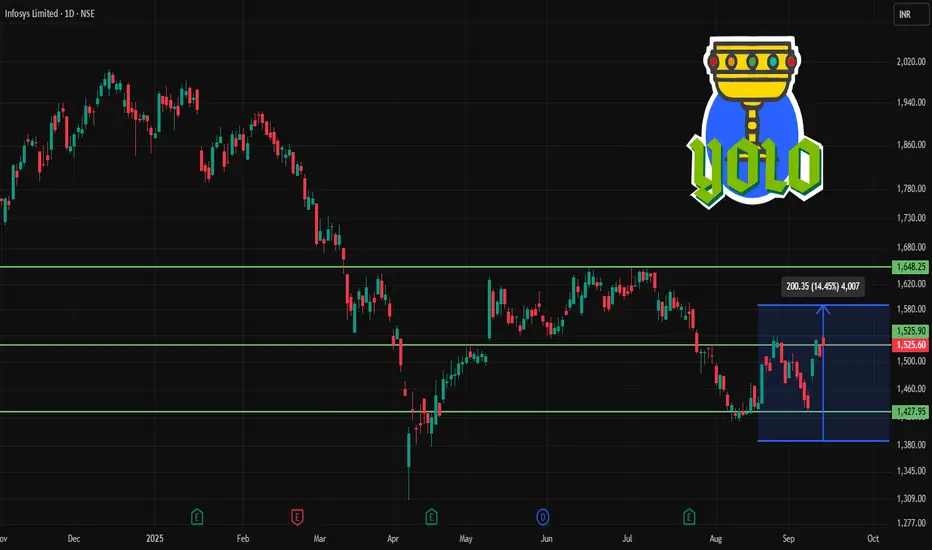
INFY 1D Time frameCurrent Stock Price
Current Price: ₹1,525.60
Day’s Range: ₹1,521.10 – ₹1,542.90
52-Week Range: ₹1,307.00 – ₹2,006.45
Market Cap: ₹6.33 lakh crore
P/E Ratio (TTM): 23.0
EPS (TTM): ₹65.63
Dividend Yield: 2.82%
Book Value: ₹230.65
📈 Trend & Outlook
Short-Term Trend: Bullish; the stock is trading near its 52-week high, indicating strong investor confidence.
Resistance Levels: ₹1,542.90 (day’s high), ₹2,006.45 (52-week high).
Support Levels: ₹1,521.10 (day’s low), ₹1,500.00 (psychological support).
Investor Sentiment: Positive, with strong institutional interest and favorable analyst outlooks.
🧭 Analyst Insights
Valuation: The stock is trading at a P/E ratio of 23.0, which is below the sector average of 28.56, suggesting potential value.
Growth Prospects: The company’s strong earnings growth and robust capital position support its premium valuation.
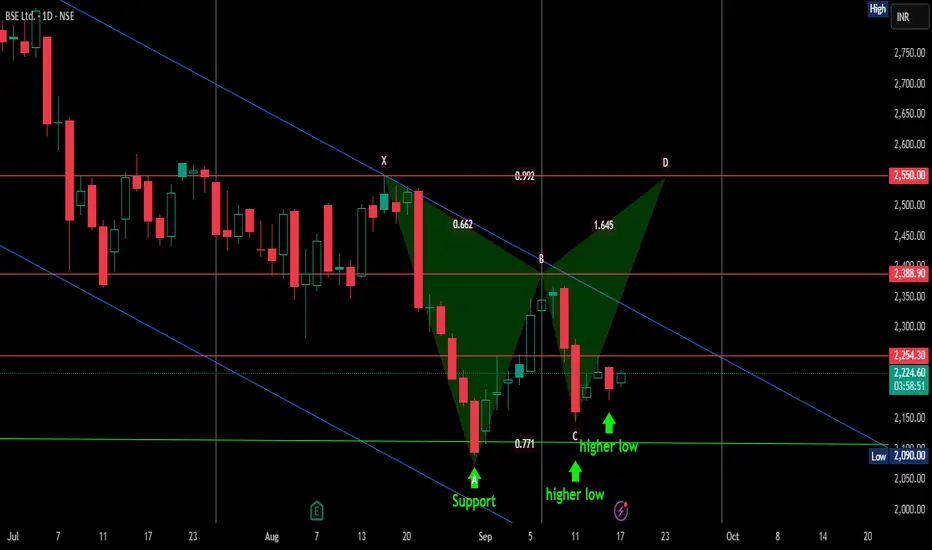
BSE PREPARING TO FORM BAT PATTERNHere i would like to mention that BSE is gradually coming down in declining channel marked in blue color line. if you see now there is a formation of higher high and higher low and as per gann theory three days low BSE is not trying to break it's 3 days low.
so i am expecting that if it will break previous high which is marked in RED as resistance,whenever it ge break then might be break declining channel as well and will follow BAT PATTERN.
THIS IS JUST AN INFORMATION AND LEARNING TO ANALYSE NOT BYUY/SELL CALL.
SOLARINDSSOLARINDS
bullish trend is Showing on the chart.
buy signals in
technical indicators and
double bottom chart pattern.
Watch for a breakout above 14500/14600 to sustain the bullish trend. If the resistance holds, there could be a retest towards 13500/13600 and an uptrend from here.

NIFTY TRG 25236/250Nifty Trgs on Chart . Expecting this rally to extend to 25236/250. Expecting 25102 atleast , book part profits there then trail SL.
Important dates 9th & 15th Sept High / Low will be imp.
Trail & Exit if Nifty closes below previous day low on daily closing basis.
Levels and Targets are derived from Time & Angles .
Check for updates.

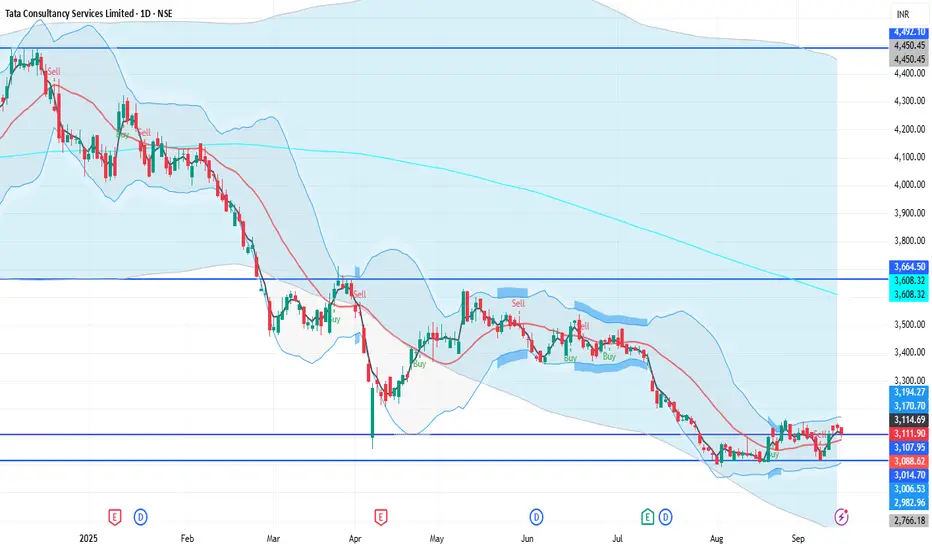
TCS 1D Time framePrice Action
Current Price: ₹3,111.60
Previous Close: ₹3,124.20
Day’s Range: ₹3,096 – ₹3,134
52-Week Range: ₹2,991.60 – ₹4,546.05
🔹 Support & Resistance
Support 1: ₹3,096
Support 2: ₹3,050 – ₹3,060
Resistance 1: ₹3,134
Resistance 2: ₹3,150 – ₹3,160
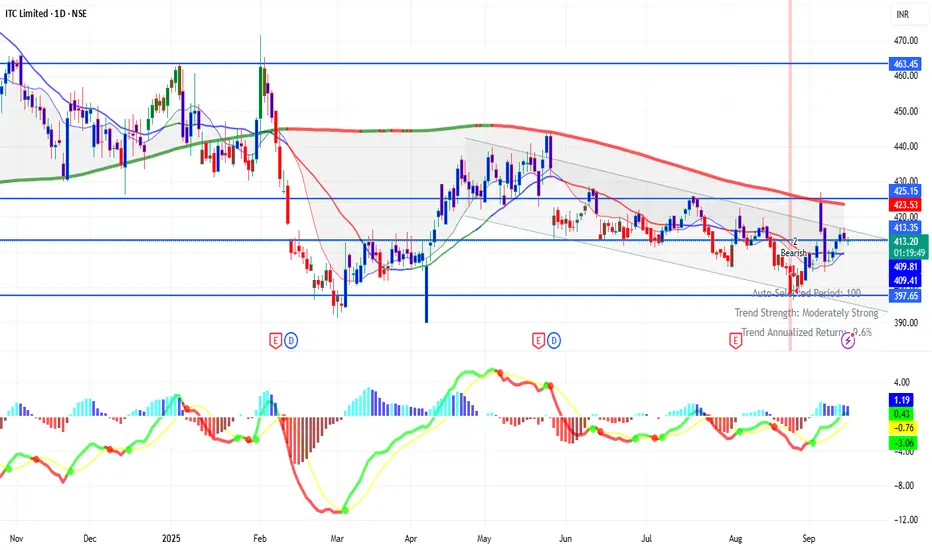
ITC 1D Time framePrice Action
Current Price: ₹413.75 (approx)
Day’s Range: ₹413.05 – ₹414.30
52-Week Range: ₹390.15 – ₹528.50
🔹 Support & Resistance
Immediate Support: ₹410 – ₹408
Next Support: ₹402 – ₹397
Immediate Resistance: ₹416 – ₹420
Next Resistance: ₹422 – ₹428
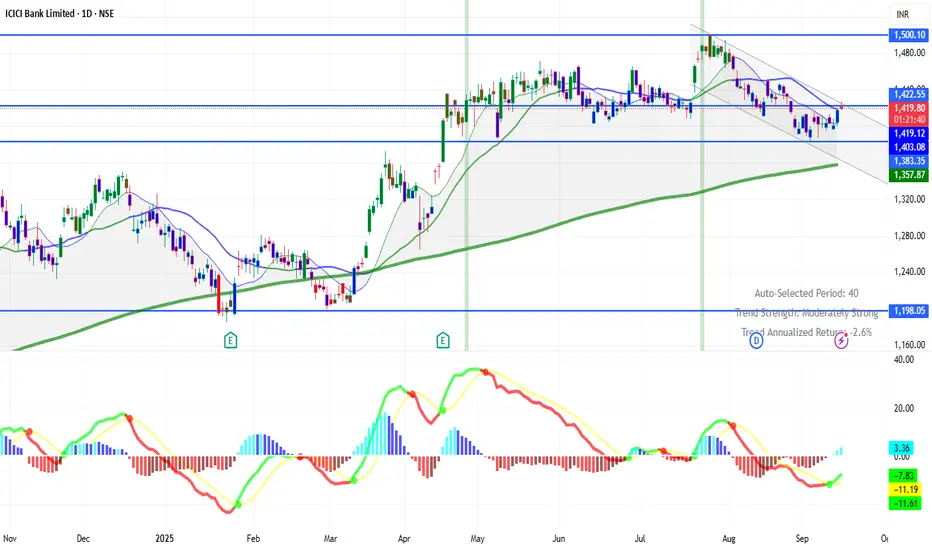
ICICIBANK 1D Time frameCurrent Price: ₹1,422 (approx)
Previous Close: ₹1,417.70
52-Week Range: ₹1,186 – ₹1,500
🔹 Support & Resistance (Daily)
Immediate Support: ₹1,390 – ₹1,392
Next Support: ₹1,360 – ₹1,365
Immediate Resistance: ₹1,407 – ₹1,415
Next Resistance: ₹1,416+
ASIANPAINT 1D Time frameToday's Trading Range:
Day's Range: ₹2,498.00 – ₹2,543.50
Opening Price: ₹2,535.10
Previous Close: ₹2,540.50
52-Week Range: ₹2,124.75 – ₹3,394.90
📈 Circuit Limits:
Upper Circuit Limit: ₹2,800.90
Lower Circuit Limit: ₹2,291.70
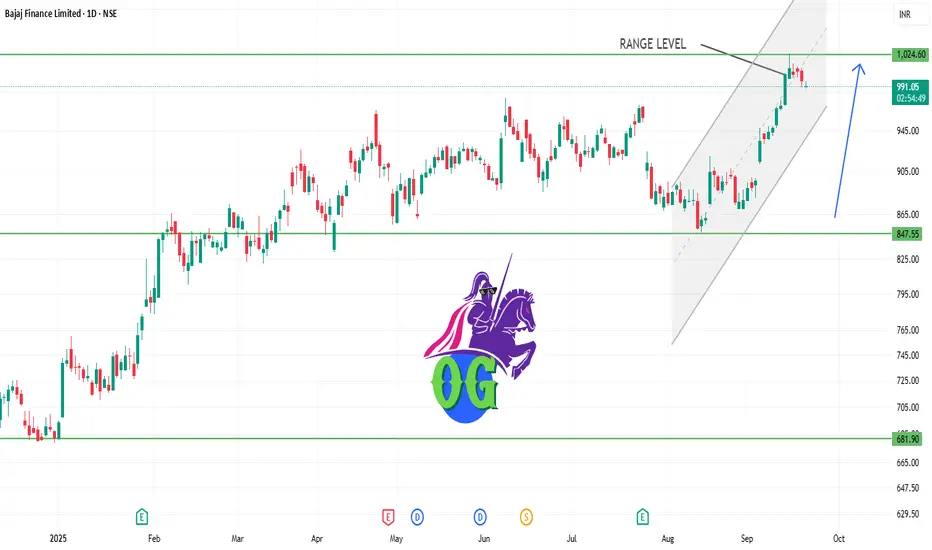
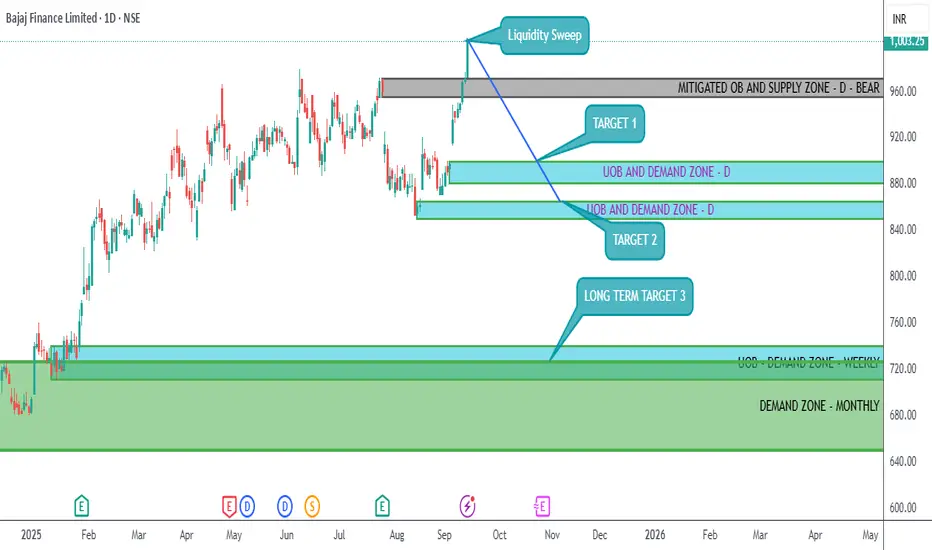
BAJFINANCE - BEARISH PREDICTIONAs BAJFINANCE is rising as of now above a 1000 mark, this is barely a liquidity sweep taking place and big institutions entering into sell on a larger scale. After this liquidity sweep is over, BAJFINANCE will start declining and a major decline is anticipated.
BAJFINANCE has several order blocks pending at weekly and monthly levels to be mitigated.
A short position is BAJFINANCE futures (maybe Nov) can be initiated on 15-Sep-2025 with a stop loss a little over closing of 12-Sep-2025 high.
TARGETS ARE GIVEN IN THE CHART.
📉 THIS CHANNEL IS ONLY FOR EDUCATIONAL PURPOSES.
Disclaimer: I am Not a SEBI registered analyst. I just share my positions to do paper trading and no where its a recommendation! Please do your own analysis before taking any trade.
INFY 1D Time frameCurrent Price & Trend
Current Level: ~₹1,525
Trend: Neutral to bullish → stock is slowly recovering from recent lows.
Momentum: Buying support is visible near ₹1,500 zone.
Indicators
RSI: Around 59 → healthy, not yet overbought.
MACD: Positive crossover → signals upward momentum.
Moving Averages: Price is above short-term averages, but medium-term trend is still consolidating.
Bullish Scenario
If INFY sustains above 1,540, it can move toward 1,560 – 1,600.
A breakout above 1,600 could trigger further rally toward 1,650.
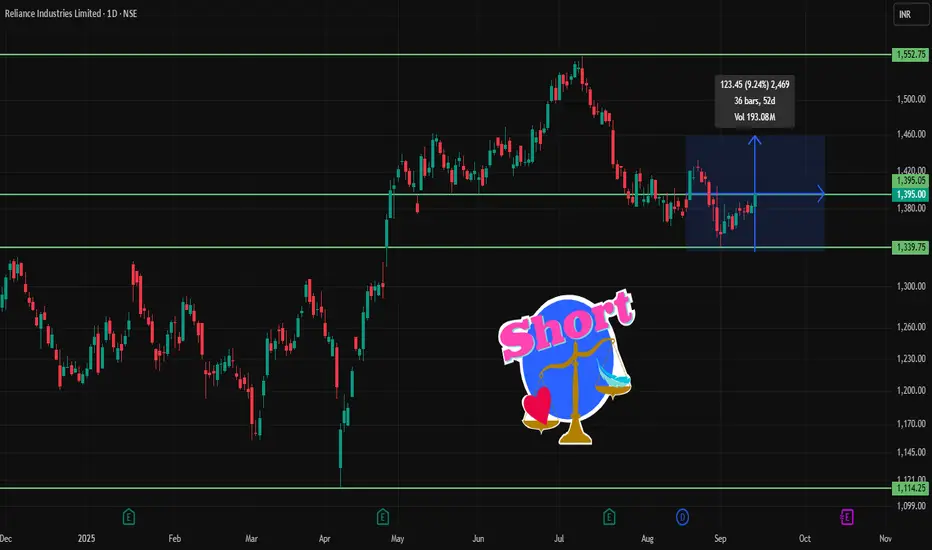
RELIANCE 1D Time frameCurrent Price & Trend
Trading around ₹1,395
Price is below many of its short- to medium-term moving averages (50-day, 100-day), suggesting resistance in that zone.
Indicators & Momentum
Relative Strength Index (RSI) is in mid-range → neither overbought nor oversold, leaning neutral.
MACD is weak to mildly bearish in daily view.
Volume has shown mixed behaviour; resistance zones are not being convincingly broken.
Trend strength indicators show some weakening or caution among buyers.