USDCHF – M15 | Sell-Side Purge → Mitigation Rally → ContinuationPrice completed a textbook sell-side liquidity sweep, flushing weak longs below the range. The impulsive push down was real displacement. What followed is a forced bounce, driven by short covering and mitigation, not fresh demand.
Current price is retracing into a discounted supply / imbalance zone, where previous bearish orderflow originated. Structure remains bearish unless proven otherwise.
Market Narrative
Range highs → distribution
Sharp sell-side run = intent revealed
Bounce = mitigation into prior inefficiency
Execution Bias
Shorts favored into the marked retracement zone
Ideal entries on signs of rejection / bearish shift
Invalidation only on clean M15 acceptance above the green level
Targets
Recent sell-side lows
External liquidity below the range
Deeper discount expansion if momentum accelerates
Gartley

PIIND Investment Idea: Harmonic Bullish Gartley Pattern💯 Bullish Gartley Pattern in Technical Analysis
✍🏼The Bullish Gartley pattern is a harmonic trading formation rooted in Fibonacci ratios, designed to identify potential reversal points in a downtrend, signaling the start of a bullish move. Discovered by H.M. Gartley in 1935, it's part of a family of harmonic patterns (including Bat, Butterfly, and Crab) and visually resembles an 'M' shape on the chart. This pattern is popular in forex, equities, and indices like Nifty 50, where it helps traders spot high-probability entries during corrective phases. It assumes markets move in geometric proportions, blending geometry with Fibonacci sequences for precision.
________________^^^^^^^^^^^^^^^^_________________
Key Components of the Pattern
The Bullish Gartley consists of five swing points labeled X, A, B, C, and D, forming through specific Fibonacci retracements and extensions:
• XA Leg: The initial impulsive move downward from point X (high) to A (low), setting the pattern's foundation.
• AB Leg: A retracement upward from A to B, typically 61.8% o f XA.
• BC Leg: A pullback downward from B to C, ranging from 38.2% to 88.6% of AB.
• CD Leg: The final extension upward from C to D, often 127.2% to 161.8% of BC, with D landing at approximately 78.6% retracement of XA.
• Potential Reversal Zone (PRZ): Convergence at D, where multiple Fib levels align for a buy signal.
👉🏼 The pattern completes when price reaches D and shows reversal signs, such as bullish candlesticks or volume increase. Here's an example chart illustrating the structure:
________________^^^^^^^^^^^^^^^^_________________
✍🏼Pattern Analysis
• Reliability: Studies show success rates of 60-80% when strict Fib ratios are met and confirmed by volume or oscillators like RSI (showing oversold at D) or MACD divergence. It's more effective in trending markets with low noise; false signals occur in choppy conditions or if ratios deviate (e.g., beyond 1-2% tolerance).
• Timeframe: Best on H4, daily, or weekly charts for positional trades; intraday (e.g., 15-min) versions are riskier due to whipsaws.
• Variations:
o Ideal ratios are precise, but real markets allow slight flexibility.
o Bullish vs. Bearish: The bearish Gartley is inverted ('W' shape) for topping patterns.
• Confirmation: Requires a breakout above the B-C high or a close above the 38.2% retracement of CD; without it, the pattern may fail and extend into other harmonics like Bat (88.6% XD).
________________^^^^^^^^^^^^^^^^_________________
🎯Implications for Trading
• Bullish Setup: Enter long positions at D with a stop-loss below X (or 1-2% below D). Targets include 38.2% and 61.8% retracements of AD, or back to point A.
• Risk-Reward: Often 1:2 or better; e.g., if XA is 100 points, risk 10-20 points for 50-100 point gains.
• In Indian Markets: For Nifty 50 (currently around 25,700 in Jan 2026), scan for Bullish Gartley near supports like 25,500 after corrections from FII selling. Combine with options (e.g., buy calls at D) for leverage.
• Risks: Over-reliance on Fibs without volume confirmation; always use in conjunction with trend analysis or fundamentals like earnings catalysts.
This pattern emphasizes discipline in waiting for completion, making it a staple for harmonic traders seeking edge in volatile environments.
⚠️ DISCLAIMER:
The information, views, and ideas shared here are purely for educational and informational purposes only. They are not intended as investment advice or a recommendation to buy, sell, or hold any financial instruments. I am not a SEBI-registered financial adviser.
Trading and investing in the stock market involves risk, and you should do your own research and analysis. You are solely responsible for any decisions made based on this research.
"As HARD EARNED MONEY IS YOUR's, So DECISION SHOULD HAVE TO BE YOUR's".
━━━━━━━━━━━━━━━━━━━━━━━━━━━━━━━━━
❇️ Follow notification about periodical View
💥 Do Comment for Stock WEEKLY Level Analysis.🚀
📊 Do you agree with this view?
✈️ HIT THE PLANE ICON if this technical observation resonates with you. It will Motivate me.

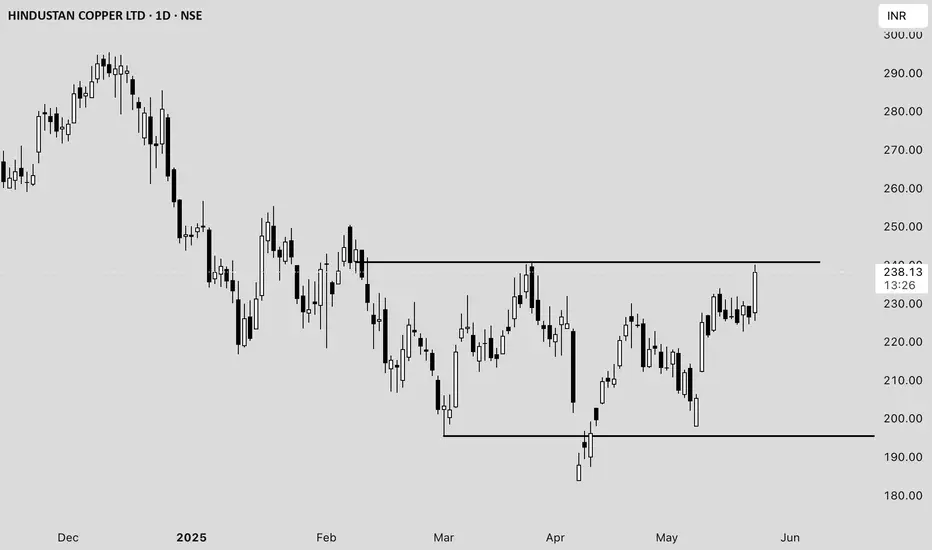
Hindustan Copper Ltd. (HINDCOPPER) Price Analysis **Date:*#### **Current Price and Intraday Movement**
- **Latest Price:** ₹237.98 (+5.09% / +₹11.52)
- **Day’s Range:** ₹225.50 – ₹240.10
- **Open:** ₹227.60
- **Previous Close:** ₹226.46
- **Volume:** 1.63 crore shares (well above average daily volume of 55.89 lakh)
#### **Technical Overview**
- **52-Week Range:** ₹183.82 – ₹381.90
- **50-Day Average:** ₹216.99
- **200-Day Average:** ₹260.58
- **Market Cap:** ₹23,013 crore
- **P/E Ratio:** 57.48
- **EPS:** ₹4.14
#### **Recent Performance and Trends**
- **Short-Term Trend:** The stock surged over 5% today, outperforming its sector and showing strong buying interest .
- **Volume Spike:** Today’s volume is nearly triple the average, indicating heightened trader participation .
- **Technical Position:** The stock is trading above its 50-day moving average but remains below the 200-day average, suggesting a recovery from recent lows but still under medium-term resistance .
- **Support/Resistance:** Immediate resistance is near ₹240–₹249 (upper circuit), with support at ₹225 and ₹216 (50-DMA) .
#### **Fundamental Snapshot**
- **Valuation:** High P/E ratio (57.48) signals expensive valuation relative to earnings .
- **Profitability:** EPS at ₹4.14; profit margins have been under pressure.
- **Industry Position:** Hindustan Copper is India’s primary copper producer, with exposure to global copper price trends and domestic infrastructure demand.
#### **Outlook**
- **Short-Term:** Strong momentum and volume could drive further upside if it breaks above ₹240, but overbought conditions may trigger profit booking near resistance.
- **Medium-Term:** Needs to sustain above the 200-DMA (~₹260) for a confirmed trend reversal.
- **Risks:** High valuation and recent volatility; global commodity price swings can impact earnings.
---
**Summary:**
Hindustan Copper is showing robust short-term momentum with strong volume and price gains, but faces resistance near ₹240–₹249. The stock remains fundamentally expensive, and investors should watch for sustained moves above the 200-DMA for a longer-term bullish signal .
XAUUSD | 15M | SMC PerspectivePrice has delivered a strong bearish displacement, confirming short-term market structure shift to the downside. The recent impulse left behind a clean bearish order block / supply zone, which is now acting as premium territory.
Current price is reacting from discount and may attempt a pullback into the marked supply zone for mitigation. That zone is the key decision area.
Plan:
Expect a retracement into supply
Look for LTF confirmation only inside the zone
Rejection from supply should open the path toward the liquidity pool near 4257, which aligns with prior lows and equal lows resting liquidity
Bias: Bearish
Execution rule: Entry will be taken only if LTF aligns with HTF bearish expectation

MUTHOOTFIN Price ActionTrend - Bullish
Strength - Strong
Set up - Breakout
- Very small consolidation and price breaking out faster as trend is stronger

GBP/USD – Short Setup Trade Narrative
Price created a lower-high structure after the earlier push up, followed by a sharp sell-off that broke intraday momentum.
A small liquidity grab beneath the prior low caused a corrective pullback into a premium zone, aligning perfectly with the bearish bias.
The current candle shows rejection inside the supply block / retracement zone, giving a clean short entry.
Confluence
Structural lower-high formation
Liquidity sweep before entry
FVG fill during retracement
Higher-timeframe bearish context
Clear risk-to-reward framework

INDIANB Price ActionAs of July 24, 2025, Indian Bank (INDIANB) is trading around ₹639, showing strong momentum after recovering from recent declines. The stock is close to its 52-week high of approximately ₹658, indicating a robust upward trend in the public sector banking space.
The bank has demonstrated consistent financial growth, with a 14% year-on-year increase in both deposits and advances, currently standing above ₹63,000 crore and ₹53,000 crore respectively. Total business volume grew to over ₹1.16 lakh crore. Net profit for the last financial year increased by 11% to around ₹1,124 crore.
Asset quality has improved, with gross non-performing assets (NPA) reducing to 3.09% and net NPA to 1.25%. The provision coverage ratio is strong at 78%, reflecting prudent risk management. Net interest margin (NIM) is stable at approximately 3.6%, supporting healthy core profitability. The cost-to-income ratio is near 48%, indicating moderate operational efficiency.
Return on assets (ROA) and return on equity (ROE) stand around 1.55% and 12.6% respectively, highlighting solid returns relative to asset base and shareholder equity. Capital adequacy ratios remain comfortable under Basel III norms.
Technically, Indian Bank’s stock is trading above major moving averages (5, 20, 50, 100, 200 days), confirming positive price momentum. Year-to-date, the stock has delivered over 21% returns, outperforming many peers in the public sector banking segment.
Overall, Indian Bank presents a strong growth and stability profile with improving asset quality, stable margins, and expanding business volumes, making it an attractive candidate in the public banking sector for medium to long-term investors.

Dalmia Bharat LtdAs per Harmonic Alt Gartley pattern
Information provided is for informational purposes only and should not be construed as investment advice or an offer to buy or sell securities. Investors are advised to carefully review all materials and consult with a financial advisor considering their own financial situation and risk tolerance before making investment decisions. The disclaimer also often includes statements about no guarantees or warranties regarding the accuracy, adequacy, or completeness of the information provided and emphasizes that investments can fluctuate in value and there is a risk of loss

CARTRADE Price ActionTIme to pyramid
CarTrade Tech Limited’s stock has delivered a strong performance as of late August 2025, trading close to ₹824 after rallying more than 40% in the past three months and reaching a new 52-week high. The surge is largely attributed to robust quarterly results, improved profit margins, and expanding digital business operations, which have helped regain investor confidence.
CarTrade’s financials show healthy revenue growth, continuing profitability improvements, and solid cash reserves that allow for continued investment into technology and product innovation. The company operates with minimal debt, maintaining operational flexibility and a stable cost structure. Its price-to-earnings ratio, while now elevated, actively reflects anticipated future growth rather than merely past performance.
Technically, CarTrade is trading above major moving averages, signaling ongoing bullish momentum, and there’s evidence of heightened institutional interest. While the trend is positive, the stock may see intermittent profit-taking and short-term volatility before stabilizing at higher levels. Overall, CarTrade presents a strong growth profile backed by sound financial fundamentals, with momentum favoring further gains if execution remains solid.

TFCILTD Price Action## TFCILTD – Price Analysis (August 2025)
### Price & Market Metrics
- **Current share price:** ₹297.75 (as of August 13, 2025; latest close).
- **Market capitalization:** Approx. ₹2,757crore.
- **52-week range:** ₹122.32 (low) – ₹303.50 (high); new high reached in early August.
- **All-time low:** ₹4.45 (Sep 2001).
- **All-time high:** ₹303.50 (July–August 2025).
- **Day’s range (Aug 13):** ₹282.60–₹303.50.
- **Volume:** 3,955,421 shares traded on Aug 13.
- **Beta:** 1.24, showing moderate volatility.
### Returns & Volatility
- 1-week gain: Around 8.25%.
- 1-month gain: Approximately 4%.
- 1-year return: Roughly 67%.
- Daily moves of 5-6%; volatility is moderate to high recently.
### Valuation
- **Price/Earnings (P/E) ratio:** 31.10–31.47 (much higher than sector average of ~11.4).
- **Price/Book (P/B) ratio:** 2.69–3.14.
- **Book Value Per Share:** ₹94.80–₹110.54.
- **Dividend yield:** About 1.01%; ex-dividend date August 14, 2025.
- **EPS (TTM):** ₹9.46–11.77.
- **Intrinsic value estimate (GF Value):** ₹152.95—current price trades at a 95% premium over this fair value estimate.
### Financial & Business Highlights
- Revenue (TTM): ₹1.58billion.
- Net profit (TTM): ₹1.09billion.
- Net profit margin: Approximately 69%.
- Debt/Equity Ratio: ~70.9% (moderate leverage).
- Gross margin: 99% (financial lending business).
### Technical & Sentiment Overview
- Stock made a new all-time high in early August.
- Trend is bullish, supported by heavy volumes.
- Dividend payout scheduled for September 20, 2025.
- Overall business cited as "average growth, high valuation" in recent analysis.
***
## Summary
TFCILTD is trading near record highs at ₹297.75, well above its estimated fair value and sector norms. The stock’s valuation metrics—particularly its P/E and P/B ratios—are elevated, reflecting strong price momentum and investor enthusiasm. Financial performance shows very high profit margins and reasonable growth, but the premium to intrinsic value signals potential overvaluation risks. Volatility and recent price swings are moderately high. Investors should weigh current optimism and momentum against valuation concerns and sector returns.

Bank Nifty Bank Nifty just formed as Alt Gartley pattern as shown
Disclaimer
Information provided is for informational purposes only and should not be construed as investment advice or an offer to buy or sell securities. Investors are advised to carefully review all materials and consult with a financial advisor considering their own financial situation and risk tolerance before making investment decisions. The disclaimer also often includes statements about no guarantees or warranties regarding the accuracy, adequacy, or completeness of the information provided and emphasizes that investments can fluctuate in value and there is a risk of loss.

Fortis Healthcare’s share price analysisFortis Healthcare’s share price is currently around ₹667, reflecting strong momentum and significant outperformance over the past year, with a return of about 49%. The stock recently touched a 52-week high of ₹744.5 and a low of ₹406, indicating a broad trading range and robust investor interest
Analyst sentiment remains bullish, with most forecasts targeting a price range of ₹736 to ₹850 over the next 12 months, suggesting a potential upside of around 10–20% from current levels . Some projections are even more optimistic, with year-end 2025 targets as high as ₹933 if market conditions remain favorable . Technical indicators currently point to a bullish trend, supporting the positive outlook .
Fundamentally, Fortis Healthcare has reported strong financial results, including an 84% year-on-year jump in net profit for Q3 FY2024-25 and a 40% quarterly profit increase, underscoring operational momentum . The company trades at a price-to-earnings (PE) ratio of about 65, which is above the sector average, indicating that the stock is priced at a premium due to its growth prospects . The price-to-book (PB) ratio is 3.49, and the dividend yield is modest at 0.24% .
In summary, Fortis Healthcare is in a bullish phase, supported by strong earnings growth and positive analyst outlooks. While the stock is trading at a premium valuation, its growth trajectory and sector leadership continue to attract investor interest, with further upside likely if current trends persist

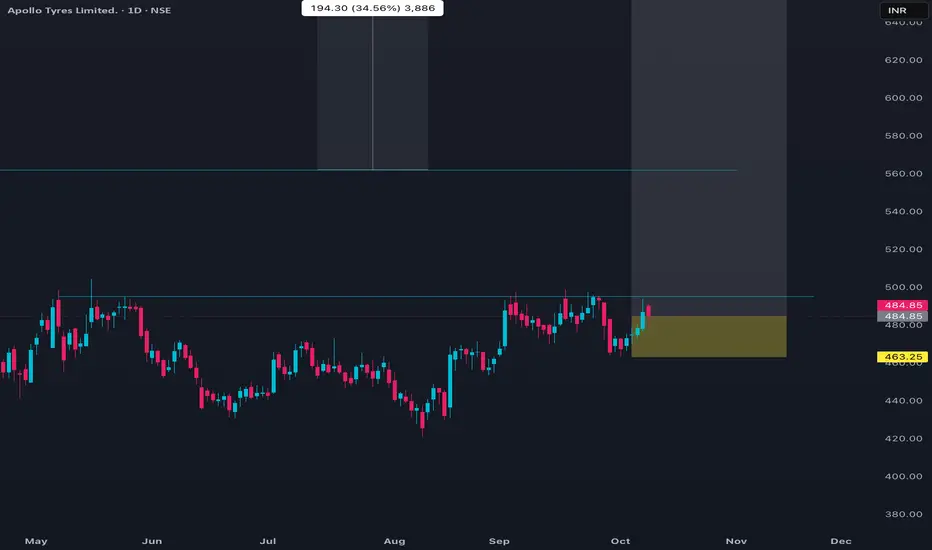
APOLLOTYRE Price ActionApollo Tyres is currently trading in the range of 479 to 492. The last recorded price was about 487, following a recent day’s high of 491.5 and a low of 479.65. The volume on the last trading day exceeded 5.8 lakh shares, with an average delivery percentage around 50%. The stock is experiencing mild upward price momentum on short-term technicals, with several recent bullish EMA crossovers on daily charts.
Financially, the market capitalisation is about ₹30,800 crore. The trailing P/E ratio stands high over 36, while the P/B is just above 2. The EPS has seen a notable YoY decline. Over the last month, price movement has been flat to slightly positive, while medium-term (six months) shows a rise of more than 20%. Returns over the past year remain negative. The 52-week high is 557, and the low is 371.
Analyst consensus is positive with several recent buy ratings and a target clustered around the ₹590 level. The overall trend is positive in the short term, supported by technical indicators, while valuation remains elevated.
Cupid Price ActionCupid Limited’s stock is trading around ₹158 as of early August 2025, having recently hit new record highs above ₹162. The share price surged over 45% in the past month and is up more than 100% year-to-date, significantly outperforming both its FMCG peers and the broader market. Volatility is high: daily moves of 5–6% are common, and intraday swings have reached as much as 8%. The stock is trading well above all major moving averages, reflecting strong buying momentum.
Long-term performance is outstanding: over 1,300% returns in three years and more than 2,100% across ten years. That said, short-term technical signals show that Cupid is “overbought” (very high RSI) and potentially due for a corrective pullback, though robust momentum could drive further gains. The high PE ratio near 104 and price/book around 21 indicate a rich valuation versus historic averages and sector norms.
Market capitalization is about ₹4,240 crore. Despite being expensive on most valuation models, the company is seen as fundamentally strong: steady operational performance, minimal debt, and no significant pledged shares. The company’s next earnings announcement is due August 8, and recent market behavior suggests results can drive significant further volatility.
Compared to other FMCG names, Cupid’s returns are exceptionally strong while most large and mid-cap sector players (like HUL, Dabur, and Colgate) have posted declines over the past year. Liquidity has increased with heavy volume spikes during rallies, supporting the uptrend.
In summary, Cupid is a high-momentum, high-volatility small-cap outperformer exhibiting extraordinary multi-year returns. The stock trades at elevated valuations and, while short-term corrections may occur, its leadership in the sector and technical strength continue to attract aggressive buyers.

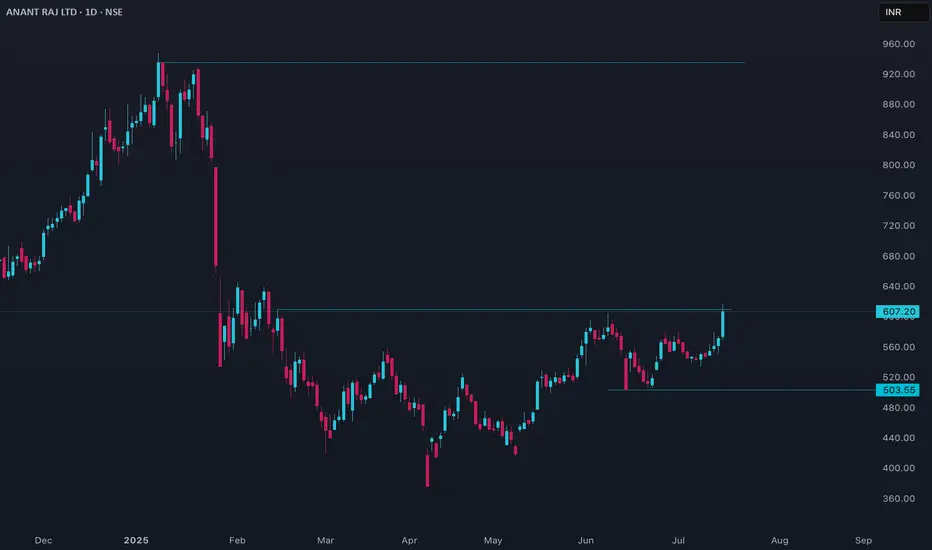
ANANTRAJ Price Action
## Current Price & Performance
- Last close was ₹607.20.
- Over the past week, the stock is up more than 10%, showing strong short-term momentum.
- Over the past year, it has gained nearly 25%, but suffered a sharp 32% drawdown over six months.
- The 52-week price ranged from ₹376.15 to ₹947.90, reflecting high volatility.
## Valuation and Metrics
- ANANTRAJ trades at a high valuation, with price-to-earnings and price-to-book ratios above typical industry averages.
- Its market capitalization puts it among the stronger players in the real estate sector.
- Key valuation multiples such as PE and EV/EBITDA are elevated, indicating investors are paying a premium for expected growth.
- The stock’s PEG ratio suggests its growth is reasonably in line with its price.
## Analyst Sentiment and Targets
- Most analysts rate the stock as a strong buy, highlighting strong upside potential with target prices higher than the current market price.
- The consensus one-year price targets suggest potential returns ranging between 24% and 49% from current levels.
## Technical & Fundamental Observations
- Compared to sector peers, its PE is lower than certain high-flyers but remains above the overall industry average, making it expensive by historical standards.
- Return on equity has hovered around 8.5% recently, with efficient operating and employee costs supporting margins.
- A modest dividend has recently been declared.
- A slight increase in promoter holding indicates management confidence.
## Risk Factors
- Substantial volatility in recent months may raise concerns for risk-averse investors.
- Both intrinsic value models and relative measures suggest the shares may be overvalued by over 20% at current prices.
- While momentum and sentiment are positive, valuation risk remains a key factor for new investors.
## Conclusion
ANANTRAJ is benefiting from strong momentum and positive sentiment, with analysts forecasting further upside. However, current valuation levels are high, and investors should carefully weigh the potential for price appreciation against the risk of overvaluation and ongoing volatility. Consider both the fundamental strengths and the elevated price multiples before making an investment decision.
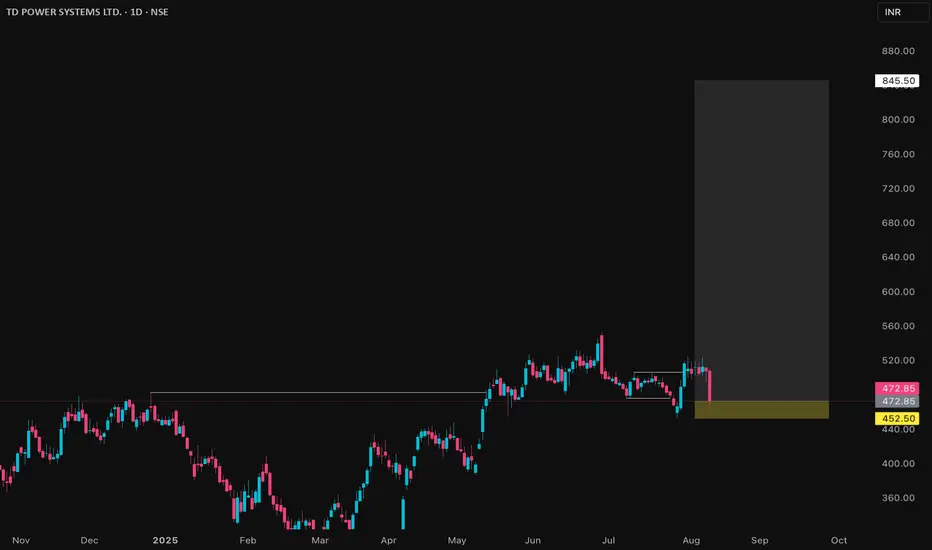
TDPOWERSYS Price Action## TDPOWERSYS Price Details (as of August 8, 2025)
### Market Metrics
- Current share price is ₹472.85.
- Market capitalization is ₹7,385crore.
- The 52-week price range is ₹293 to ₹552.75.
- Its all-time low was ₹14 in March 2020; all-time high is ₹552.75 in June 2025.
### Returns & Volatility
- 1-month return: -1.48%.
- 1-year return: about 18%-20%.
- 3-year return: over 300%.
- 5-year return: over 1,900%.
- Weekly volatility is 6%, which is above average.
- Beta is 2.04, indicating higher risk and volatility versus the overall market.
### Valuation
- Price/Earnings Ratio: 42.31, higher than sector average.
- Price/Book Ratio: 8.58, above sector average.
- Dividend yield is 0.25%.
### Company Fundamentals
- Trailing 12-month revenue: ₹13.77billion.
- Net Profit Margin: 13.75%.
- EPS: ₹12.12.
- Gross margin: 34.13%.
- Debt to equity: 1.4%, showing low leverage.
### Valuation Analysis
- Estimated intrinsic value is ₹258.02.
- Current price is about 45% over this value, meaning the stock is overvalued.
### Qualitative Notes
- Strong profitability and cash flow, but price reflects high growth expectations.
- High volatility, especially in the short term.
- Dividend policy: small but regular.
- Recent technical signals showed buy recommendations, but the stock has been correcting lately.
**Overall:** The stock is highly priced relative to its value and historical norms, with impressive growth but also increased volatility and a potential for continued price correction.
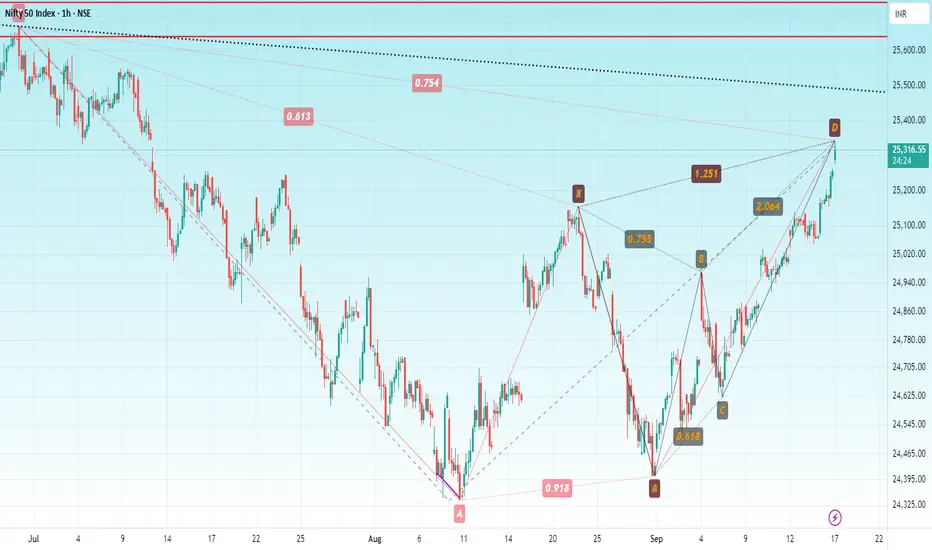
NIFTYHello & welcome to this analysis
On the eve of FOMC meet, the index has today covered the gap down made on July 11th and entered the potential reversal zone (PRZ) 25350 - 25425 of two bearish harmonic patterns - Butterfly (15m) & Gartley (daily).
Reversal confirmation as of now is once it starts giving a 60m close below 25225.
Pattern gets negated above 25525.
All the best
Regards
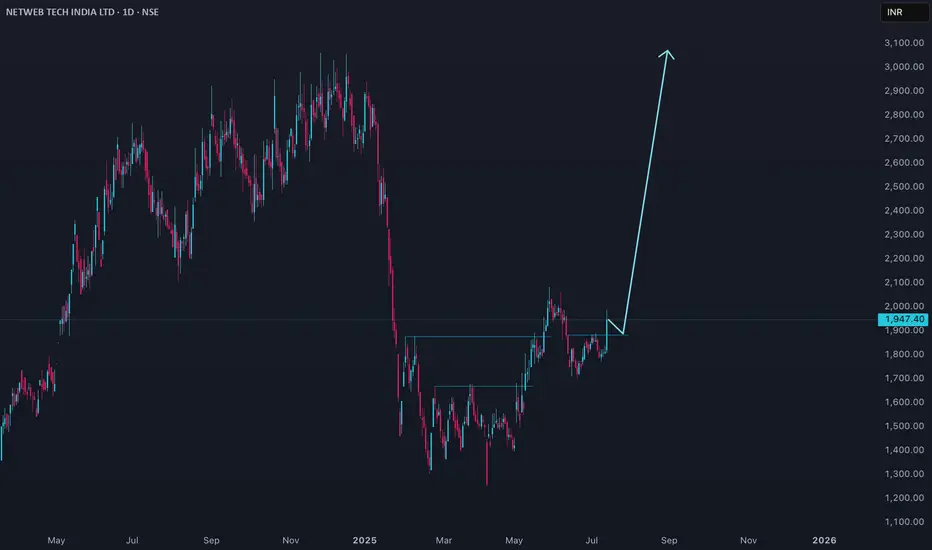
NETWEB Price actionNetweb Technologies (NETWEB) is trading at ₹1,947.40 as of July 11, 2025. The stock has shown a strong short-term recovery, up about 7.4% in the last session and nearly 6.8% over the past week, but it remains down by over 25% in the past six months. The 52-week high is ₹3,060 and the low is ₹1,251.55.
Valuation-wise, NETWEB is trading at a high price-to-earnings ratio (around 90–96) and a price-to-book ratio near 20, indicating a premium valuation. The company’s market capitalization is approximately ₹11,000 crore. Promoter holding has slightly decreased in the recent quarter.
For the near term, technical targets suggest resistance around ₹2,000–2,040 and support in the ₹1,750–1,850 range. Analyst forecasts for the next year place price targets between ₹1,824 and ₹2,805.
Fundamentally, the company is considered overvalued at current levels, despite strong recent profit growth. The stock’s premium valuation and recent volatility suggest caution for new investors, with further upside dependent on continued earnings momentum and broader market sentiment.
GRSE Price ActionGarden Reach Shipbuilders & Engineers Ltd (GRSE) is trading at ₹2,581.90 as of September 13, 2025, marking robust momentum after a sharp rally in recent months. The stock opened at ₹2,370 and reached a session high of ₹2,586.40, comfortably near its 52-week peak of ₹3,538. Market capitalization stands at approximately ₹29,576 crore, indicating significant institutional and retail interest following active trading volumes.
The company’s annual revenue exceeds ₹3,300 crore, propelled by sustained order flow from the Indian Navy, Coast Guard, and growing export opportunities. Net profit margins and operating margins have shown improvement, with current operating margin around 16% and return on equity above 18%, signifying strong operational efficiency and effective cost control. Recent quarterly profits have confirmed consistent earnings growth, supported by a healthy order book and streamlined project execution.
Financially, GRSE maintains a solid balance sheet with low debt and robust cash flows, enabling regular dividend payouts and reinvestment in capacity expansion. The price-to-earnings ratio is moderately higher than sector averages, reflecting market optimism about continued order wins and timely delivery of key projects. Promoter holding remains stable, and increased institutional participation underscores confidence in long-term prospects.
Technically, the stock trades decisively above both its 50-day and 200-day moving averages, indicating sustained bullish momentum. RSI and MACD readings are in a strong trend zone, but not yet in overbought territory, suggesting further upside potential if sector tailwinds persist. GRSE’s outlook remains constructive, with earnings visibility supported by a growing pipeline and ongoing modernization initiatives in naval and defense shipbuilding.

EUR/USD Long SetupPrice consolidating after recent downside move.
Entry taken from demand zone with stop below structure and target towards recent highs.
Looking for bullish continuation as liquidity builds to the upside.
REMEMBER THIS IS A HIGH RISK TRADE(Not the best setup possible)

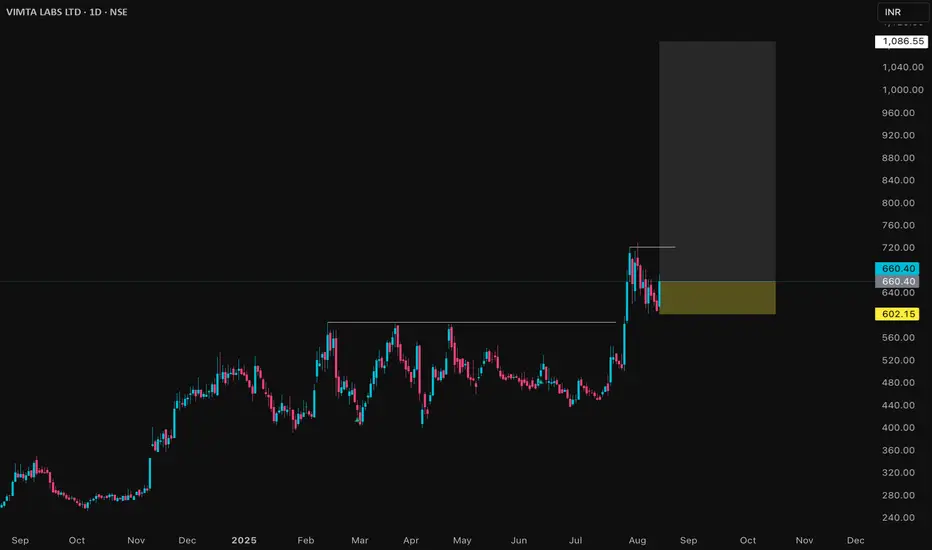
VIMTALABS Price Action## Vimta Labs Ltd – Price Analysis (August 2025)
### Price & Market Metrics
- Current share price is around ₹646–₹659 as of August 13, 2025.
- Market capitalization is approximately ₹2,900 crore.
- The 52-week price range is ₹241.30 (low) to ₹728.95 (high).
- The all-time high was ₹728.95 recorded in early August 2025.
- Recent price movement shows a strong rebound with gains around 6-7.5% over the past day.
### Returns & Volatility
- Over the last 1 year, the stock has surged by approximately 150-160%.
- The 6-month growth pace is about 14-16%.
- Weekly price moves have shown notable volatility, with recent declines around 7.5% in a short time frame.
- The stock exhibits moderate volatility consistent with strong recent price momentum.
### Valuation
- Price/Earnings (P/E) ratio is around 38.
- Price/Book (P/B) ratio is low, roughly 0.14 based on some sources, though others note around 3.6, indicating possible variation in book value interpretation.
- Dividend yield data is not prominent, indicating limited or no regular payout.
### Business & Fundamentals
- Vimta Labs is in the testing, inspection, and certification sector focused on quality control and laboratory testing services.
- The company benefits from growth in industrial and infrastructure sectors fueling demand for quality and compliance services.
- Recent market action indicates investor interest fueled by strong earnings growth expectations.
### Technical & Sentiment Overview
- The stock hit a fresh 52-week high recently but has shown some corrective pullbacks.
- Volume remains healthy reflecting active trading interest.
- The stock price is trading well above average levels, supported by positive market sentiment and sector tailwinds.
***
### Summary
Vimta Labs Ltd has exhibited a strong price rally in the past year with over 150% gains, reaching new highs in early August 2025. The current valuation by P/E stands elevated at about 38, reflecting growth optimism. The share price volatility is moderate but notable due to recent sharp moves. Market capitalization is close to ₹2,900 crore, with the stock trading near its peak levels. Investors should consider the premium valuation against ongoing growth prospects and sector dynamics, while monitoring for potential short-term price fluctuations or corrections.
Overall, Vimta Labs appears to be a growth-oriented stock with robust recent performance, but with valuation levels demanding careful risk assessment for new investors.
PRAENG Price Action
### Market & Price Metrics
- **Current share price:** ₹17.81 as of August 8, 2025.
- **Market capitalization:** ₹125crore.
- **52-week range:** ₹12.85 (low) to ₹22.80 (high).
- **Recent movement:** Price has declined by about 2.7% in early August, reflecting ongoing downward trend.
### Returns & Volatility
- **1-month change:** Negative, with price down from approximately ₹19.9 in early July.
- **1-year trend:** Down over 49% from August 2024.
- **Price swings:** High volatility, often 3-5% daily moves.
### Valuation
- **PE Ratio:** Not meaningful due to consistent losses (latest EPS: -₹4.29 for FY 2025).
- **Book Value Per Share:** Estimated near ₹38 but reflecting asset sales.
- **Dividend yield:** Nil – no payouts in recent years.
### Company Fundamentals
- **Revenue (FY 2025):** ₹57.5crore, little change over previous year; long-term growth remains muted.
- **Net Profit Margin:** Deeply negative, with net loss of about ₹30crore for FY 2025.
- **EPS:** Negative, improved (less loss) from previous FY (-₹4.29 vs -₹5.57).
- **Net Worth:** ₹486crore.
- **Total Assets:** ₹839crore.
- **Debt/Leverage:** Total outside liabilities ₹352.8crore; interest coverage very weak.
### Cash Flow & Profitability
- **Operating cash flow:** Positive at ₹19.2crore for FY 2025.
- **Free cash flow:** Volatile — positive some years, negative in others.
- **Return on Equity (ROE):** Negative.
- **Return on Assets:** Negative, driven by losses.
### Business & Qualitative Notes
- **Growth:** Minimal and below industry norm; 5-year annual revenue growth less than 3%.
- **Market share:** Continues to decline.
- **Profitability:** Negative margins and earnings; unable to achieve sustainable profitability.
- **Dividend:** No payout record; losses preclude distributions.
- **Shareholding:** Promoters hold about 36.8%, retail and others 63.2%.
### Technical & Sentiment
- **Trend:** Bearish in recent months; repeated breakdowns at support levels.
- **Analyst view:** Sentiment remains negative — company lacks near-term growth catalysts; high risk.
***
**Summary:** PRAENG is a deeply distressed small-cap real estate company, trading near multi-year lows after sustained losses, high volatility, and deteriorating fundamentals. No dividends, weak sales trends, and negative returns underscore significant investment risk at current prices.

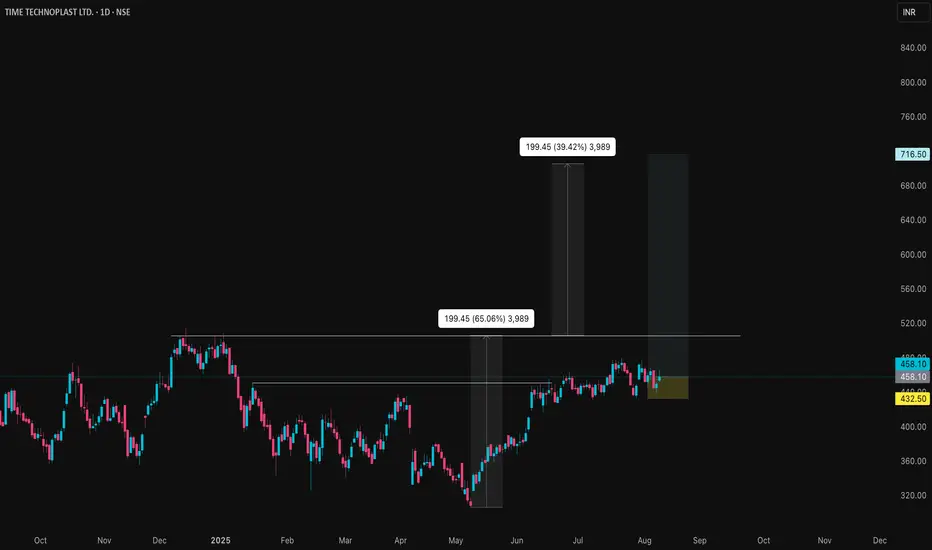
TIMETECHNO Price ction
### Market Metrics
- **Current share price:** ₹458.10.
- **Market capitalization:** ₹10,396crore.
- **52-week price range:** ₹306.60 (low) to ₹513.55 (high).
- **All-time low:** ₹17.55 (Feb 19, 2009).
- **All-time high:** ₹513.55 (Dec 13, 2024).
### Returns & Volatility
- **1-week change:** Down 1.98%.
- **1-month change:** Up 4.83%.
- **1-year return:** Up 43.18%.
- **Recent volatility:** Daily moves between ₹451.70 and ₹466.10 common.
- **Beta:** Not specified, but price swings indicate moderate volatility for sector.
### Valuation
- **Price/Earnings Ratio:** 26.79, above sector average.
- **Price/Book Ratio:** 3.88, also higher than sector average.
- **Dividend yield:** 0.55%.
### Company Fundamentals
- **Revenue (Trailing 12 months):** Approximately ₹54,570million.
- **Net profit margin:** 7.1%, improved over last year.
- **EPS (Trailing 12 months):** ₹17.10 (16.29% YoY growth).
- **Book value per share:** ₹118.21.
- **Return on Equity:** 13.3%.
### Growth & Profitability
- **Annual earnings growth:** 25% (past year), average 25.4% over 5 years.
- **Net profit for Q1 2025:** ₹10,952lakhs, up 18.6% YoY.
- **Free cash flow remains positive; margin improvement noted over 5 years.**
- **Return on assets:** 9.04%.
### Valuation Analysis
- **High PE and PB ratios indicate the stock is priced above sector averages.**
- **Recent buy recommendations from analysts; fair value status varies by source.**
### Qualitative Notes
- **Strong earnings and steady sales growth, but trading above intrinsic metrics.**
- **Growth momentum has slowed versus earlier years, though above industry norm.**
- **Stable dividend payout policy, but yield remains modest.**
- **Technical signals ranged from neutral to bullish in July and August 2025.**
**Summary:** The stock is trading at a high valuation given its growth history and sector performance. Investors should consider recent price corrections, volatility, and elevated PE/PB ratios before entering at current levels. The company maintains strong growth and profitability but is subject to valuation risk if sector trends reverse.