EURGBP - Weekly Smart Money PlanMarket Context
EURGBP steps into the new week under strong macro influence as markets reprice Bank of England vs ECB rate expectations. Sticky UK inflation, mixed UK data, and growing speculation around ECB rate cuts are driving erratic flows rather than clean directional trends.
This backdrop favors liquidity manipulation — stop hunts, false breakouts, and sharp reactions around key weekly levels — ideal conditions for Smart Money to operate.
Expect volatility around UK CPI, BoE commentary, and Eurozone data, especially near range extremes.
Smart Money Technical Read
Current State: Price remains within a broader bearish HTF structure, despite a strong bullish displacement from recent lows. The rally shows signs of being corrective, reacting into prior premium liquidity rather than initiating a new trend.
Core Bias: Sell premium after confirmation. Buy only at deep discount with structure shift. No chasing price in the middle of the range.
Structure Notes:
• HTF bearish structure remains intact
• Recent upside impulse shows liquidity grab characteristics
• Premium aligns with prior supply & buy-side liquidity
• Discount holds sell-side liquidity + inefficiency (FVG)
• Market currently rotating inside a controlled range
Liquidity Zones & Key Weekly Levels
🔴 SELL EURGBP: 0.87137 – 0.87147
SL: 0.87237
🟢 BUY EURGBP: 0.86541 – 0.86531
SL: 0.86441
🔴 SELL Scenario — Weekly Premium Distribution
Conditions:
✔ Price spikes into 0.8714 area on GBP weakness or EUR strength
✔ Buy-side liquidity taken above recent highs
✔ Bearish CHoCH / MSS on H1–M15
✔ Downside BOS confirms Smart Money intent
✔ Entry refined via bearish OB or FVG
Targets:
• 0.8680 — internal reaction
• 0.8655 — range low liquidity
• 0.8630s — weekly discount expansion
🟢 BUY Scenario — Weekly Discount Accumulation
Conditions:
✔ Sell-side liquidity sweep below 0.8654
✔ Price trades at deep weekly discount
✔ Bullish CHoCH / MSS on LTF
✔ Strong bullish displacement confirms accumulation
✔ Entry from refined bullish OB inside discount
Targets:
• 0.8680 — first reaction
• 0.8710 — internal liquidity
• 0.8730+ — if corrective upside extends
Institutional Playbook
Inducement → Liquidity Sweep → CHoCH / MSS → BOS → Displacement → OB / FVG → Expansion
⚠️ Risk Notes
• Expect fake moves around BoE & ECB headlines
• No structure = no trade
• Reduce size during news volatility
• Let price come to levels — patience pays
Weekly Summary
EURGBP remains a Smart Money range environment this week:
• Sell strength at premium (0.8714)
• Buy weakness only at deep discount (0.8654)
Trade levels, respect structure, and let liquidity reveal intent.
Follow Ryan_TitanTrader for Smart Money gold breakdowns.
Gbpusdanalysis

GBPUSD SHOWING A GOOD UP MOVE WITH 1:8 RISK REWARD GBPUSD SHOWING A GOOD UP MOVE WITH 1:8 RISK REWARD
DUE TO THESE REASON
A. its following a rectangle pattern that stocked the market
which preventing the market to move any one direction now it trying to break the strong resistant lable
B. after the break of this rectangle it will boost the market potential for break
C. also its resisting from a strong neckline the neckline also got weeker ald the price is ready to break in the outer region
all of these reason are indicating the same thing its ready for breakout BREAKOUT trading are follws good risk reward
please dont use more than one percentage of your capitalfollow risk reward and tradeing rules
that will help you to to become a bettertrader
thank you

GBPUSD SHOWING A GOOD DOWN MOVE WITH 1:8 RISK REWARDGBPUSD SHOWING A GOOD DOWN MOVE WITH 1:8 RISK REWARD
DUE TO THESE REASON
A. its following a rectangle pattern that stocked the market
which preventing the market to move any one direction now it trying to break the strong resistant lable
B. after the break of this rectangle it will boost the market potential for break
C. also its resisting from a strong neckline the neckline also got weeker ald the price is ready to break in the outer region
all of these reason are indicating the same thing its ready for breakout BREAKOUT trading are follws good risk reward
please dont use more than one percentage of your capitalfollow risk reward and tradeing rules
that will help you to to become a bettertrader
thank you

GBPUSD SHOWING A GOOD DOWN MOVE WITH 1:10 RISK REWARDGBPUSD SHOWING A GOOD DOWN MOVE WITH 1:10 RISK REWARD
DUE TO THESE REASON
A. its following a rectangle pattern that stocked the marketwhich preventing the market to move any one direction now it trying to break the strong resistant lable
B. after the break of this rectangle it will boost the market potential for breakC. also its resisting from a strong neckline the neckline also got weeker ald the price is ready to break in the outer region
all of these reason are indicating the same thing its ready for breakout BREAKOUT trading are follws good risk reward
please dont use more than one percentage of your capitalfollow risk reward and tradeing rules that will help you to to become a bettertrader
thank you

GBPUSD broke level of 1.34820As you can see GBPUSD broke level of 1.34820 and massive fall already happened so I give you next expected move.
Plan your trade accordingly.

GBP/USD Correction Almost Done: Bulls LoadingGBP/USD has already completed a big corrective structure from the previous high and is now moving inside a complex W-X-Y pattern. The current drop is forming the final C-wave of Wave Y, which suggests the bearish move is close to finishing. Price is likely to dip slightly lower near the support zone before finding buyers again. Once this final leg completes, the chart expects a strong bullish reversal to the upside. In simple terms, one more small drop to finish the correction, then GBP/USD should bounce and start a new uptrend.
Stay tuned!
@Money_Dictators
Thank you :)

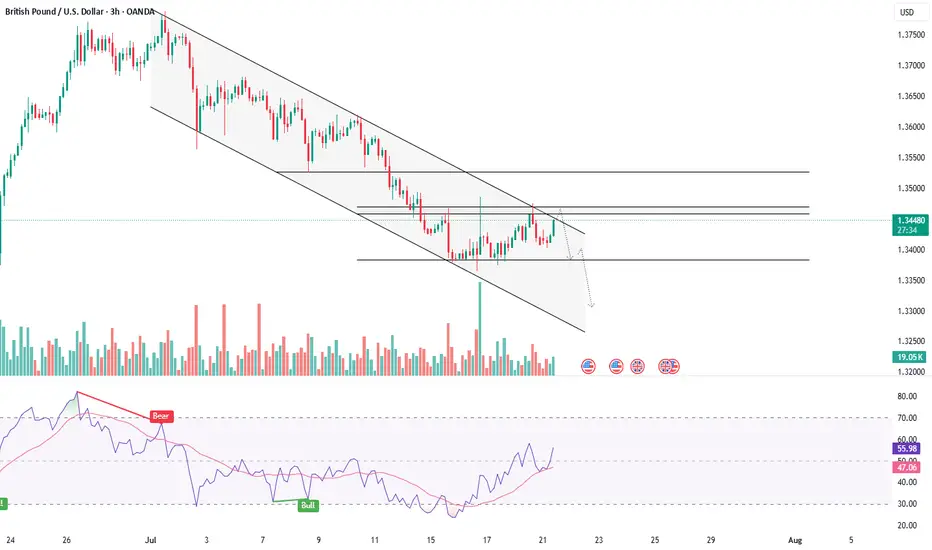
GBPUSD(20250911)Today's AnalysisMarket News:
The U.S. PPI annual rate for August hit 2.6%, the lowest since June. Traders are increasing bets on a Federal Reserve rate cut.
Technical Analysis:
Today's buy/sell levels:
1.3533
Support and resistance levels:
1.3584
1.3565
1.3553
1.3514
1.3502
1.3483
Trading Strategy:
If the price breaks above 1.3553, consider entering a buy position, with the first target price being 1.3565.
If the price breaks below 1.3533, consider entering a sell position, with the first target price being 1.3514

GBPUSD(20250909)Today's AnalysisMarket News:
New York Fed Survey: Consumers expect unemployment and job losses to rise, and the Fed is expected to cut interest rates next week.
Technical Analysis:
Today's Buy/Sell Levels:
1.3526
Support and Resistance Levels:
1.3601
1.3573
1.3555
1.3498
1.3480
1.3452
Trading Strategy:
If the price breaks above 1.3555, consider buying, with the first target price at 1.3573.
If the price breaks below 1.3526, consider selling, with the first target price at 1.3498

GBPUSD(20250905)Today's AnalysisMarket News:
The US August "Non-Farm Payrolls" report came in at 54,000, below the expected 65,000. The previous figure was revised up from 104,000 to 106,000. Initial jobless claims rose unexpectedly to 237,000 last week, the highest level since June.
Technical Analysis:
Today's Buy/Sell Levels:
1.3435
Support and Resistance Levels:
1.3477
1.3462
1.3451
1.3419
1.3408
1.3392
Trading Strategy:
On a breakout above 1.3435, consider a buy entry, with the first target at 1.3451.
On a breakout below 1.3419, consider a sell entry, with the first target at 1.3408.

GBPUSD(20250904)Today's AnalysisMarket News:
① Waller: I believe we should cut interest rates at the next meeting. Multiple rate cuts are possible in the future, but the exact pace depends on the data.
② Musallem: Current interest rates are appropriate, but there are risks in the job market.
③ Bostic: Concerned about inflation, I still believe one rate cut this year is appropriate.
④ The Federal Reserve will hold a payments innovation conference on October 21st, which will discuss stablecoins, artificial intelligence, and tokenization.
⑤ Fed Governor nominee Milan: If confirmed, I will maintain the independence of the FOMC.
⑥ Kashkari: There is room for a modest rate cut.
⑦ The Federal Reserve Beige Book: Economic activity is roughly flat, with businesses and households feeling the impact of tariffs.
Technical Analysis:
Today's Bullish/Bearish Divide:
1.3411
Support and Resistance Levels:
1.3535
1.3488
1.3458
1.3363
1.3333
1.3287
Trading Strategy:
If the price breaks above 1.3458, consider entering a buy position, with the first target price at 1.3488.
If the price breaks below 1.3411, consider entering a sell position, with the first target price at 1.3363

GBPUSD - NEAR RESISTANCE, BEARISH CONTINUATION IN SIGHTSymbol - GBPUSD
CMP - 1.3460
The GBPUSD currency pair is currently undergoing a countertrend correction, aligning with a broader retracement in the US dollar. This movement presents an opportunity for the pair to test the prevailing trend resistance and consolidate within a key liquidity zone. Market participants should closely monitor the immediate resistance level at 1.3467, which coincides with a significant concentration of liquidity pool relative to the local trend structure.
Given the prevailing bearish market sentiment, a confirmed breakout above the 1.3467 resistance level could serve as a potential catalyst for a reversal or short-term pullback, reflecting a reassertion of the dominant downtrend.
Key Resistance Levels: 1.3467
Key Support Levels: 1.3370
Should the pair fail to sustain upward momentum during a retest of the aforementioned liquidity zone, and if the price subsequently falls back below 1.3467, it could signal a renewed opportunity to engage in short positions aligned with the broader trend direction.
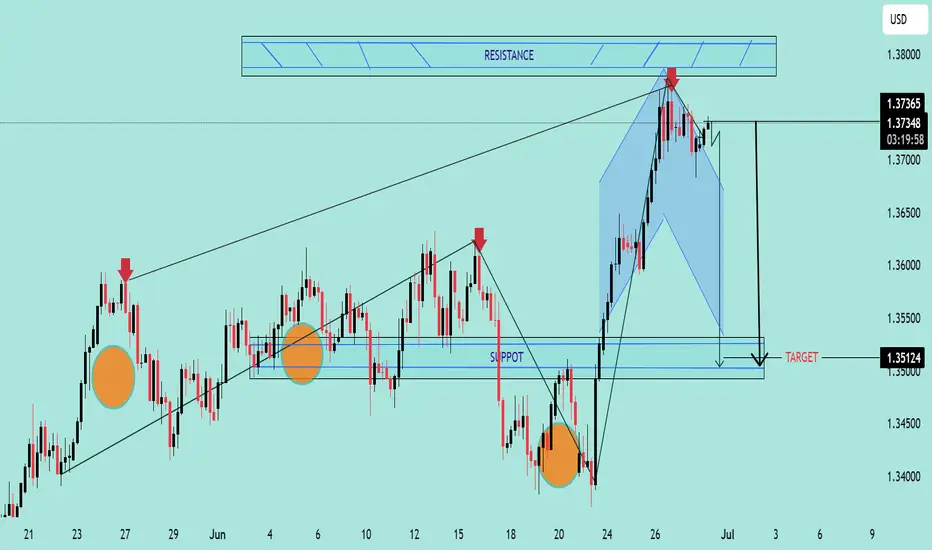
GBP/USD Bearish Harmonic Pattern Analysis GBP/USD Bearish Harmonic Pattern Analysis 🐻
🔍 Chart Overview:
The GBP/USD pair is presenting a bearish reversal scenario driven by multiple technical factors, including a well-formed bearish harmonic pattern, resistance rejection, and trendline breakdowns.
📌 Key Highlights:
🔺 Bearish Rejections:
Red arrows highlight multiple failed attempts to break above key trendlines and the resistance zone around 1.37800–1.38000, signaling strong seller interest.
🦋 Bearish Harmonic Pattern:
A completed harmonic pattern (likely a Gartley or Bat structure) indicates a potential reversal zone aligning precisely with the resistance area.
Price has already started to react downward from the D-point.
📉 Breakdown Structure:
Price broke below a key ascending trendline (now acting as resistance).
A fresh lower high has formed, confirming bearish momentum.
📦 Support & Target Zone:
Major support area marked between 1.35124 – 1.35300, aligning with historical demand zones and fib levels.
Target is set at 1.35124, which is both the harmonic pattern's projected leg and a strong confluence support.
🟠 Reaction Zones:
Orange circles highlight previous reaction points where price either bounced or reversed.
These zones confirm key liquidity areas where institutional activity may be present.
📊 Conclusion:
GBP/USD is respecting a bearish harmonic pattern and showing multiple signs of reversal from the resistance zone. If current momentum continues, price is likely to move toward the 1.35124 target zone. A break below 1.36000 would strengthen bearish confirmation.
🚨 Trading Note:
Traders should monitor for follow-through bearish candles and volume confirmation before entering short positions. Keep risk-managed with stops above 1.37800.
GBPUSD DON'T MISS IT!!!!!As per my view, GBPUSD did a break of structure last week and reject from daily fvg.
So I am expecting the price to move lower to atleast 1.3300 .
But my inner expectation is 1.3140 line.
I don't know what will happen.
But US is bullish after a long time , so I am expecting bullish is DXY for July.
There is nothing to say more than this.
But in the long run I am still bearish on DXY.

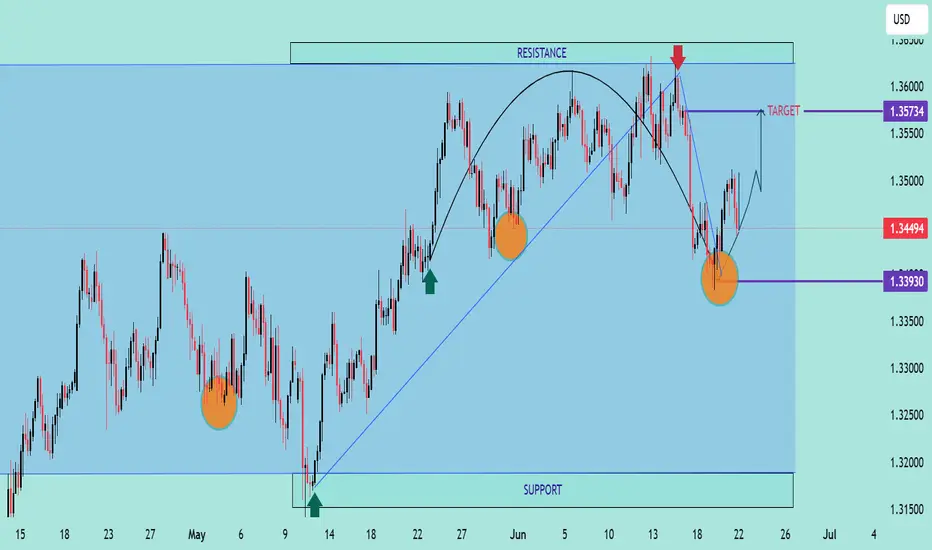
GBP/USD Potential Bullish ReversalGBP/USD Potential Bullish Reversal 📈🦾
📊 Technical Analysis Overview:
The chart showcases a well-defined horizontal range between the support (~1.31900) and resistance (~1.36200) zones. The price action has respected these levels multiple times, forming a clear accumulation zone at the bottom and rejection at the top.
🔄 Pattern Formation:
A Rounded Bottom (Cup) structure is visible forming from the June low.
The price made a bullish bounce near the key support level at 1.33930, marked by an orange circle, suggesting a potential higher low formation.
The blue downtrend line from the recent high (red arrow) has been broken, indicating a trend reversal attempt.
📍 Current Price: 1.34494
🎯 Target Zone: 1.35734
🛑 Support to Watch: 1.33930
📈 Bullish Confirmation:
A break above the minor neckline (around current price) would confirm a cup & handle breakout with a projected target of 1.35734.
Strong buying pressure and higher lows are reinforcing bullish strength.
⚠️ Risk Management Tip:
A breakdown below 1.33930 would invalidate the bullish setup and could retest the major support zone (~1.31900).
✅ Bias: Bullish, unless price closes below 1.33930
🕒 Outlook: Short- to Mid-term Upside Potential
GBP/USD Daily Chart Analysis – June 20, 2025 📉 GBP/USD Daily Chart Analysis – June 20, 2025 📊
📌 Chart Overview:
The GBP/USD pair is currently experiencing a critical technical phase. After a strong bullish rally from January 2025, price action has approached a key resistance level near the 1.3600 zone. Here's the detailed breakdown:
🟦 Key Highlights:
🔹 Resistance Zone 💥
Price is testing a major horizontal resistance between 1.3450 – 1.3600. This area has acted as a supply zone where sellers are currently active.
🔹 Trendline Support 🔺
A long-standing bullish trendline, active since early 2025, has been retested multiple times, confirming the trend’s strength.
🔹 Retest in Progress 🔄
Price recently pulled back after hitting the resistance and is now retesting the broken trendline, indicating a potential shift in trend if the trendline fails to hold.
🔹 Fake Breakout ⚠️
An earlier attempt to break below the trendline in April turned out to be a false breakout, which fueled bullish continuation. A similar scenario could be developing.
📊 Technical Outlook:
📈 If price breaks and closes above 1.3600, it would indicate strong bullish momentum and could open doors toward new highs.
📉 However, if the trendline breaks convincingly and retest fails, sellers may gain control with potential downside targets around 1.3200 and 1.3000.
📍 Conclusion:
GBP/USD is at a make-or-break zone 🧨. Traders should monitor the reaction at the trendline and resistance closely. Breakout or rejection here will shape the mid-term direction.
🔔 Watch for confirmation signals before entering positions.

GBP/USD Bearish Rejection at Resistance Zone – Downside Targets GBP/USD Bearish Rejection at Resistance Zone – Downside Targets Ahead 🚨
This chart analysis of GBP/USD reveals a clear bearish structure unfolding after the pair tested a strong resistance zone near the 1.36000 level. Here's the professional breakdown:
🔴 Key Resistance Zone: 1.36000 – 1.36200
Price has been rejected multiple times from this upper zone (marked in red).
Repeated upper wicks and lower closes signal selling pressure.
Recent candle formations suggest a potential reversal from this level.
🟢 Major Support Zones:
1.33090 (Mid-Level Support)
This level has acted as a reaction zone in the past.
Could provide temporary consolidation or bounce.
1.31500 – 1.32000
Strong historical support, price bounced here previously.
Bears might slow down in this area before continuation.
1.28000 – 1.29000
Deeper support zone; if broken, could indicate a major trend shift.
📉 Bearish Projection
Price is expected to descend toward 1.33090, and if momentum continues, potentially down to the 1.28 region.
The zigzag projection in the black box reflects a stair-step pattern typical of strong bearish legs.
🧠 Market Psychology & Price Action
Sellers are defending the resistance aggressively.
Lower highs and consistent rejection candles imply weakening bullish momentum.
This setup aligns with a distribution phase before a drop.
📌 Conclusion
🔻 As long as the price remains below the 1.36000 resistance, the bias remains bearish. Watch for confirmations at 1.33090 and 1.32000 – these are crucial zones where price decisions will unfold.
📆 Short to mid-term traders may look for sell setups on retracements with stop-losses above the resistance and targets near support zones.

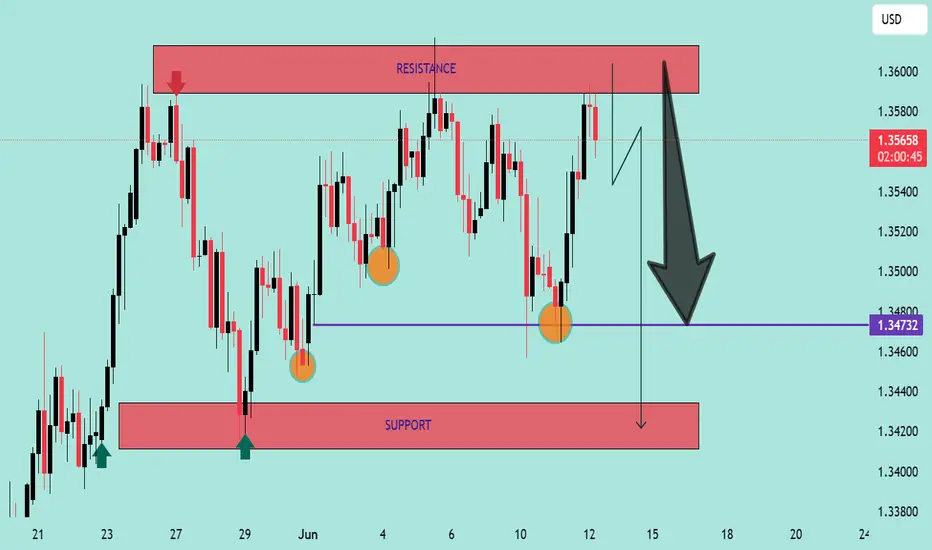
GBP/USD Technical Analysis – Bearish Setup Developing!GBP/USD Technical Analysis – Bearish Setup Developing! 🔻
Chart Breakdown (H4):
📌 Resistance Zone (🔴 1.35800 – 1.36000):
The pair has been rejected multiple times from this strong resistance area, marked by multiple upper wicks and bearish pressure. Most recent price action shows another rejection, forming a lower high.
📌 Support Level (🟣 1.34732):
This key horizontal level has acted as a strong support multiple times (highlighted with 🟠 circles), suggesting bulls are attempting to defend this zone.
📉 Bearish Structure Formation:
Price recently tested resistance again and was rejected sharply.
A potential double-top or lower high structure is forming.
A break and close below the 1.34732 support will likely confirm bearish momentum.
📍 Next Target (🔻):
If support breaks, price may fall towards the support demand zone around 1.34150 – 1.34300, aligning with the marked red support box.
📈 Invalidation Point:
A clean breakout and hold above 1.36000 would invalidate this bearish bias and potentially signal continuation higher.
⚠️ Summary:
🔼 Resistance Rejection at 1.36000
🔽 Watching for break below 1.34732
🎯 Bearish target: 1.34300 zone
🔄 Invalidation: Break above 1.36000
Bias: 📉 Bearish Below 1.34732
GBPUSD - FACES RESISTANCE AS BEARISH SIGNALS EMERGESymbol - GBPUSD
CMP - 1.3525
GBPUSD has been rallying amid a weakening US dollar but is now encountering strong resistance and showing signs of a false breakout suggesting a potential corrective phase ahead.
The pair is currently testing a key resistance zone within a distribution phase, with a double top pattern forming on the higher timeframe - a classic bearish reversal signal. Despite the broader bullish structure, the failure to sustain gains above key resistance 1.3600 and ongoing consolidation below 1.3545 point to weakening momentum.
Additionally, the US dollar has reached support levels and may begin to recover, adding further downward pressure on GBPUSD.
Resistance levels: 1.3548, 1.3570, 1.3600
Support levels: 1.3512, 1.3455
If the pair cannot hold above 1.3565 during this retest, a deeper pullback is likely, potentially offering short opportunities. The correction could extend toward the 1.3450–1.3365 & may test 1.3300 support range before any continuation of the broader uptrend.

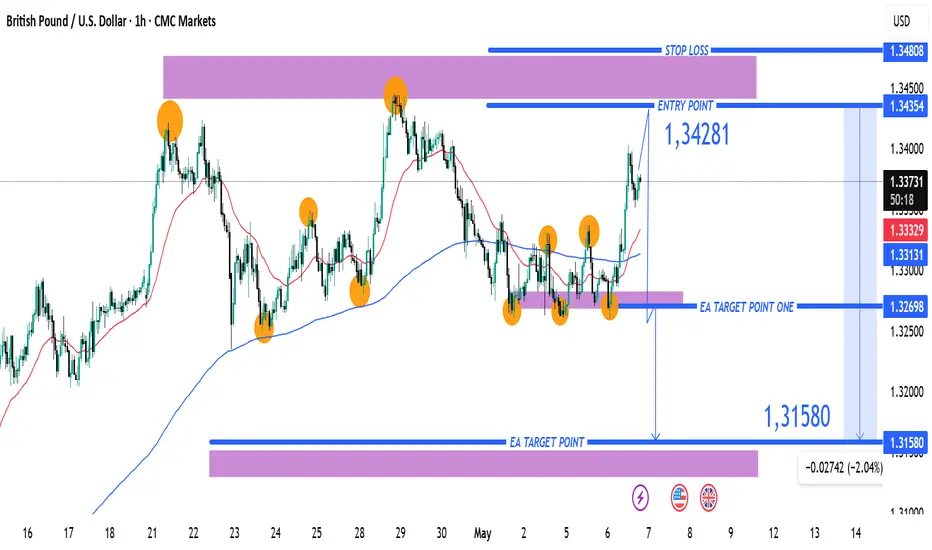
GBP/USD Short Trade Setup – Targeting 1.31580 from 1.34281Entry Point: 1.34281
Stop Loss: 1.34554 (about 27 pips above entry)
Target Points:
Target One: 1.32698
Final Target (EA Target Point): 1.31580 (approx. 270 pips from entry)
Risk/Reward Ratio: Favorable, given the tight stop and wider target.
📈 Chart Features
Highlighted Zones:
Resistance Zone (top purple area): A strong supply zone, where price reversed multiple times.
Support Zone (bottom purple area): Historical demand zone, previous price reactions.
Orange Circles: Represent key swing highs and lows (likely used to confirm the zones or a double/triple top/bottom pattern).
Moving Averages:
Red Line: Likely a shorter-period MA (e.g., 20 EMA).
Blue Line: Likely a longer-period MA (e.g., 50 or 200 EMA), often used for trend confirmation.
🧠 Interpretation
Price Action: The chart suggests the price recently hit a resistance zone and is expected to reverse.
Trade Bias: Bearish – expecting the market to drop from the resistance.
Indicators Support:
Price has rejected multiple times at the top.
Entry is slightly below resistance, confirming a potential reversal.
Targets align with support and past consolidation zones.
GBP/USD Short Trade Setup: Reversal from 1.34370 with Target at Entry Point:
Marked at 1.34370, where the analyst anticipates a reversal or price rejection.
Stop Loss:
Positioned above at 1.34975, covering a 2.62% risk margin. This is a protective level in case the price moves against the trade.
Target (Take Profit):
Set at 1.31015, just above a strong support zone around 1.30818. This is where the analyst expects the price to eventually fall.
Resistance Point:
Noted around 1.33007 – 1.32859, acting as an intermediate level of interest and possible price reaction zone.

"GBP/USD Bullish Setup: Eyeing 1.35656 Target "Trend: Bullish 📈
🔵 Price Channel
Price is moving inside an ascending channel 🔼
Top Line: Resistance
Bottom Line: Support
Multiple touchpoints confirm channel validity ●●●●●
📍Current Price: 1.34094
Above the 70 EMA (📉 EMA: 1.33510) ➡️ Bullish Bias ✅
📦 FVG (Fair Value Gap)
Zone: Potential support 🔵 Demand area
Expecting price to dip into this box before going up ⬇️🔵⬆️
🔒 Resistance Zone
Just above the FVG
Price faced rejection here 🚫
🎯 Target Point: 1.35656
Major bullish target for this setup 🚀
Clear sky above if price clears resistance ☁️➡️🌤️
🧠 Trade Idea
Wait for retracement into FVG zone 🔽
Enter Long (Buy) if support holds 💰
TP: 1.35656 🎯
SL: Below the FVG zone ❌
⚠️ Upcoming USD News Events

GBP/USD at a Turning Point – Correction Pattern in PlayIt appears that the corrective Wave A in the GBP/USD pair is nearing completion, and the formation of Wave B may be underway. The Wave 1 to 5 structure seems to have been completed, indicating the beginning of an A-B-C corrective phase.
If the correction unfolds as expected, potential upside targets are 1.32918 and 1.33555. However, if the market faces rejection below the trendline, the stop-loss level would be 1.32021.

GBPUSD - EYEING 1.3430 BARRIER - CORRECTION LIKELYSymbol - GBPUSD
CMP - 1.3406
The GBPUSD pair is gaining strength amid a broader rally driven by the ongoing decline in the US Dollar Index. This depreciation in the dollar is largely attributed to prevailing political dynamics in the United States, a shift in sentiment toward lower interest rates, and ongoing trade-related tensions. As a result, major currency pairs - particularly those within the dollar basket are experiencing upward momentum.
In this context, the British pound is appreciating and approaching a key resistance level at 1.3430, this area has not been tested since its last confirmation approximately six months ago and is characterized by significant liquidity, which may initially hinder further upward movement.
Key Resistance Level: 1.3430
Key Support Levels: 1.3292, 1.3207
Should the price approach this resistance sharply and fail to break through decisively - potentially forming a false breakout, there may be a subsequent corrective move. In such a scenario, a pullback toward the liquidity rich zone around 1.3292 could occur, especially if the pair fails to consolidate above 1.3430.
