GBP/USD Short Setup – Rejection from Resistance Zone with High REMA 30 (red line)
EMA 200 (blue line)
---
Key Levels:
Entry Point: 1.31324
Stop Loss: 1.32303
Target (TP): 1.28102
---
Analysis:
1. Trend Context:
The market shows a recent bullish move approaching a key resistance zone (highlighted in purple).
The price is now reacting to that resistance zone and potentially forming a reversal.
2. EMA Insight:
Price is currently trading slightly above the EMA 200 and EMA 30, indicating short-term bullish momentum.
However, the suggested trade setup appears to be short (sell), anticipating a reversal from
Gbpusdanalysis

GBP/USD Bearish Reversal Setup – Targeting 1.27451 (April 2025)"GBP/USD Sell Setup – Bearish Reversal Opportunity
⚙️ Trade Setup Summary
Entry Point (Sell Zone): Around 1.31668
Stop Loss: 1.32638
Take Profit (EA Target Point): 1.27451
Risk-Reward Ratio (R:R):
Risk: 1.32638 – 1.31668 = ~97 pips
Reward: 1.31668 – 1.27451 = ~422 pips
R:R ≈ 1:4.35 – very favorable
📊 Technical Analysis
Supply Zone (Resistance):
The purple zone near 1.31668–1.32638 is likely a key supply area where price previously reversed.
A small rejection wick is already forming near the entry, suggesting potential exhaustion.
Bearish Setup Expectation:
Anticipated reversal at resistance.
The plan likely involves waiting for a bearish confirmation (e.g., pin bar, engulfing candle) in the zone before shorting.
Moving Averages:
Price is above both the red (short-term) and blue (longer-term) moving averages, indicating current bullish momentum.
However, the trade anticipates a trend reversal or deeper retracement.
Target Zone:
The EA Target Point at 1.27451 is positioned at a prior demand/support zone — a logical level for take-profit.
🧠 Trade Thesis
This is a counter-trend trade aiming to catch a reversal from a resistance zone.
Strong confluence from price action and resistance makes this setup compelling, if proper confirmation appears.
⚠️ Risk Considerations
Bullish momentum is still strong, so aggressive entry without confirmation can be risky.
Monitor closely for rejection signs or bearish divergence before entry.
SL above 1.32638 provides safety buffer against stop hunts or spikes.
✅ Potential Title Suggestions
"GBP/USD Bearish Setup – Reversal from Resistance Targeting 1.2745"
"GBP/USD Short Trade Plan – Sell at 1.31668, Target 1.27451"
"GBP/USD Sell Opportunity – High R:R Bearish Setup

GBP/USD 1-Hour Chart Analysis: Bearish Setup with Key ResistanceGBP/USD 1-Hour Chart Analysis: Bearish Setup with Key Levels
Key Technical Indicators:
Current Price: $1.29427
30 EMA (Red Line): $1.29453 (Short-term trend)
200 EMA (Blue Line): $1.29351 (Long-term trend)
Key Resistance Zone: $1.29663 - $1.29851 (shaded purple)
Support & Target Levels:
TP 1: $1.29358
TP 2: $1.29153
TP 3: $1.28895
Final Target: $1.28662
Analysis:
Trend:
The price is struggling around the 30 EMA and 200 EMA, showing indecision.
The shaded resistance zone ($1.29663 - $1.29851) is a key area where sellers may take control.
Trade Setup:
Entry: Expected near $1.29663 (potential rejection from resistance).
Stop Loss: Above $1.29851 (to minimize risk if price breaks higher).
Take Profit Targets: Multiple levels, with the final target at $1.28662.
Bearish Confirmation:
If price gets rejected at resistance, a downside move toward support levels is likely.
A break below 1.29358 could accelerate selling pressure.
Conclusion:
The chart suggests a potential bearish trade setup, with resistance acting as a key rejection point.
Watch for confirmation signals at the resistance zone before entering a short trade.
A break above $1.29851 would invalidate the bearish outlook.

GBP/USD Trade Analysis: Bullish Reversal from Support ZoneExponential Moving Averages (EMAs):
200 EMA (Blue) at 1.29309: Represents the long-term trend.
30 EMA (Red) at 1.29122: Represents the short-term trend.
Price is currently below both EMAs, suggesting a bearish trend.
Support and Resistance Zones:
Resistance Zone (Purple at the top): Price previously reacted strongly at this level.
Support Zone (Purple at the bottom): A potential demand area where price is currently bouncing.
Trade Setup:
Entry Point: Near 1.28875 (highlighted on the chart).
Stop Loss: Set around 1.28714-1.28856, below the support zone.
Target Point: 1.29730, above the resistance and near the 200 EMA.
Risk-to-Reward Ratio: The setup aims for a higher reward than risk.
Trade Idea:
Bullish Reversal Trade: The price is reacting at a support zone, and the target aligns with a previous resistance level.
A confirmation (strong bullish candle or break of 30 EMA) could indicate a move toward 1.29730.
EMA Crossover Watch: If the 30 EMA crosses above the 200 EMA, it may confirm a stronger uptrend.
Potential Risks:
If price breaks below 1.28714, the bullish idea is invalid.
Resistance at 1.29309 (200 EMA) could slow the move upward.

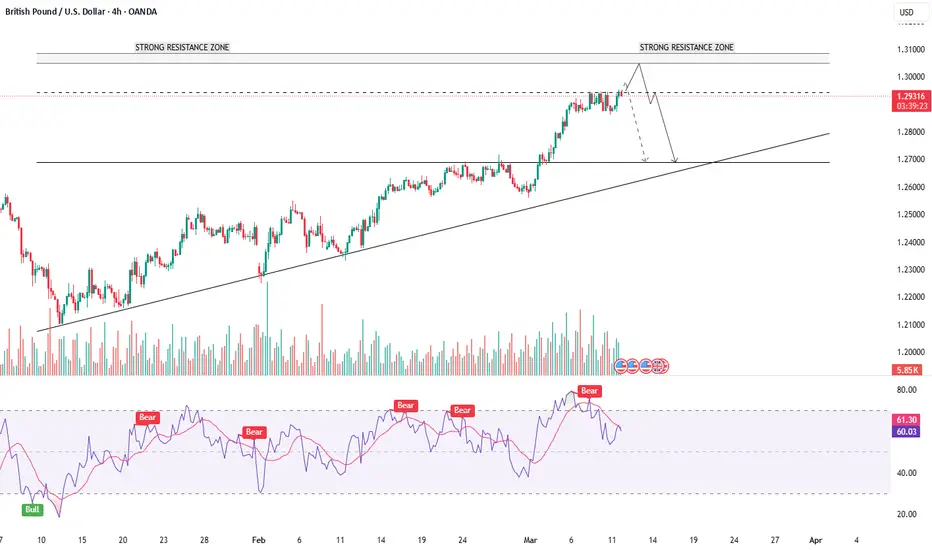
GBPUSD - BULLS NEED TO EXERCISE CAUTION - NEWS AHEADSymbol - GBPUSD
CMP - 1.2937
The GBPUSD pair has shown impressive bullish strength recently, continuing its upward move against the US dollar. This strength can be attributed to aggressive sell-off of the US dollar, which has created a favorable environment for the British pound. The pair is currently trading in a critical zone, with consolidation at the 1.2920 - 1.2940 levels, making it a pivotal point for future price action.
From a technical standpoint, I previously shared my analysis when GBPUSD was trading around the 1.2460 levels, identifying a strong breakout, and I'm pleased to report that all the targets I set have been reached.
However, the current situation remains complex, with crucial economic data due to be released shortly. US JOLTs job openings data is expected later today, followed by CPI data tomorrow. These releases will have a significant impact on the US dollar, which in turn will influence GBPUSD. Given that the US dollar index (DXY) is trading at oversold levels, if the upcoming data comes more than forecast, we could see a strong rebound in the US dollar, potentially pushing GBPUSD lower. However, if the data comes lower than expected reading, it could trigger another corrective move in the DXY & an up move in GBPUSD. Despite this, I believe such a move would be a false breakdown in DXY, with the US dollar likely to recover and strengthen in the medium term.
In the event of weaker than forecast data, the GBPUSD pair could see a push towards the 1.3050-1.3080 levels. These levels represent strong resistance zones, where the pair is likely to encounter selling pressure. Should GBPUSD reach these levels, a reversal back towards lower levels is highly probable.
Key Support Levels: 1.2920, 1.2900
Key Resistance Levels: 1.2950, 1.3000, 1.3060
As key support for the pair is at 1.2920-1.2900, and a strong break below these levels could signal a potential shift in trend. On the other hand, resistance levels lie around 1.2950. If the bulls manage to push past these levels, we may see further price growth till 1.3050-1.3080. However, bulls should exercise caution at current levels. Any reversal could occur sooner than expected, given the prevailing market conditions and upcoming economic data releases.
In conclusion, the fate of GBPUSD heavily depends on the upcoming US economic data. Traders should closely monitor the JOLTs and CPI data, as these will likely dictate the next move for the pair.
GBPUSD - TREND REVERSAL?Symbol - GBPUSD
GBPUSD is attempting to capitalize on a potential trend reversal amid the ongoing correction of the U.S. dollar. The price is currently testing a key resistance level within a consolidation phase, indicating a possible breakout. On the daily timeframe, the price remains above the previously breached trendline, with the effort to surpass the resistance providing insights into market sentiment. A continued correction in the dollar could benefit the British pound, particularly if the U.S. Dollar Index breaks below 107 and moves toward the 106-105 range.
From a technical perspective, attention is centered on the 1.257 level, which acts as a crucial resistance threshold. A sustained break and consolidation above this level may trigger a rally.
Resistance levels: 1.2575, 1.2718
Support levels: 1.250, 1.2377
I do not rule out the possibility of a retest of the 1.250 support level to accumulate liquidity before further upward movement. The dollar is expected to continue its correction following remarks from Trump and Powell regarding potential rate cuts.

GBPUSD Inverse head and shoulder patternFX:GBPUSD
Hi All, here you can see that, GBPUSD has created a Inverse head and shoulder pattern in 1D Time Frame. so we can go for long and pull back entries.

GBPUSD - BULLISH MOMENTUM TO CONTINUESymbol - GBPUSD
The GBPUSD pair has been showing strong bullish momentum, particularly after the reversal from the mid-January low and the recent rise back to 1.2500 The price action suggests potential for further upside, with 1.2700 emerging as the next key resistance level. Buying the dips remains the most favorable strategy in this context.
Currently, the price is attempting a local trend reversal. It has breached the resistance of the descending price channel and is consolidating above this level, within the buying zone. The underlying fundamental conditions, however, remain complex and unstable, influenced significantly by President Trump's policies and the ongoing tariff disputes with various countries. Sudden, sharp statements continue to have a notable impact on market sentiment.
Technically, the price is breaking through the resistance of a prolonged downtrend, offering an opportunity for a shift in the local trend. A breakout above the resistance at 1.2490, followed by consolidation above this level, could encourage further bullish momentum.
Key resistance levels: 1.2490, 1.2600, 1.2750
Key support levels: 1.2415, 1.2380
The price may test the previously broken channel resistance before continuing its upward movement. However, the 1.2490 level remains crucial. Should the bulls maintain support above this area, the currency pair may experience a short-term rally.

GBPUSD - READY FOR ANOTHER FALL ?Symbol - GBPUSD
The GBPUSD is currently testing the resistance level within its downtrend, but the price lacks the momentum to break through this range. Anticipation of upcoming news could further reinforce the downward movement. On the daily chart, the price is also exhibiting a false breakdown at a relatively significant level, reinforcing the notion that the market remains within the selling zone. The upcoming Federal Reserve meeting is expected to maintain the current interest rate, but the key focus will be on Chairman Powell's speech. Should his remarks lean towards a hawkish stance, which seems the most probable scenario, the US dollar may strengthen, potentially exerting downward pressure on the GBP.
From a technical perspective, the most substantial price movements typically occur following false breakouts.
Resistance levels: 1.2490
Support levels: 1.2415, 1.2380
A retest of the trend resistance resulting in a false breakout, followed by consolidation below the resistance line, could lead to further downward momentum. A break below the support level at 1.2415 would likely trigger additional selling. In the absence of unexpected news, the currency pair may decline towards the 1.2240 level.
I will be looking to enter a short trade in the 1.2480 - 1.2520 range, with a stop loss at 1.2550 and a target of 1.2340.

GBP/USD 4H Chart Analysis: Potential Market MovementIn this analysis, I'm presenting a potential price action forecast for GBP/USD on the 4-hour timeframe. The chart highlights a combination of technical patterns and key price levels to anticipate future market behavior. Here are the details of the setup:
Market Context:
The pair is currently trading within a clear bearish trend, as shown by the recent lower lows and lower highs.
The sell zone aligns with a key resistance level, suggesting a potential area for bearish continuation.
Projection and Scenarios:
Blue lines outline two potential paths for market movement:
Bullish retracement: Price might push higher to test the identified resistance area around 1.2440 before reversing downward.
Bearish continuation: Following the retracement, the market could resume the downtrend, targeting the support levels near 1.2265 and 1.1900.
Technical Zones:
Resistance Area: 1.2440, highlighted as the probable turning point.
Support Levels: 1.2265 (short-term) and 1.1900 (major target).
The green zone marks potential retracement before price continuation.
Risk Management:
Traders should watch for price action confirmation near the resistance area before entering short positions.
Stop losses should be placed above the resistance zone to minimize risk.
Indicators and Confluence:
The chart reflects a clear structure, with previous price reactions adding confluence to the identified zones.
Conclusion: This setup offers a well-defined risk-to-reward opportunity for those aligning with the trend. Remember to use proper risk management and wait for confirmation before taking any trades.

GBPUSD LONG - TRADE IDEA FOR HUGE PROFITSymbol - GBPUSD
GBPUSD is currently trading at 1.2310
I'm seeing a trading opportunity on buy side.
Buying GBPUSD pair at CMP 1.2310
I will be adding more if 1.2270 comes & will hold with SL 1.2240
Targets I'm expecting are 1.2430 - 1.270 & above
Disclaimer - Do not consider this as a buy/sell recommendation. I'm sharing my analysis & my trading position. You can track it for educational purposes. Thanks!

GBPUSD TRDAING POINT UPDATE > READ THE CAPTAIN Buddy'S dear friend 👋
GBP USD Traders SMC-Trading Point still looking short Trade 🤝🤜 Day list week. Good moving 😃 up trand. GBP USD Short trend entry 1.25992 1.26124 Technical fundamental analysis update. GBP USD running trend 📈. Support and resistance now again take it resistance level pullback down trand target 🎯 1.24843 wait entry open
Mr SMC Trading point
Support 💫 My hard analysis Setup like And Following 🤝 me that star ✨ game 🎯

GBPUSD TRADING POINT UPDATE >RAED THA CAPTAINBuddy'S dear friend 👋
GBP USD Traders SMC-Trading Point ☝️ Technical update on Gbpuad. Out of up trand.1.27300
Below 👇⬇️ 1.26092 technical analysis patterns for looking more Short Trade test diamond zone support 1.25000
Analysis target we'll see 1.25000
Back again rejected point below 👇 trend 1.26656
Resistance level 1.26655 1.26920
Support level 1.25000
Mr SMC Trading point
Support 💫 My hard analysis Setup like And Following me 🤝 that star ✨ game 🎯

GBPUSD R:R 1:6This is short term trade.
Reason for the trade
1.BOS with impulsive imbalance
2.ERL is done and IRL will be taken.
3.QML formation
4.Equal highs near to the OB.
Wait for candle stick rejection and CHOCH in LTF the enter.
Please do your own research before entering the trade.

GBPUSD SETUP BUY!!!!!I am bullish if price break the blueline(break of structure)
Then plan entry as per your model
Target 1.3015 learn by yourself don't follow my view blindly.

GBPUSD R:R 1:4 SetupIt just reacted the imbalance zone and the zone already created the EQL High behind that.
And CMP were already created the EQL Low and now creating trendline liquidity.
Wait for CHOCH while reached the Sell zone. Then Enter the market.
Please do your own research before entering the trade

BUY LONG GBPUSDLong position of GBPUSD as its at important support level and there is a rsi divergence and there is low volume in market near this support level also market has previous rejected this level and Fibonacci golden level and now market has again reached this level meaning a reversal in GBPUSD.

GBPUSD SHOWING A GOOD UP MOVE WITH 1:8 RISK REWARD GBPUSD SHOWING A GOOD UP MOVE WITH 1:8 RISK REWARD
DUE TO THESE REASON
A. its following a rectangle pattern that stocked the market
which preventing the market to move any one direction now it trying to break the strong resistant lable
B. after the break of this rectangle it will boost the market potential for break
C. also its resisting from a strong neckline the neckline also got weeker ald the price is ready to break in the outer region
all of these reason are indicating the same thing its ready for breakout BREAKOUT trading are follws good risk reward
please dont use more than one percentage of your capitalfollow risk reward and tradeing rules
that will help you to to become a bettertrader
thank you


GBPUSD SELL FOR FRIDAY!!!!!!!See price moving down with lot of selling pressure.
It may continue down .
1.2684 is the target price move in downside.
Learn to do analysis by yourself.

GBPUSD SETUP TRADE WIH 1:20 RISK REWARDGBPUSD SETUP TRADE WIH 1:20 RISK REWARD
A good selling setup detected on EURUSD
It's showing a BEAR MOVE due to these reason
1. It's following THE 60 M trendline here
2. It's ready to break the neckline
3. In day chat it's showing the heavy BEARISH pressure
Just grab out will your own risk
With a small amount
Stay connected
Stay happy
Bande mataram
GBPUSD SETUP TRADE WIH 1:20 RISK REWARD
A good selling setup detected on GBPUSD
It's showing a BEAR MOVE due to these reason
1. It's following THE 60 M trendline here
2. It's ready to break the neckline
3. In day chat it's showing the heavy BEARISH pressure
Just grab out will your own risk
With a small amount
Stay connected
Stay happy
Bande mataram

GBPUSD SETUP TRADE WIH 1:5 RISK REWARDGBPUSD SETUP TRADE WIH 1:5 RISK REWARD
A good selling setup detected on GBPUSD
It's showing a BEAR MOVE due to these reason
1. It's following THE 60 M trendline here
2. It's ready to break the neckline
3. In day chat it's showing the heavy BEARISH pressure
Just grab out will your own risk
With a small amount
Stay connected
Stay happy
Bande mataram
GBPUSD SETUP TRADE WIH 1:5 RISK REWARD
A good selling setup detected on GBPUSD
It's showing a BEAR MOVE due to these reason
1. It's following THE 60 M trendline here
2. It's ready to break the neckline
3. In day chat it's showing the heavy BEARISH pressure
Just grab out will your own risk
With a small amount
Stay connected
Stay happy
Bande mataram

#GBPUSD Present At Good Area For SellOnce the #GBPUSD closes below 1.2480 on the hourly chart, keep an eye for a retest of this level. If there's rejection on the retest on the M5/M15 timeframe, consider initiating a sell position with a 30-pip stop loss and a target of 70 pips down to 1.2400. There's substantial trendline liquidity beneath these levels.
