GBPUSD SHOWING A GOOD UP MOVE WITH 1:8 RISK REWARD GBPUSD SHOWING A GOOD UP MOVE WITH 1:8 RISK REWARD
DUE TO THESE REASON
A. its following a rectangle pattern that stocked the market
which preventing the market to move any one direction now it trying to break the strong resistant lable
B. after the break of this rectangle it will boost the market potential for break
C. also its resisting from a strong neckline the neckline also got weeker ald the price is ready to break in the outer region
all of these reason are indicating the same thing its ready for breakout BREAKOUT trading are follws good risk reward
please dont use more than one percentage of your capitalfollow risk reward and tradeing rules
that will help you to to become a bettertrader
thank you
Gbpusdlong

GBPUSD broke level of 1.34820As you can see GBPUSD broke level of 1.34820 and massive fall already happened so I give you next expected move.
Plan your trade accordingly.

GBP/USD Signals Trend Shift – Impulsive Upside ExpectedThe chart shows that GBP/USD has completed a full W–X–Y corrective pattern, with the final wave (y) and its C wave forming a clean bottom near the long-term support line. From that low, price has started a strong upward move, which looks like the beginning of a new impulsive Wave 1. The current pullback toward the 0.382–0.618 Fibonacci zone is typical behavior for a Wave 2 retracement before the next strong rally. As long as the price stays above the invalidation level at 1.30094 (the wave (y) bottom), the bullish scenario remains valid. This suggests that GBP/USD is preparing for a larger Wave 3 push to the upside.
Stay tuned!
@Money_Dictators
Thank you :)

GBPUSD(20250910)Today's AnalysisMarket News:
US employment data was significantly revised downward, with the number of jobs for the 12 months ending March revised down by 911,000.
Technical Analysis:
Today's Buy/Sell Levels:
1.3544
Support and Resistance Levels:
1.3616
1.3589
1.3572
1.3516
1.3499
1.3472
Trading Strategy:
On a breakout above 1.3544, consider a buy entry with the first target at 1.3572.
On a breakout below 1.3516, consider a sell entry with the first target at 1.3499

GBPUSD(20250905)Today's AnalysisMarket News:
The US August "Non-Farm Payrolls" report came in at 54,000, below the expected 65,000. The previous figure was revised up from 104,000 to 106,000. Initial jobless claims rose unexpectedly to 237,000 last week, the highest level since June.
Technical Analysis:
Today's Buy/Sell Levels:
1.3435
Support and Resistance Levels:
1.3477
1.3462
1.3451
1.3419
1.3408
1.3392
Trading Strategy:
On a breakout above 1.3435, consider a buy entry, with the first target at 1.3451.
On a breakout below 1.3419, consider a sell entry, with the first target at 1.3408.

GBP/USD Potential Bullish ReversalGBP/USD Potential Bullish Reversal 📈🦾
📊 Technical Analysis Overview:
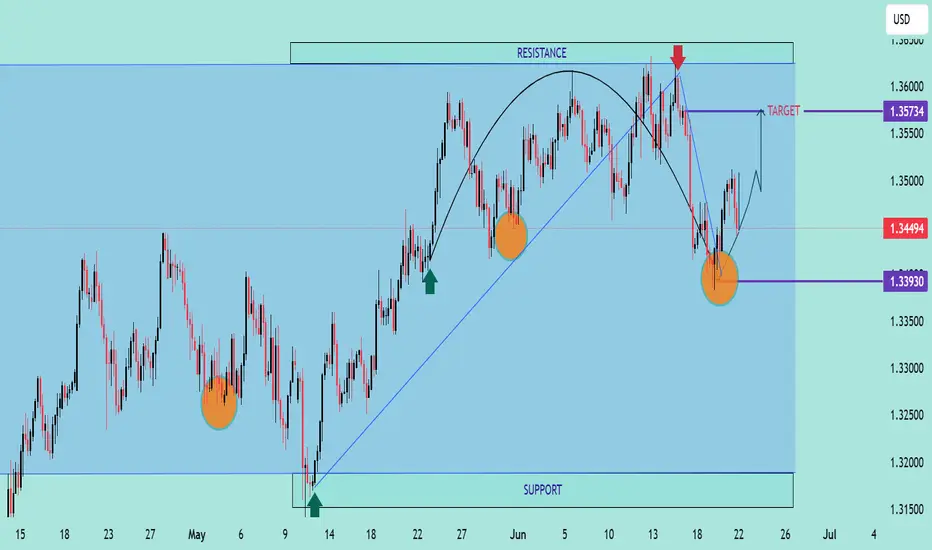
The chart showcases a well-defined horizontal range between the support (~1.31900) and resistance (~1.36200) zones. The price action has respected these levels multiple times, forming a clear accumulation zone at the bottom and rejection at the top.
🔄 Pattern Formation:
A Rounded Bottom (Cup) structure is visible forming from the June low.
The price made a bullish bounce near the key support level at 1.33930, marked by an orange circle, suggesting a potential higher low formation.
The blue downtrend line from the recent high (red arrow) has been broken, indicating a trend reversal attempt.
📍 Current Price: 1.34494
🎯 Target Zone: 1.35734
🛑 Support to Watch: 1.33930
📈 Bullish Confirmation:
A break above the minor neckline (around current price) would confirm a cup & handle breakout with a projected target of 1.35734.
Strong buying pressure and higher lows are reinforcing bullish strength.
⚠️ Risk Management Tip:
A breakdown below 1.33930 would invalidate the bullish setup and could retest the major support zone (~1.31900).
✅ Bias: Bullish, unless price closes below 1.33930
🕒 Outlook: Short- to Mid-term Upside Potential
GBP/USD Bearish Rejection at Resistance Zone – Downside Targets GBP/USD Bearish Rejection at Resistance Zone – Downside Targets Ahead 🚨
This chart analysis of GBP/USD reveals a clear bearish structure unfolding after the pair tested a strong resistance zone near the 1.36000 level. Here's the professional breakdown:
🔴 Key Resistance Zone: 1.36000 – 1.36200
Price has been rejected multiple times from this upper zone (marked in red).
Repeated upper wicks and lower closes signal selling pressure.
Recent candle formations suggest a potential reversal from this level.
🟢 Major Support Zones:
1.33090 (Mid-Level Support)
This level has acted as a reaction zone in the past.
Could provide temporary consolidation or bounce.
1.31500 – 1.32000
Strong historical support, price bounced here previously.
Bears might slow down in this area before continuation.
1.28000 – 1.29000
Deeper support zone; if broken, could indicate a major trend shift.
📉 Bearish Projection
Price is expected to descend toward 1.33090, and if momentum continues, potentially down to the 1.28 region.
The zigzag projection in the black box reflects a stair-step pattern typical of strong bearish legs.
🧠 Market Psychology & Price Action
Sellers are defending the resistance aggressively.
Lower highs and consistent rejection candles imply weakening bullish momentum.
This setup aligns with a distribution phase before a drop.
📌 Conclusion
🔻 As long as the price remains below the 1.36000 resistance, the bias remains bearish. Watch for confirmations at 1.33090 and 1.32000 – these are crucial zones where price decisions will unfold.
📆 Short to mid-term traders may look for sell setups on retracements with stop-losses above the resistance and targets near support zones.

GBP/USD Technical Analysis – Bearish Setup Developing!GBP/USD Technical Analysis – Bearish Setup Developing! 🔻
Chart Breakdown (H4):
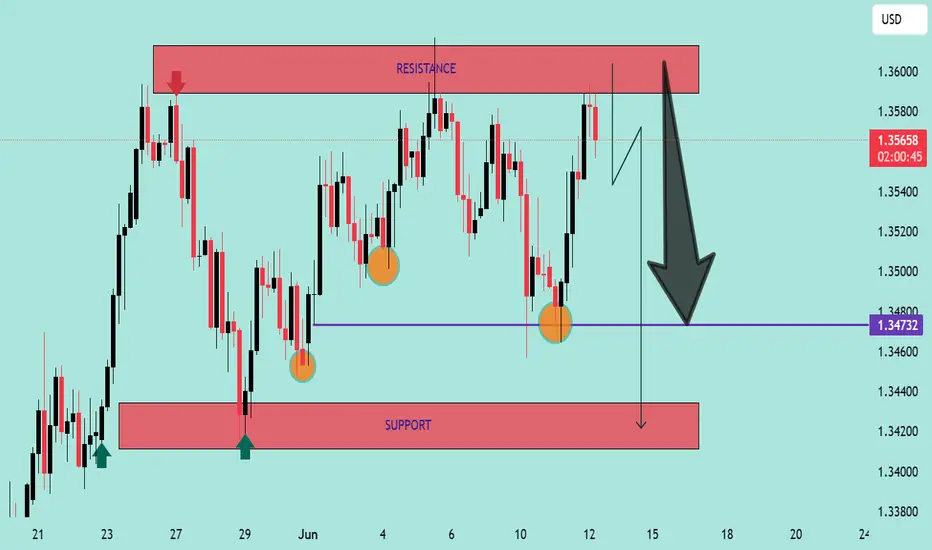
📌 Resistance Zone (🔴 1.35800 – 1.36000):
The pair has been rejected multiple times from this strong resistance area, marked by multiple upper wicks and bearish pressure. Most recent price action shows another rejection, forming a lower high.
📌 Support Level (🟣 1.34732):
This key horizontal level has acted as a strong support multiple times (highlighted with 🟠 circles), suggesting bulls are attempting to defend this zone.
📉 Bearish Structure Formation:
Price recently tested resistance again and was rejected sharply.
A potential double-top or lower high structure is forming.
A break and close below the 1.34732 support will likely confirm bearish momentum.
📍 Next Target (🔻):
If support breaks, price may fall towards the support demand zone around 1.34150 – 1.34300, aligning with the marked red support box.
📈 Invalidation Point:
A clean breakout and hold above 1.36000 would invalidate this bearish bias and potentially signal continuation higher.
⚠️ Summary:
🔼 Resistance Rejection at 1.36000
🔽 Watching for break below 1.34732
🎯 Bearish target: 1.34300 zone
🔄 Invalidation: Break above 1.36000
Bias: 📉 Bearish Below 1.34732
GBPUSD IS BULLISH!!As per analysis, market is trending higher.
Two weeks before market is bullish ( gains a lot).
So last week profit booking happens( just my view only).
Now you know what will happen in bullish market after profit booking,
Yes market will go higher.
My first looking area 1.3632
Second one is 1.3747 area.
This is totally my view only , do your own analysis before taking any decision.
Market is simple, but not easy.
One more thing( I am in a long position from 1.3458)

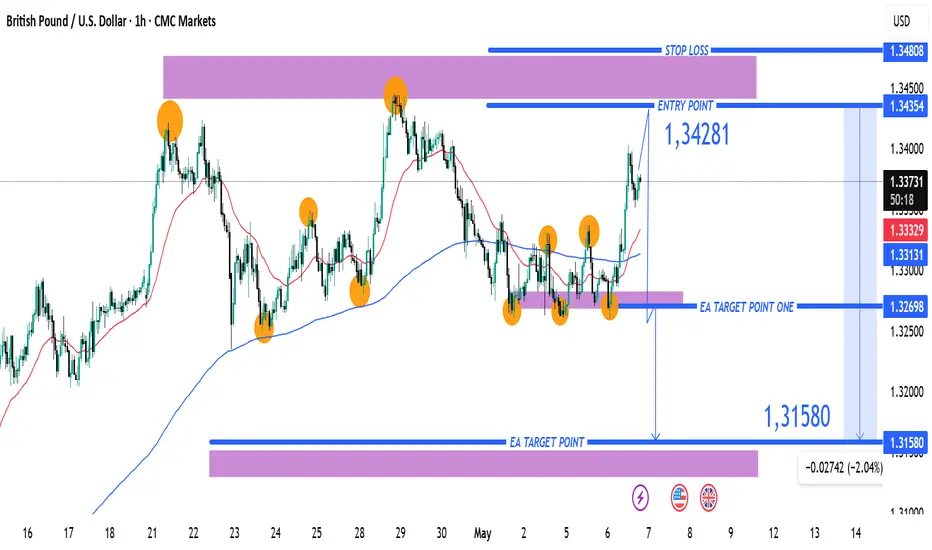
GBP/USD Short Trade Setup – Targeting 1.31580 from 1.34281Entry Point: 1.34281
Stop Loss: 1.34554 (about 27 pips above entry)
Target Points:
Target One: 1.32698
Final Target (EA Target Point): 1.31580 (approx. 270 pips from entry)
Risk/Reward Ratio: Favorable, given the tight stop and wider target.
📈 Chart Features
Highlighted Zones:
Resistance Zone (top purple area): A strong supply zone, where price reversed multiple times.
Support Zone (bottom purple area): Historical demand zone, previous price reactions.
Orange Circles: Represent key swing highs and lows (likely used to confirm the zones or a double/triple top/bottom pattern).
Moving Averages:
Red Line: Likely a shorter-period MA (e.g., 20 EMA).
Blue Line: Likely a longer-period MA (e.g., 50 or 200 EMA), often used for trend confirmation.
🧠 Interpretation
Price Action: The chart suggests the price recently hit a resistance zone and is expected to reverse.
Trade Bias: Bearish – expecting the market to drop from the resistance.
Indicators Support:
Price has rejected multiple times at the top.
Entry is slightly below resistance, confirming a potential reversal.
Targets align with support and past consolidation zones.
GBP/USD Short Trade Setup: Reversal from 1.34370 with Target at Entry Point:
Marked at 1.34370, where the analyst anticipates a reversal or price rejection.
Stop Loss:
Positioned above at 1.34975, covering a 2.62% risk margin. This is a protective level in case the price moves against the trade.
Target (Take Profit):
Set at 1.31015, just above a strong support zone around 1.30818. This is where the analyst expects the price to eventually fall.
Resistance Point:
Noted around 1.33007 – 1.32859, acting as an intermediate level of interest and possible price reaction zone.

GBP/USD Technical Outlook: Elliott Wave Mapping the Next MoveThis GBP/USD 4H chart presents an Elliott Wave analysis.
Wave (1) and (2): The market had an impulsive bullish movement in Wave 1, followed by a corrective Wave 2.
Wave (3): A strong bullish move with momentum.
Wave (4): A corrective phase, forming a triangle pattern (a-b-c-d-e), which suggests the market is preparing for another impulsive leg.
Entry Confirmation: A breakout above the triangle pattern.
First Target: 1.31457 (Fibonacci 0.382)
Second Target: 1.32105 (Fibonacci 0.5)

GBPUSD - TREND REVERSAL?Symbol - GBPUSD
GBPUSD is attempting to capitalize on a potential trend reversal amid the ongoing correction of the U.S. dollar. The price is currently testing a key resistance level within a consolidation phase, indicating a possible breakout. On the daily timeframe, the price remains above the previously breached trendline, with the effort to surpass the resistance providing insights into market sentiment. A continued correction in the dollar could benefit the British pound, particularly if the U.S. Dollar Index breaks below 107 and moves toward the 106-105 range.
From a technical perspective, attention is centered on the 1.257 level, which acts as a crucial resistance threshold. A sustained break and consolidation above this level may trigger a rally.
Resistance levels: 1.2575, 1.2718
Support levels: 1.250, 1.2377
I do not rule out the possibility of a retest of the 1.250 support level to accumulate liquidity before further upward movement. The dollar is expected to continue its correction following remarks from Trump and Powell regarding potential rate cuts.

GBPUSD Inverse head and shoulder patternFX:GBPUSD
Hi All, here you can see that, GBPUSD has created a Inverse head and shoulder pattern in 1D Time Frame. so we can go for long and pull back entries.

GBPUSD - BULLISH MOMENTUM TO CONTINUESymbol - GBPUSD
The GBPUSD pair has been showing strong bullish momentum, particularly after the reversal from the mid-January low and the recent rise back to 1.2500 The price action suggests potential for further upside, with 1.2700 emerging as the next key resistance level. Buying the dips remains the most favorable strategy in this context.
Currently, the price is attempting a local trend reversal. It has breached the resistance of the descending price channel and is consolidating above this level, within the buying zone. The underlying fundamental conditions, however, remain complex and unstable, influenced significantly by President Trump's policies and the ongoing tariff disputes with various countries. Sudden, sharp statements continue to have a notable impact on market sentiment.
Technically, the price is breaking through the resistance of a prolonged downtrend, offering an opportunity for a shift in the local trend. A breakout above the resistance at 1.2490, followed by consolidation above this level, could encourage further bullish momentum.
Key resistance levels: 1.2490, 1.2600, 1.2750
Key support levels: 1.2415, 1.2380
The price may test the previously broken channel resistance before continuing its upward movement. However, the 1.2490 level remains crucial. Should the bulls maintain support above this area, the currency pair may experience a short-term rally.

GBPUSD LONG - TRADE IDEA FOR HUGE PROFITSymbol - GBPUSD
GBPUSD is currently trading at 1.2310
I'm seeing a trading opportunity on buy side.
Buying GBPUSD pair at CMP 1.2310
I will be adding more if 1.2270 comes & will hold with SL 1.2240
Targets I'm expecting are 1.2430 - 1.270 & above
Disclaimer - Do not consider this as a buy/sell recommendation. I'm sharing my analysis & my trading position. You can track it for educational purposes. Thanks!

GBPUSD SETUP BUY!!!!!I am bullish if price break the blueline(break of structure)
Then plan entry as per your model
Target 1.3015 learn by yourself don't follow my view blindly.

BUY LONG GBPUSDLong position of GBPUSD as its at important support level and there is a rsi divergence and there is low volume in market near this support level also market has previous rejected this level and Fibonacci golden level and now market has again reached this level meaning a reversal in GBPUSD.

GBPUSD SHOWING A GOOD UP MOVE WITH 1:8 RISK REWARD GBPUSD SHOWING A GOOD UP MOVE WITH 1:8 RISK REWARD
DUE TO THESE REASON
A. its following a rectangle pattern that stocked the market
which preventing the market to move any one direction now it trying to break the strong resistant lable
B. after the break of this rectangle it will boost the market potential for break
C. also its resisting from a strong neckline the neckline also got weeker ald the price is ready to break in the outer region
all of these reason are indicating the same thing its ready for breakout BREAKOUT trading are follws good risk reward
please dont use more than one percentage of your capitalfollow risk reward and tradeing rules
that will help you to to become a bettertrader
thank you

GBPUSD LONG FOR FRIDAY!!!!!!Look the price action at this level.if price pushing up from this place then go for long trade.
Target maybe 40 - 60 pips and get out. If price not respecting then just chill don't force anything at any cost.............peace.

GBPUSD Order Block | SWING TRADEGBPUSD 4 hr Order Block | SWING TRADE
Hi traders,
This GBPUSD 4 hr Order block.
According to smc concept we can see Buying from this level.
Best time to take this trade after 15 CHoCH.
Note - Only for education purpose
If you like my anaylsis then you should like and follow me.

GBPUSD ShortFX:GBPUSD
Hello traders , here is the full multi time frame analysis for this pair, let me know in the comment section below if you have any questions, the entry will be taken only if all rules of the strategies will be satisfied. wait for more Smart Money to develop before taking any position . I suggest you keep this pair on your watchlist and see if the rules of your strategy are satisfied...
Keep trading
Hustle hard
Markets can be Unpredictable, research before trading.
Disclaimer: This trade idea is based on Smart money concept and is for informational purposes only. Trading involves risks; seek professional advice before making any financial decisions. Informational only!!!!

GBPUSDGreetings!
Welcome traders.
By choosing to "Follow", you can stay updated with the latest information promptly. Kindly consider clicking "Boost" as well.
Wishing you a pleasant day.
