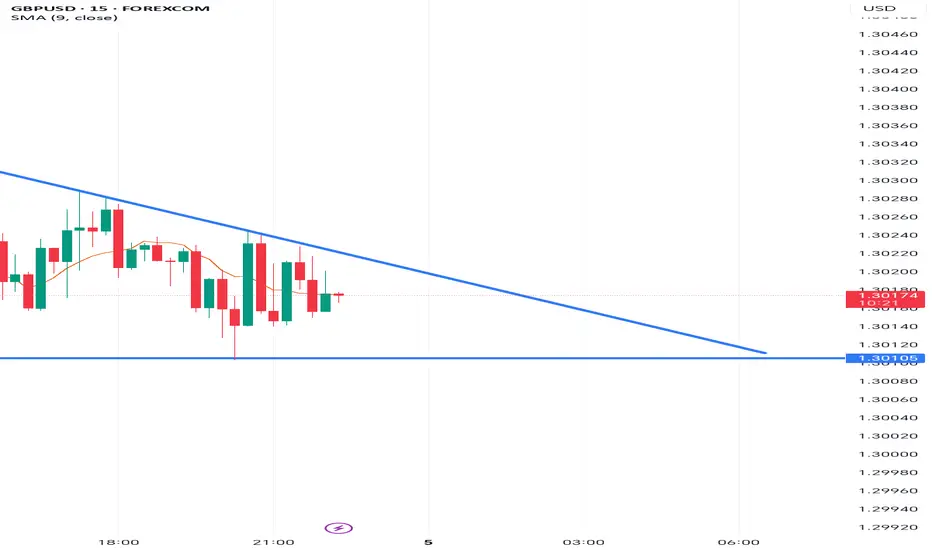
GBP/USD Forming Descending Triangle – Breakdown or Bounce Ahead?GBP/USD on the 15-minute chart is forming a descending triangle pattern, indicating potential bearish continuation pressure. The pair is currently trading around 1.3017, testing the strong horizontal support zone near 1.3010, while lower highs are being capped by a descending trendline resistance.
The 9-period SMA is trending slightly downward, reinforcing short-term bearish momentum. A break below 1.3010 could trigger a sharper move toward the 1.2990–1.2980 area. Conversely, if bulls manage to defend this support and push above the descending trendline, we could see a relief rally toward 1.3035–1.3050.
Trading Plan:
📉 Sell below 1.3010 with targets at 1.2990 / 1.2975, stop loss above 1.3025.
📈 Buy above 1.3035 with targets at 1.3055 / 1.3070, stop loss below 1.3015.
Bias: Bearish while below trendline resistance.
Pattern: Descending Triangle
Timeframe: 15M
📊 Keep an eye on the breakout — the next candle could confirm direction.
Gbpusdsignals
GBP/USD: Post-Impulse Sell Setup from Ending DiagonalThe chart depicts a completed 5-wave impulsive structure, culminating at the top of wave (5). The internal wave structure of the final fifth wave forms a classic ending diagonal pattern, typically signaling a trend reversal or deep correction.
After this extended fifth wave, the price has started rolling over, confirming the start of a corrective decline. The wave count now expects an ABC correction targeting the previous wave 4/2 demand zone, highlighted in red.
Target 1 (T1): 1.33608
Target 2 (T2): 1.32436
Stop Loss (SL): 1.35988
Ending diagonal at the top of wave (5) signals exhaustion of bullish momentum.
Clear bearish divergence (not shown here) is commonly seen with this pattern.
The price has broken the short-term structure and is now forming lower highs.
Target zone aligns with previous wave 2 consolidation – a typical retracement zone for post-impulse corrections.

GBP/USD Bearish Rejection at Resistance Zone – Downside Targets GBP/USD Bearish Rejection at Resistance Zone – Downside Targets Ahead 🚨
This chart analysis of GBP/USD reveals a clear bearish structure unfolding after the pair tested a strong resistance zone near the 1.36000 level. Here's the professional breakdown:
🔴 Key Resistance Zone: 1.36000 – 1.36200
Price has been rejected multiple times from this upper zone (marked in red).
Repeated upper wicks and lower closes signal selling pressure.
Recent candle formations suggest a potential reversal from this level.
🟢 Major Support Zones:
1.33090 (Mid-Level Support)
This level has acted as a reaction zone in the past.
Could provide temporary consolidation or bounce.
1.31500 – 1.32000
Strong historical support, price bounced here previously.
Bears might slow down in this area before continuation.
1.28000 – 1.29000
Deeper support zone; if broken, could indicate a major trend shift.
📉 Bearish Projection
Price is expected to descend toward 1.33090, and if momentum continues, potentially down to the 1.28 region.
The zigzag projection in the black box reflects a stair-step pattern typical of strong bearish legs.
🧠 Market Psychology & Price Action
Sellers are defending the resistance aggressively.
Lower highs and consistent rejection candles imply weakening bullish momentum.
This setup aligns with a distribution phase before a drop.
📌 Conclusion
🔻 As long as the price remains below the 1.36000 resistance, the bias remains bearish. Watch for confirmations at 1.33090 and 1.32000 – these are crucial zones where price decisions will unfold.
📆 Short to mid-term traders may look for sell setups on retracements with stop-losses above the resistance and targets near support zones.

"GBP/USD Bullish Setup: Eyeing 1.35656 Target "Trend: Bullish 📈
🔵 Price Channel
Price is moving inside an ascending channel 🔼
Top Line: Resistance
Bottom Line: Support
Multiple touchpoints confirm channel validity ●●●●●
📍Current Price: 1.34094
Above the 70 EMA (📉 EMA: 1.33510) ➡️ Bullish Bias ✅
📦 FVG (Fair Value Gap)
Zone: Potential support 🔵 Demand area
Expecting price to dip into this box before going up ⬇️🔵⬆️
🔒 Resistance Zone
Just above the FVG
Price faced rejection here 🚫
🎯 Target Point: 1.35656
Major bullish target for this setup 🚀
Clear sky above if price clears resistance ☁️➡️🌤️
🧠 Trade Idea
Wait for retracement into FVG zone 🔽
Enter Long (Buy) if support holds 💰
TP: 1.35656 🎯
SL: Below the FVG zone ❌
⚠️ Upcoming USD News Events

GBPUSD TRADING POINT UPDATE >RAED THA CAPTAINBuddy'S dear friend 👋
GBP USD Traders SMC-Trading Point ☝️ Technical update on Gbpuad. Out of up trand.1.27300
Below 👇⬇️ 1.26092 technical analysis patterns for looking more Short Trade test diamond zone support 1.25000
Analysis target we'll see 1.25000
Back again rejected point below 👇 trend 1.26656
Resistance level 1.26655 1.26920
Support level 1.25000
Mr SMC Trading point
Support 💫 My hard analysis Setup like And Following me 🤝 that star ✨ game 🎯

GBPUSDFX:GBPUSD
As you can see that, GBPUSD has created a head & shoulder pattern in 1D Time frame. If it gives breakout then we can plan for sell side. This set-up is for monday (04-09-2023) Plan your trade accordingly...

GBPUSD UP Trend.!#GBPUSD Looking for Buy trade setup as I mentioned in the Chart.!
Keep Supporting LIKE, COMMENT And FOLLOW.!
Thank You.!

GBPUSD ForecastGBPUSD Forecast
IMO
Give a Like and Feel free to share your opinions in the comment!
Happy Trading 😊

GBPUSDDear traders,
As I have been accustomed to in recent months and this time my technical analysis had an accuracy rate of over 95% and I will try to continue to keep this percentage as long as possible
I said in the last weeks ...as I said last week UG started the descent but has not yet left the critical area! I will wait until the beginning of the week to see if Friday's massive withdrawal was just the NFP effect or will it continue to climb ... but for now I will start looking for SELL for 700-1000 pips as I said!
However ... a close even for 1 day over 42300 will force me to think of BUY another 100-150 pips and then ... DOWN AGAIN
THIS WEEK...GU has started the massive decline and has already made 400 of the 700-1000 pips we anticipate!
even if it will still range in this area or will go up a maximum of 100-120 pips ... my next target is 1.36700 and after ... 1.33800 from where I will reanalyze
NOTE: Please, give a LIKE if you find this idea useful!
GREAT ATTENTION:
*This information is not a Financial Advice.

GBPUSD SHORT TRADE SETUPThe 4 hour right side is down against 12/13/2019 peak (1.3522). 1 hour is turning down against 1.2645 high. Near-term, while bounces fail below 1.2645 high and more importantly below 1.3522 high expect pair to extend lower.DO NOT TRADE ON BUYING SIDE
