Gold Price Action: Healthy Pullback Within Broader UptrendGold is currently trading within a well-defined range on the daily timeframe, consolidating between 3,910 and 4,025 on a closing basis. Over the past several sessions, we've witnessed multiple attempts by buyers to reclaim the psychological 4,000 level, but sellers have consistently stepped in during intraday rallies, keeping the price action contained within this range.
From my perspective, this consolidation is likely to persist for a while longer. Looking ahead, I anticipate the range could potentially extend between 3,850 and 4,200 over the coming weeks as market participants digest recent moves. It's worth noting that we should prepare for a worst-case scenario where price breaks below 3,850 on a closing basis, especially given that volatility tends to pick up during year end trading.
That said, My view in this current phase as a healthy correction within the broader bull market. My bias remains tilted toward the buy side, and I'm expecting a potential resumption of the uptrend somewhere in the next 1-2 months, possibly around mid-January. The key here is patience with money management allowing this consolidation to play out while staying ready to capitalize on the next directional move. As always, proper risk management is crucial, particularly with year-end volatility on the horizon.
Gold

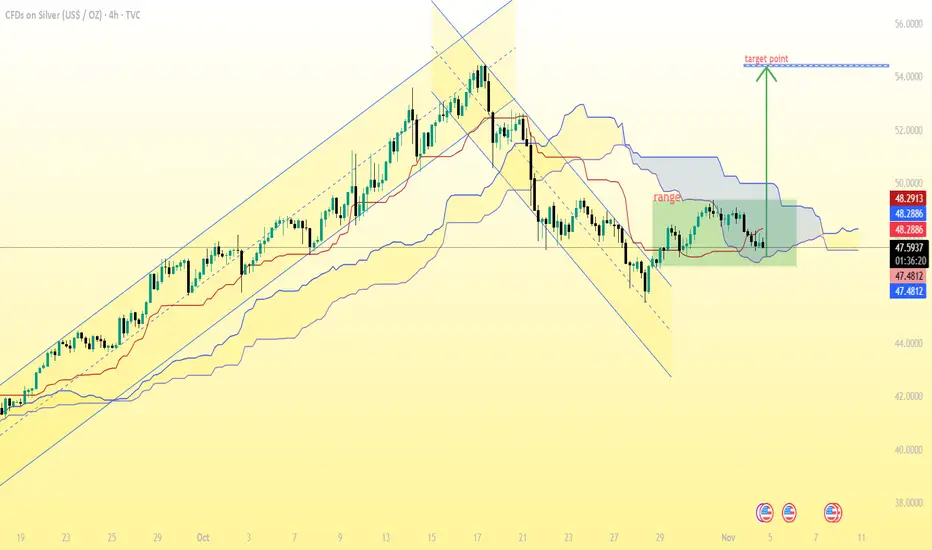
(Silver / USD, 4H timeframe)...(Silver / USD, 4H timeframe):
✅ Analysis Summary:
The price has broken out of a falling channel and is now moving inside a range, just below the Ichimoku cloud.
The projected move (marked on my chart) shows a bullish breakout from the range.
The measured move target from the breakout zone points upward to the $52.15–$52.50 area.
📈 Target Levels:
Immediate resistance: $48.30 – $48.70
Breakout confirmation: Above $49.00
Main bullish target: $52.10 – $52.50
Extended target (if strong momentum): $53.80 – $54.00
📉 Support levels:
$47.50 (near cloud base)
$47.00 (range bottom)
➡ Conclusion:
If Silver sustains above $49.00, the next target is $52.15 – $52.50 as shown in my chart.
If it fails to hold above $47.50, the bullish setup becomes invalid.
L
(EUR/USD, 2-hour timeframe...(EUR/USD, 2-hour timeframe, with Ichimoku Cloud and descending channel):
The price is currently breaking below the lower channel boundary and the Ichimoku Cloud is fully bearish — both strong continuation signals.
The chart shows a projected “Target Point” zone around 1.1415, which seems to be the first target area marked.
If bearish momentum continues below 1.1415, the next extended downside targets can be:
TP1: 1.1415 (already shown on my chart)
TP2: 1.1380 (next support zone from previous swing)
TP3: 1.1350 (major channel base & psychological support)
📉 Summary:
Trend: Bearish
Immediate Target: 1.1415
Next Targets (if breakdown continues): 1.1380 → 1.1350
Stop-loss (for shorts): Above 1.1485–1.1500 (upper channel resistance)

BTC/USDT (4h timeframe)...BTC/USDT (4h timeframe), I can summarize what’s visible and help interpret my targets:
Current price: Around $107,469
Chart setup: my using Ichimoku Cloud (Kumo) with marked zones:
Resistance level (green zone) around $107,000 – $108,000
Two target points drawn on the chart:
First target point: around $111,350 – $111,500
Second (higher) target point: around $116,500 – $117,000
✅ Summary of target levels visible on my chart:
1. Target 1: ~$111,350
2. Target 2: ~$116,700
These targets are likely based on a breakout above the Ichimoku Cloud and prior resistance zones.

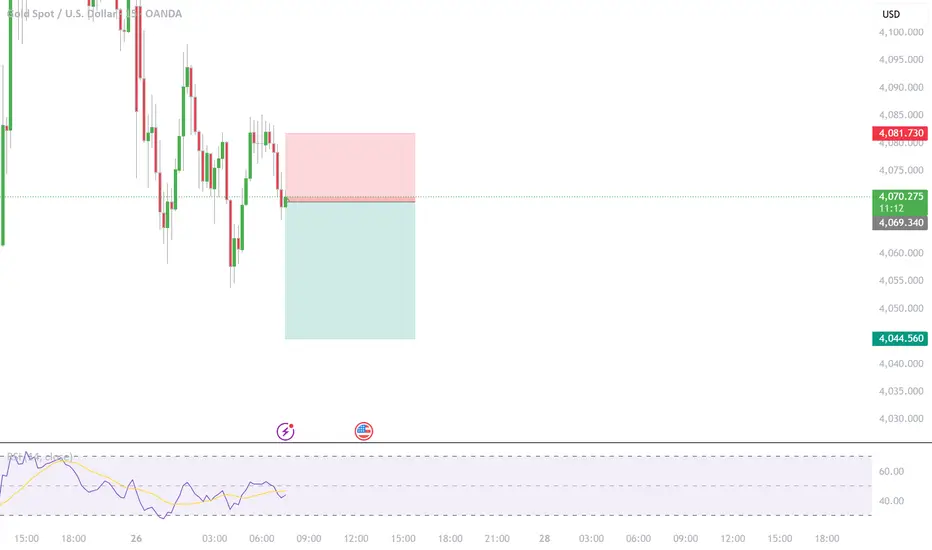
Gold Squeeze: Range Breakout Can Trigger $4,100+ MoveLooking at the current gold price action on the H1 chart, we're seeing a technical setup that's been developing over the past several sessions. The market has clearly established a well-defined range between approximately $3,900 and $4,040, with price respecting both the upper and lower boundaries quite consistently.
price is holding above this ascending support while simultaneously testing the middle-to-upper zone of the range suggests building bullish momentum.
We've seen multiple attempts to push lower get absorbed by buyers, creating a series of higher lows that demonstrate underlying strength. The grey horizontal zone around $4,020-$4,040 represents the key resistance level where sellers have previously shown up, but notice how price action is becoming increasingly compressed near this level a classic sign that a breakout may be imminent.
From a probability standpoint, the combination of higher lows, sustained buying interest, and the current positioning near range highs favors an upside breakout. If gold manages to close convincingly above $4,040, we could see an accelerated move toward the $4,100+ zone fairly quickly, as there's limited technical resistance overhead once this range ceiling is breached.
However, it's worth noting that range-bound markets can be deceptive, and false breakouts are always a possibility. The key will be watching for a decisive move with strong volume and follow-through. Until we get that confirmation, remaining patient with existing positions while maintaining appropriate risk management makes sense.
The market appears coiled and ready to make its next significant move all signs point to higher prices, but as always, let the price action confirm the breakout before adding to positions.

XAU/USD (Gold Spot vs. U.S. Dollar) 1-hour chart XAU/USD (Gold Spot vs. U.S. Dollar) 1-hour chart on TradingView.
Here’s what I can observe:
There is a symmetrical triangle pattern (a type of consolidation pattern) drawn on the chart.
The price appears to be breaking out upwards from the triangle.
There’s an arrow drawn upward with a “target point” marked above current price levels.
To calculate the target from this breakout:
📈 Symmetrical Triangle Target Formula:
Target = Breakout Point ± (Height of the Triangle)
1. Measure the height of the triangle:
From the highest point of the pattern to the lowest point within the triangle.
Approximate values (from the chart):
High ≈ 4,080
Low ≈ 3,940
→ Height ≈ 140 points
2. Add the height to the breakout level:
Breakout ≈ 4,000
→ Target ≈ 4,000 + 140 = 4,140
🎯 Estimated Target: 4,140 USD
That matches closely with the dashed horizontal line labeled “target point” on my chart — right around 4,120–4,140.
So, my bullish target zone after breakout is approximately 4,120–4,140 USD per ounce.

Gold Continues to Struggle at 4000We're seeing a familiar story play out in gold as it makes multiple attempts to reclaim and hold above the 4000 level, but none of these efforts are showing the conviction we need to see from buyers. The price action on the hourly chart is particularly telling ,we're witnessing similar structural patterns repeating themselves, which often indicates indecision or a lack of strong directional commitment from either side. Once again, we've seen the rising support trendline get broken, which is not ideal for the bullish case in the short term.
However, there's a small silver lining worth noting. Today's CPR is showing an ascending structure, which typically carries some positive implications for intraday sentiment. It's not a game-changer by itself, but it does suggest that the technical setup isn't completely bearish. The key level to focus on for today's session is the CPR BC at 3971. This becomes our pivotal point ,if bulls can sustain trading above this level throughout the day, we could see another recovery attempt materialize toward the higher side. The ability to hold above 3971 would at least keep the door open for further upside exploration.
On the flip side, if we fail to maintain support at 3971 during the intraday session, it could trigger another leg down toward lower levels. Given the repetitive failed attempts at 4000 and the breakdown of support trendlines, the market is clearly at a crossroads here. We need to see some decisive action one way or the other to break out of this choppy, repetitive pattern.
As for my positioning, there's no change to my approach. I'm still holding my buy positions and actively managing the trades as this price action develops. The patience game continues, and while these repeated failures at 4000 are testing that patience, the broader picture still supports the long-term bullish thesis.

#Gold | From Double Top Breakdown to Potential W Reversal#XAUUSD | 4H Chart
Formed an M pattern (Double Top) , broke down, and completed its target ✅
Now taking support at the demand zone, showing early signs of a W-pattern formation (potential bullish reversal).
Support: 3944.43 / 3915.52 / 3892.95-3897.13
Immediate Resistance: 4030.34-4033.87
Key Resistance Levels:
4056.70-4065.52 / 4133.00-4154.79 / 4185.91-4205.12 (previous M-pattern breakdown zone)
Expectation:
If #XAUUSD surpasses 4034 on 4 HCB , price may retest the M-pattern breakdown zone (4185-4205) .
#Gold #XAUUSD #Wpattern #Mpattern #ChartPattern #PriceAction #Commodities
📌 Disclaimer: This analysis is shared for educational purposes only. It is not a buy/sell recommendation. Please do your own research before making any trading decisions.

AUD/USD (3H)...AUD/USD (3H) chart, here’s a breakdown of what I see and how the target can be projected:
---
🧠 Pattern Analysis
My identified a Cup and Handle pattern, which is a bullish continuation setup.
Cup low: around 0.6450
Cup rim (resistance / breakout level): around 0.6580 – 0.6590
Current price: ~0.6585 (right around the breakout level)
Handle: short pullback, touching near Ichimoku cloud support — healthy structure before potential breakout.
---
🎯 Target Projection (Cup & Handle Rule)
Cup and Handle target = Breakout level + Depth of the cup
Depth of cup:
0.6585 (rim) – 0.6450 (bottom) = 0.0135
Target = 0.6585 + 0.0135 = 0.6720
---
✅ Target Summary
Entry (breakout confirmation): above 0.6590
Target: 0.6720
Stop-loss: below 0.6535 – 0.6540 (below handle & cloud support)
Risk/Reward ratio: ~1:2.5
---
💡 Bonus Confirmation
Price is above the Ichimoku Cloud (bullish bias).
Handle retracement is shallow and respecting Tenkan/Kijun lines — typical of strong continuation setups.
Volume on breakout (watch for increase) would add confirmation.
---
Final Target: 0.6720 (main take-profit zone)

GBP/JPY 2-hour chart...GBP/JPY 2-hour chart, here’s what I can interpret based on my markings:
Range zone (pink box): approximately 203.8 – 204.4
Resistance zone (green box): around 201.0 – 201.5
Current price: ~202.18
Ichimoku cloud: price is just breaking back toward the cloud (potential short-term bullish momentum)
Marked target point: around 204.3 – 204.4
🎯 Target Analysis
If price continues its upward momentum from the bounce near 201.3 (support zone) and breaks above the cloud:
First target: 203.20 (top of the cloud / minor resistance)
Second target (main): 204.30 – 204.40 (the top of my marked range)
📉 Invalidation / Stop-loss idea
If price falls back below 201.70 – 201.50, that would invalidate the bullish setup and could signal another test of the green support zone.
Summary
Buy zone: Above 202.20–202.30 (confirmation above Tenkan/Kijun lines)
Target 1: 203.20
Target 2: 204.30–204.40
Stop-loss: 201.50

SOL/USDT (1H timeframe)...SOL/USDT (1H timeframe):
Here’s a clear technical breakdown 👇
🧭 Chart Overview:
Current price: around $200.40
Trend: Uptrend, but showing short-term pullback
Support area: $190 – $195
Resistance area: $205 – $210
🔍 Key Observations:
The ascending trendline is acting as dynamic support.
Price recently rejected near the $210 resistance zone and is pulling back toward the trendline and Ichimoku cloud.
The target points marked on my chart suggest downside retracements if support breaks.
---
🎯 Target Levels:
If price stays above the trendline/support → bullish continuation:
Target 1: $207
Target 2: $212
Target 3: $220 (major breakout target)
If price breaks below the trendline/cloud support → bearish correction:
Target 1: $195 (short-term support / first target point)
Target 2: $188 (lower target zone marked on chart)
Target 3: $180 (major downside target if correction deepens)
---
⚠ Summary:
📈 Bullish scenario: Hold above $198 → move to $207–$212.
📉 Bearish scenario: Break below $198 → drop to $195 → $188.

USD/CAD (3H timeframe) chart...USD/CAD (3H timeframe) chart 👇
🧭 Chart Overview:
Current price: ≈ 1.3979
Trend: Bearish breakdown from support and trendline.
Price has cleanly broken below both the ascending trendline and Ichimoku cloud, confirming a downside continuation.
---
🔍 Key Technical Details:
The previous support zone (1.4010–1.4040) has turned into resistance.
Momentum is bearish after retesting that area and rejecting it.
Two target points are clearly marked on my chart.
---
🎯 Target Levels:
If bearish momentum continues 👇
Target 1: 🟢 1.3900 — first major support / first target
Target 2: 🟢 1.3730–1.3750 — second major target zone (full extension of breakdown)
---
⚙ Trade Setup Suggestion:
Entry (Sell): Below 1.3980 (confirmation of continuation)
Stop Loss: Above 1.4045 (above broken support)
Take Profit 1: 1.3900
Take Profit 2: 1.3730
---
⚠ Summary:
📉 Structure = Bearish
🎯 Targets = 1.3900 → 1.3730
🔄 Resistance = 1.4010–1.4040 (sell zone if retested)

chart for GBP/JPY...chart for GBP/JPY. Based on what I’m seeing + recent technicals, here’s a target-zone scenario for my. Remember: this is a probabilistic view, not a guarantee — set my risk accordingly and use a stop.
---
🔍 Current technical context
GBP/JPY is hovering around ~ 203.0-203.5 (per recent data).
There is resistance near ~ 205.30 according to one analysis.
On the downside, support is referenced around ~ 200.67 or ~ 197.47 in one view.
The pair’s trend signals show a generally bullish macro trend, though short-term momentum might be weakening.
---
🎯 Target zones
Given my chart shows a break of a trendline (uptrend) and a move lower, here are two plausible targets depending on how the move unfolds:
If a bearish move continues (i.e., break of support around ~ 200.6) → A target around 197.50-198.00 is reasonable.
If the price instead holds support and bounces/reverses → A target near or above the resistance around 205.30-207.00 becomes possible.
---
✅ My preferred “play” based on my setup
Since my chart shows a breakdown of an ascending trendline, I lean toward the bearish target path:
Entry: At current ~ 203.0 area (assuming my chart confirms the break).
Stop-loss: Just above the recent high / trend‐line (say ~ 205.50) to manage risk.
Target: ~ 197.50-198.00 (gives about 5-6 points of drop from current).
Risk-reward: Check how many pips my risking vs this target — ensure the reward is larger than the risk.
---
⚠ Things to watch
If price breaks back above ~ 205.30 with good momentum, the bearish scenario is invalidated and my need to pivot.
Macroeconomic/fundamental events (e.g., UK or Japan monetary policy) can blow this setup either way — be aware.
The move to 197.50 might not be smooth — there may be bounces, retests of broken trendline, etc.
---
If you like, I can plot multiple target-levels (e.g., near‐term, mid-term, and stretch) on my exact chart timeframe (1-hour) and we can mark stop and risk-zones.

Gold Struggles at 4000: Managing Longs in Corrective PhaseYesterday's session brought some disappointment for the bulls as gold tested the psychological 4000 level but failed to sustain above it on the larger timeframes. After reaching a high around 4028, we saw sellers step in with conviction, leading to a breakdown of the ascending trendline that had been supporting the recent recovery attempt. The rejection at these levels was swift, and now we're trading back at lower levels, which puts the immediate bullish case on hold for the time being.
For today's trading session, the CPR range positioned between 3943-3968 represents the intraday battleground. This zone is now acting as resistance, and bulls will need to prove themselves here if they want to regain any meaningful momentum. To shift the current selling sequence and get back into control, price needs to reclaim the broken trendline support and more importantly, break above yesterday's high at 4028. Until that happens, the path remains to the downside, and we need to respect what the market is telling us for current short term structure.
On the support side, the 3880-3900 zone that we have to watch and losing control here could open the door for more corrections toward lower levels and can make attempt towards 3850 (50% Fib Level).
From a fundamental perspective, we're also dealing with some interesting cross-currents. The China-US trade deal developments are currently providing some headwinds for gold, giving short-term sellers additional reasons to press their advantage. However, zooming out to the bigger picture, yesterday's Federal Reserve decision to cut rates by another 25 basis points and signal the end of Quantitative Tightening is structurally bullish for gold over the medium to long term. This transition to monetary easing typically creates a favorable environment for precious metals.
As for my positioning, I'm continuing to manage my existing long positions. My broader view remains to buy the dip because the longer-term structure still favors the bulls. These short-term corrections, while uncomfortable, are part of the journey in trending markets. The key is staying patient and not getting shaken out by near-term volatility when the fundamental and structural backdrop remains supportive.

Gold Breaks Trendline: 4000 Back in FocusYesterday's trading session brought further downside pressure as gold pushed lower to test the 3880 zone, which is just above the monthly open. We have seen a decent recovery bounce from there, suggesting some buying interest is emerging at these lower levels. However, it's important to maintain perspective here while we're seeing short-term stabilization, the reversal signs on higher timeframes haven't materialized yet. We need to see more convincing price action and stronger closes on the larger timeframes before we can confidently call this as reversal to bullish case.
Also today we have extremely narrow CPR positioned at 3954. When we see such tight CPR levels, it often signals either an impending trend reversal or the potential for a high volatility session ahead. The early Asian session has already given us something to work with price is attempting to reclaim this CPR zone, which is a constructive development. Adding to the bullish case, we've also seen a breakout from the descending trendline structure that had been capping rallies over the past few sessions.
From a tactical perspective, the immediate support zone to monitor is 3900-3910.... If buyers can defend and sustain price action above this level, we could see gold make an attempt toward the first meaningful hurdle at 4000-4010. This target zone is particularly significant as it aligns with today's R1 pivot and the prior week's low, creating a confluence resistance area. A daily close above 4000-4010 would be an encouraging sign that momentum is genuinely shifting back in favor of the bulls and could open the door for further upside.
As for my positioning, I'm maintaining my existing buy positions and continuing to manage them as the price action develops. The risk-reward from these levels still appears favorable given the technical setup unfolding.

XAU/USD Completing Wave Y: Final Dip Before RallyGold has completed its major 5-wave rise and is now finishing a corrective W-X-Y pattern. The recent drop looks like the final leg of this correction, meaning sellers are getting weaker. Price may show a small bounce up and then one last dip to complete the correction. After that final drop, a strong new uptrend is expected to start again. In short: correction ending soon, last dip big bullish move ahead.

GBP/USD – 1H Chart...✅ Clear Technical Target Zones (GBP/USD – 1H Chart)
Target Price Zone Why it matters
TP1 1.3420 – 1.3440 Nearest major resistance + previous structure level + matches my first marked target
TP2 1.3485 – 1.3500 Next resistance zone + matches my upper target line + psychological round number
---
⚠ Levels to Watch Below (Support)
Support Zone Why
1.3325 – 1.3340 Kumo (cloud) support + breakout retest zone
If price falls back into the cloud, momentum could weaken. If it stays above the breakout, bullish continuation remains valid toward TP2.
---
Quick Plan (Based on the chart only)
✅ If price pushes above 1.3420 → TP2 becomes more likely
⚠ If price rejects at 1.3420 → retracement is likely first
---
If you want, I can help my refine: ✅ Stop-loss zone
✅ Risk-to-reward
✅ Confirmation signals (Ichimoku + price action combo)

USD/JPY pair and asking for a target...USD/JPY pair and asking for a target, here’s what the technicals suggest — but keep in mind: this is not financial advice — my responsible for my trades.
---
✅ What the technicals are showing
The pair is trading above its 50-week SMA, which suggests a longer-term bullish tilt.
A key resistance level is around 153.26. A breakout above that opens the way to higher targets.
If the breakout happens, one target cited is 158.80 (via a 161.8% projection).
On the flip side, if support fails (specifically ~145.47), the bullish case weakens.
---
🎯 My suggested target
Primary target: ~ 158.80 — with the caveat that my need a clean breakout above ~153.26 to justify it.
Alternate scenario: If the pair fails to break convincingly and support breaks ~145.47, the target becomes a drop toward the support zone instead.
---
🧠 Things to watch / trade‐management points
Confirm breakout: Look for a daily / 4-hour close above ~153.26 and increased momentum.
Risk management: If my entering now, consider placing your stop-loss below support (e.g. 145-147 zone) because a break there weakens the scenario.
Measure rewards vs risk: If my risk is large (large stop), the target must justify it.
Be aware of fundamentals: Events from the Bank of Japan (BOJ) or Federal Reserve (Fed) can shift this quickly.

Silver Futures (MCX) 4-hour chart Silver Futures (MCX) 4-hour chart, and my marked a resistance zone and a downward breakout below the Ichimoku cloud and key support.
Here’s what I can interpret:
Price broke below the Ichimoku cloud, confirming a bearish trend.
There’s a clear resistance area around ₹151,000–₹153,000.
The breakdown happened below the ₹145,000–₹146,000 level.
My marked a target zone below, with a downward arrow.
✅ Likely Target Projection
Using standard technical projection (height of range = target distance):
Resistance zone top: ~₹153,000
Breakdown zone: ~₹145,000
Height: ₹8,000
If we subtract that from the breakdown area:
Target = 145,000 – 8,000 = ₹137,000
🎯 Estimated Short-term Target:
₹137,000 – ₹138,000
This aligns with my chart’s “target point” mark.
If you want to be more precise, you could:
Watch for support around ₹140,000, which might give a bounce.
If that breaks, next major support zone = ₹136,000–₹137,000.

Gold Under Pressure: Critical Support Lost, 4040 Reclaim Needed Yesterday's session provided clear confirmation of the bearish pressure building in gold as price faced strong resistance around the CPR area between 4094-4108. The early Asian session rejection was particularly telling, as buyers simply couldn't get enough strength to push through this zone. What followed was a decisive breakdown below the psychologically important 4000 level, which had been acting as major support throughout the recent price action.
For today's session, CPR zone positioned at 4001-4040. This is now our critical battleground. Bulls need to reclaim at least 4040 (CPR TC) to suggest any meaningful recovery is underway. Without a clean breakout above this level, the path of least resistance remains to the downside, and bears are firmly in control of the near-term direction. The current price structure suggests sellers are gaining confidence, especially after yesterday's breakdown.
On the downside, the first intraday support level for today is to watch at 3933. This could provide a temporary bounce zone if we see continued selling pressure. However, given the momentum shift and the loss of 4000 support, we need to approach any long positions cautiously here. The market is clearly favoring the bears at this point, and it would take a significant shift in sentiment to change that dynamic in the immediate term.
My Position : I am still managing my buy entries and currently in floating loss ,max extension that I am expecting in lower side is at around 3800-50 area and that is manageable as per my current lot sizing.

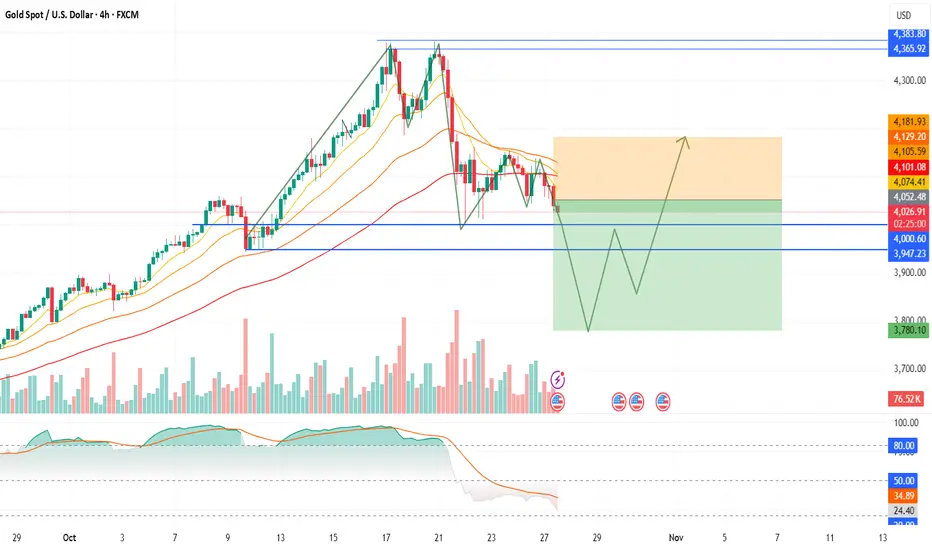
Dual-phase trading — shorting the drop, then switching to long Gold is currently trading near $4,040, and my short-term outlook is bearish, followed by a strong bullish reversal in the coming sessions.
I expect prices to decline first toward the $3,800–$3,750 zone, which aligns with key support and previous demand levels. This correction phase would complete a healthy market reset before a potential major rally begins.
Once price stabilizes around $3,800, I anticipate a sharp reversal and breakout move toward $4,200+, possibly extending higher if momentum builds.
📊 My Plan:
Bias: Bearish first → then Bullish
Short-Term Target: $3,800–$3,750
Reversal Zone: Accumulate longs near $3,800
Upside Target: $4,200+
Invalidation: Below $3,740 (on 4H closing)
This setup favors patience and dual-phase trading — shorting the drop, then switching to long for the rebound.
XAU/USD (Gold) chart on the 3-hour timeframe...XAU/USD (Gold) chart on the 3-hour timeframe, I can see my using the Ichimoku Cloud and have marked a range with a potential breakdown area and a target point already indicated on the chart.
Here’s what the chart suggests:
Current price: around 4031 USD
Range low (support): around 4030 USD (which is currently being tested)
Range high (resistance): around 4190–4200 USD
Breakdown target (measured move): around 3940–3950 USD
📉 Analysis:
Price has broken below the range box, indicating a bearish breakout.
The Ichimoku Cloud ahead is bearish and thick, showing potential resistance.
A measured move from the height of the range (≈ 150–170 points) projects downward to around 3940–3950 USD.
My chart already marks 3944.299 as the target point, which aligns well with this projection.
✅ Target Summary
Type Level (USD) Comment
Short-term target 3,944 Measured move target after range breakdown
Extended target 3,900–3,880 Possible continuation if bearish momentum sustains
Invalidated above 4,090–4,100 If price re-enters the range and closes above the cloud

XAU/USD – 15-Minute Timeframe Analysis (Short Bias)Market Overview
Following the latest round of China–U.S. trade negotiations, market sentiment has shifted toward a more risk-on environment, reducing demand for safe-haven assets such as gold. As optimism surrounding the talks strengthens the U.S. dollar, gold prices have continued to decline during the Asian and early European sessions.
Technical Outlook
On the 15-minute timeframe, XAU/USD maintains a clear short-term bearish structure, characterized by consecutive lower highs and lower lows. The pair is currently trading below key moving averages, reinforcing the prevailing downward momentum.
A potential retracement toward intraday resistance could present a favorable opportunity for short positions, provided that bearish price action confirms rejection at that level.
Key Resistance: 2360 – 2365 zone (previous support turned resistance)
Immediate Support: 2348 – 2350 zone
Extended Support Target: 2338 – 2340