GOLD 03/09: TIME TO SELL, WHERE TO BUY TODAY?1. Overall Analysis
Elliott Wave:
Wave (5) seems to have completed, signalling a possible distribution phase.
The market is likely moving into an ABC corrective structure, with Wave A expected to retrace to key Fibonacci levels before a Wave B rebound.
Smart Money Concept (SMC):
The Break of Structure (BOS) is confirmed.
There’s a Fair Value Gap (FVG) around the 3,500 level, which price may revisit to fill.
The CP Order Buy Zone near 3,485 indicates a strong liquidity area for potential medium- to long-term buying opportunities.
2. SELL Plan
SELL Zone: 3,550 – 3,552
Stop Loss (SL): 3,558
Take Profit (TP):
TP1: 3,526 (Fib 0.266 – short-term target)
TP2: 3,517 (Fib 0.382 – first support level)
TP3: 3,508 – 3,506 (BUY SCALP/FVG zone)
Logic:
Price has completed Wave 5, forming a distribution zone.
Smart Money may sweep liquidity around 3,550 before pushing the price down to test the FVG levels.
3. BUY SCALP Plan
BUY Zone: 3,508 – 3,506 (aligning with the FVG)
Stop Loss (SL): 3,499
Take Profit (TP):
TP1: 3,526 (Fib 0.266 retracement)
TP2: 3,540 (previous reaction level)
Logic:
This zone lines up with an unfilled FVG and the 0.5–0.618 retracement levels of the last leg.
If price holds its bullish structure here, Wave B could stage a strong rebound.
4. Medium-Term BUY Zone
CP Order Buy Zone: Around 3,485
Logic:
This area acts as a major liquidity pool, often targeted by Smart Money.
If price breaks below 3,506, this level could be the next key spot for medium-term accumulation, with an eye on a Wave C move back toward 3,550+.
5. Main Scenarios
Primary Setup:
Look for a SELL entry at 3,550 – 3,552 with SL at 3,558, and scale out profits at support levels.
Watch for a BUY SCALP setup in the 3,508 – 3,506 range if bullish confirmation appears.
Alternate Setup:
If price dips below 3,506 and keeps falling, wait for confirmation at 3,485 to build a medium-term long position.
6. Risk Management
Always place tight stop-losses for each setup.
For SELL trades: lower your position size during high-impact news events.
For BUY SCALP trades: only enter after confirmation signals, such as a pin bar, engulfing candle, or a minor structure break on the M5/M15 charts.
Goldshort

Gold SPOT XAUUSD SHORT idea at 3469 after 23 July 2025GOLD XAUUSD Short idea : Trade will activate on 23 July 2025 ..Gold Should Short from 3469

Gold SMC Playbook 25/08 – Liquidity Hunt at 3400 & 3325Market Context (SMC Perspective)
Price is consolidating near 3367 after a strong impulsive move upward and is currently reacting around a minor resistance area.
Clear ChoCH and BOS patterns indicate bullish intent on the H1 timeframe; however, liquidity pools still lie below 3343 and 3325 (buy-side liquidity).
Imbalance zones spotted: 3343–3341 and a deeper order block zone around 3325–3323.
Key Levels
Resistance (Supply): 3372 – 3382 – 3389
Support (Demand): 3350 – 3342 – 3325
SMC Bias: Mixed – Opportunities to Play Both Long & Short Around Liquidity
🔴 SELL Scenario (Short-Term Liquidity Grab)
Entry: 3400 – 3403 (above local liquidity sweep)
Stop Loss: 3408
Targets:
TP1: 3390 (partial)
TP2: 3380
TP3: 3370
TP4: 3360 (opens 3350 liquidity zone)
Rationale: Expecting a sweep above 3400 into supply, followed by mitigation and a sell-off.
🟢 BUY Scenario (Bullish Continuation from Demand OB)
Entry 1 (Scalp Buy): 3343 – 3341 (reactive zone), SL 3337
Entry 2 (Main OB): 3325 – 3323 (strong OB), SL 3319
Targets:
TP1: 3330
TP2: 3340
TP3: 3350
TP4: 3370 (opens 3390 liquidity)
Rationale: Price may retrace below 3340 to fill imbalance and mitigate the 3325 OB before the next bullish leg.
Execution Plan (SMC Flow):
Wait for a liquidity sweep at highs or lows (above 3400 or below 3325) with proper confirmation.
Look for ChoCH and BOS signals on LTF (M5–M15) around OB zones for entry confirmation.
Trail stop loss after TP1 is hit; take partial profits and hold the remaining position toward the final liquidity target.

XAUUSD | Techinical Analysis for 08/06/2025Hi,
The next possible move in gold can be downside after a small bounce till 3378 to 3382. The move can go upto 3370, 3365, 3360.
Disclaimer: This is only for educational purpose.
Thanks

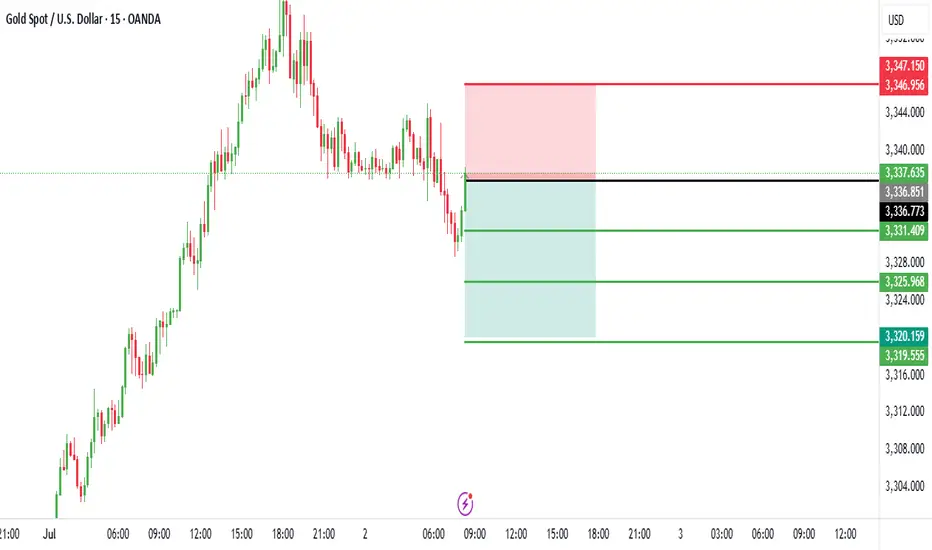
Trading Analysis for Gold Spot / U.S. Dollar (15-Minute Chart)Based on the provided 15-minute chart for Gold Spot / U.S. Dollar (XAU/USD) and the specified data, here’s a suggested trading setup for a sell position:
Current Price and Trend: The current price is not explicitly provided, but the entry price is set at 3,336.00. The chart suggests a potential resistance zone near this level, with a recent uptrend showing signs of exhaustion.
Sell Entry: Enter a sell position at 3,336.00, aligning with the specified entry price where the price may face rejection due to resistance.
Stop Loss: Place a stop loss at 3,346.00, above the recent high, to protect against an upward breakout. This level is 10.00 points above the entry, defining the risk.
Take Profit Levels:
Take Profit 1: 3,331.00, a conservative target 5.00 points below the entry.
Take Profit 2: 3,326.00, a mid-range target 10.00 points below the entry.
Take Profit 3: 3,321.00, a deeper target 15.00 points below the entry, aligning with a potential support zone.
Price Action: The chart indicates a peak near the entry level, with a bearish reversal signal suggested by the candlestick pattern and resistance line.
Risk-Reward Ratio: The distance to the stop loss (10.00 points) compared to the take profit levels (5.00 to 15.00 points) offers a mixed risk-reward profile. Take Profit 2 and 3 provide a 1:1 and 1:1.5 ratio, respectively, making this a balanced short-term trade.
Conclusion
Enter a sell at 3,336.00, with a stop loss at 3,346.00 and take profit levels at 3,331.00, 3,326.00, and 3,321.00. Monitor the price action for confirmation of a downtrend, and be cautious of a potential upward move if the price breaks above the stop loss level.
Trading Analysis for Gold Spot / U.S. Dollar (15-Minute Chart)
Based on the provided 15-minute chart for Gold Spot / U.S. Dollar (XAU/USD) and the specified data, here’s a suggested trading setup for a sell position:
Current Price and Trend: The current price is not explicitly provided, but the entry price is set at 3,336.00. The chart suggests a potential resistance zone near this level, with a recent uptrend showing signs of exhaustion.
Sell Entry: Enter a sell position at 3,336.00, aligning with the specified entry price where the price may face rejection due to resistance.
Stop Loss: Place a stop loss at 3,346.00, above the recent high, to protect against an upward breakout. This level is 10.00 points above the entry, defining the risk.
Take Profit Levels:
Take Profit 1: 3,331.00, a conservative target 5.00 points below the entry.
Take Profit 2: 3,326.00, a mid-range target 10.00 points below the entry.
Take Profit 3: 3,321.00, a deeper target 15.00 points below the entry, aligning with a potential support zone.
Price Action: The chart indicates a peak near the entry level, with a bearish reversal signal suggested by the candlestick pattern and resistance line.
Risk-Reward Ratio: The distance to the stop loss (10.00 points) compared to the take profit levels (5.00 to 15.00 points) offers a mixed risk-reward profile. Take Profit 2 and 3 provide a 1:1 and 1:1.5 ratio, respectively, making this a balanced short-term trade.
Conclusion
Enter a sell at 3,336.00, with a stop loss at 3,346.00 and take profit levels at 3,331.00, 3,326.00, and 3,321.00. Monitor the price action for confirmation of a downtrend, and be cautious of a potential upward move if the price breaks above the stop loss level.
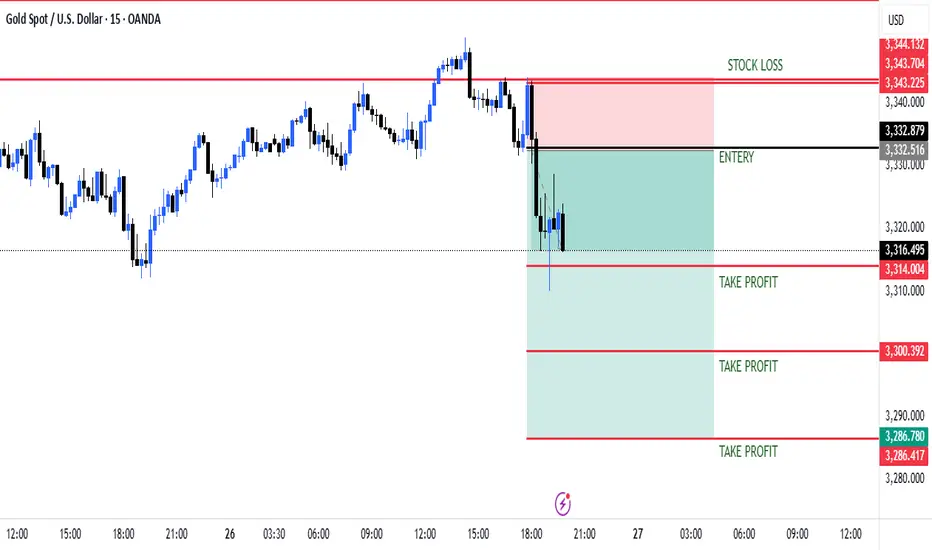
Trading Analysis for Gold Spot / U.S. Dollar (15-Minute Chart)
Based on the provided 15-minute chart for Gold Spot / U.S. Dollar (XAU/USD), published by NaviPips on TradingView.com on June 26, 2025, at 19:52 UTC, here’s a suggested trading setup for a sell position:
Current Price and Trend: The current price is 3,318.835, with a slight decline of -3.610 (-0.11%). The chart shows a recent uptrend that appears to be exhausting near the current level, suggesting a potential reversal point.
Sell Entry: Enter a sell position at 3,332.879 (near the entry level marked), as it aligns with a resistance zone where the price has peaked and started to decline.
Stop Loss: Place a stop loss at 3,343.704, above the recent high, to protect against an upward breakout. This level is approximately 10.825 points above the entry, defining the risk.
Take Profit Levels:
Take Profit 1: 3,314.004, a conservative target about 18.875 points below the entry.
Take Profit 2: 3,300.392, a mid-range target approximately 32.487 points below the entry.
Take Profit 3: 3,280.417, the furthest target, about 52.462 points below the entry, aligning with a strong support zone.
Price Action: The chart indicates a recent peak followed by a downward move, with the entry level near the resistance. The red and green zones suggest a bearish continuation from this point.
Risk-Reward Ratio: The distance to the stop loss (10.825 points) compared to the take profit levels (18.875 to 52.462 points) offers a favorable risk-reward ratio, ranging from approximately 1:1.7 to 1:4.8.
Conclusion
Enter a sell at 3,332.879, with a stop loss at 3,343.704 and take profit levels at 3,314.004, 3,300.392, and 3,280.417. Monitor the price action for confirmation of a continued downtrend, and be cautious of a potential reversal if the price breaks above the stop loss level.
Trading Analysis for Gold Spot / U.S. Dollar (15-Minute Chart)Based on the provided 15-minute chart for Gold Spot / U.S. Dollar (XAU/USD), published by NaviPips on TradingView.com on June 25, 2025, at 12:28 UTC, here’s a suggested trading setup for a sell position:
Current Price and Trend: The current price is 3,331.315, with a slight decline of -1.390 (-0.04%). The chart shows a recent downtrend with a potential resistance zone near the current price.
Sell Entry Options:
1st Entry: Enter a sell position at 3,355.490, aligning with the upper resistance level marked, where the price may face rejection.
2nd Entry: Enter a sell position at 3,344.221, a secondary resistance level if the price retraces slightly.
Stop Loss: Place a stop loss at 3,357.831, above the recent high, to protect against an upward breakout. This level is approximately 2.341 points above the 1st entry and 13.610 points above the 2nd entry, defining the risk.
Take Profit Levels:
Take Profit 1: 3,325.242, a conservative target about 30.248 points below the 1st entry and 18.979 points below the 2nd entry.
Take Profit 2: 3,316.079, a mid-range target approximately 39.411 points below the 1st entry and 28.142 points below the 2nd entry.
Take Profit 3: 3,304.625, a deeper target about 50.865 points below the 1st entry and 39.596 points below the 2nd entry.
Take Profit 4: 3,286.474, the furthest target, approximately 69.016 points below the 1st entry and 57.747 points below the 2nd entry.
Price Action: The chart indicates a downtrend with a recent bounce that may be exhausting near the 1st and 2nd entry levels. The 1:2 risk-reward ratio zone suggests a potential reversal point.
Risk-Reward Ratio: .
For the 1st entry (3,355.490), the stop loss to Take Profit 4 distance (69.016 points) offers a 1:2 risk-reward ratio with Take Profit 2 (39.411 points).
For the 2nd entry (3,344.221), the stop loss to Take Profit 4 distance (57.747 points) also aligns with a favorable risk-reward profile.
Conclusion
Option 1: Sell at 3,355.490 with a stop loss at 3,357.831 and take profit levels at 3,325.242, 3,316.079, 3,304.625, and 3,286.474.
Option 2: Sell at 3,344.221 with a stop loss at 3,357.831 and the same take profit levels. Monitor the price action for confirmation of a reversal at the entry levels, and be cautious of potential bullish momentum if the price breaks above the stop loss.

GOLD FALL, FOR GOLD !!!!!As per my technical analysis, GOLD will fall more from here.
I mean go and see the charts, if the daily candle closes below the red line(3293 $) at Friday end.
Then I am looking for gold to touch 3121$ area which is the next support or liquidity area.
You can swing the price of gold towards that. Maybe you can make good money from that.
If price reject from this red line(3293$) and closes above it means that's a different story,
I will share it on Monday or Tuesday next week.
It's all my own view. I think the gold is faaaaaaalling for a short time.

Trading Analysis for Gold Spot / U.S. Dollar (15-Minute Chart)Based on the provided 15-minute chart for Gold Spot / U.S. Dollar (XAU/USD), published by NaviPips on TradingView.com on June 25, 2025, at 03:52 UTC, here’s a suggested trading setup for a sell position:
Current Price and Trend: The current price is 3,322.840, with a slight decline of -0.190 (-0.01%). The chart shows a recent downtrend with a potential resistance level near the current price.
Sell Entry: Enter a sell position at 3,323.400 (near the current price and entry level marked), as it aligns with a resistance zone where the price has struggled to break higher.
Stop Loss: Place a stop loss at 3,357.864, above the recent high, to protect against an upward breakout. This level is approximately 34.464 points above the entry, defining the risk.
Take Profit Levels:
Take Profit: 3,286.372, a target about 37.028 points below the entry, aligning with a support zone and offering a 1:1 risk-reward ratio as indicated on the chart.
Price Action: The chart indicates a downtrend with a recent bounce that may be exhausting near the current level. The horizontal dashed line suggests a resistance area, supporting a sell setup.
Risk-Reward Ratio: The distance to the stop loss (34.464 points) compared to the take profit (37.028 points) provides a balanced 1:1 risk-reward ratio, making this a reasonable short-term trade.
Conclusion
Enter a sell at 3,323.400, with a stop loss at 3,357.864 and a take profit at 3,286.372. Monitor the price action for confirmation of a continued downtrend, and be cautious of potential reversals if the price breaks above the stop loss level.

WE ARE GOING TO SHORT GOLD BECAUSE IT's GIVING BEARISH MOVE XAUUSD is currently below the 14, 50, and 200 moving averages on the 5-min chart. So, I'm looking to go short after it breaks 3324 (that's the support level). I'll enter the short trade there, with a stop-loss at 3333.

Analysis of Gold Spot / U.S. Dollar (15-Minute Chart)The provided chart for Gold Spot / U.S. Dollar (XAU/USD) on a 15-minute timeframe, published by NaviPips on TradingView.com on June 24, 2025, at 09:19 UTC, outlines a trading setup with the following insights:
Current Price and Trend: The current price is 3,353.510, with a slight decline of -0.425 (-0.01%). The chart shows a recent peak followed by a downward correction, suggesting a potential short-term bearish move.
Entry Level: The entry point is set at 3,358.290, slightly above the current price, indicating a buy opportunity if the price stabilizes or retraces to this level. This aligns with a support zone near the recent low.
Stop Loss: A stop loss is placed at 3,370.362, above the recent high, offering protection against an upward breakout. This level is approximately 12.072 points above the entry, defining the risk.
Take Profit Levels:
Take Profit 1: 3,344.209, a conservative target about 14.081 points below the entry, aligning with a support level.
Take Profit 2: 3,335.002, a deeper target indicating further downside momentum.
Take Profit 3: 3,332.879, the furthest target, suggesting a significant short-term decline if the trend continues.
Price Action: The chart reflects a recent consolidation phase after a peak, with a clear downward move initiating. The setup anticipates continued bearish momentum from the entry level.
Risk-Reward Ratio: The distance to the stop loss (12.072 points) compared to the targets (14.081 to 25.411 points) offers a favorable risk-reward ratio, making this a potentially viable short-term trade.
Conclusion
This setup targets a bearish move from the entry level of 3,358.290 , with defined take-profit levels and a stop loss to manage risk. Traders should watch for confirmation at the entry level and be prepared for potential reversals given the short timeframe and minor price change.

XAU/USD Double Bottom Breakout Bullish Momentum Incoming!🔄 XAU/USD Double Bottom Breakout 💥 | 🚀 Bullish Momentum Incoming!
Analysis:
🟡 Double Bottom Pattern: Two clear lows have formed around the $3,340 support, signaling a potential reversal.
🟦 Accumulation Zone: The price consolidated in a range, indicating strong buying interest before the breakout.
🟣 Bullish Momentum: Recent aggressive bullish candles show strong buying pressure.
📈 Breakout & Retest Zone: If the price holds above $3,370, a bullish continuation toward $3,409 and possibly $3,445 is expected.
🧭 Target Area: Marked with a blue box, the upside potential is clearly projected.
Conclusion:
A successful retest of the breakout level may lead to a strong bullish run. Keep an eye on $3,370 as the pivot zone. 🎯

Insightful Dive into Gold Spot / U.S. Dollar (XAU/USD) 15-MinuteHistorical Flow: The chart tracks the Gold Spot / U.S. Dollar (XAU/USD) price action on a 15-minute timeframe from June 22 to June 24, 2025. The price climbed steadily until around 21:00 on June 23, followed by a noticeable drop, suggesting a potential shift from an upward trend to a corrective phase along a descending trendline.
Key Levels:
Stop Loss: Positioned at $3,382.374 (red line), serving as the upper threshold to exit a short position if the price reverses.
Entry: Marked at $3,370.510 (gray line), indicating the optimal entry point for a short trade near the trendline break.
Target 1: Set at $3,365.880 (green line), the initial profit-taking level below the entry.
Target 2: Aimed at $3,346.664 (green line), offering a deeper profit zone.
Target 3: Projected at $3,335.066 (green line), the furthest target for the short trade.
Support: The $3,321.57 level (green line) acts as a potential support if the downward move continues.
Recent Price Action: The price reached a high near $3,382.374 and then breached the downtrend line (highlighted with a yellow circle), signaling a shorting opportunity. As of 18:27 UTC on June 23 (11:57 PM IST, June 23, 2025), it has declined to $3,360.330, reflecting sustained bearish momentum.
Projected Movement: The downward trajectory suggests a potential drop to Target 1 at $3,365.880, with possibilities of reaching Target 2 at $3,346.664 and Target 3 at $3,335.066 if the bearish trend holds. A move above $3,382.374 could indicate a bullish reversal.
Volume and Indicators: The chart features Bollinger Bands (O3,360.030 H3,363.990 L3,359.245 C3,360.330) with a -0.240 (-0.01%) change, pointing to low volatility. The trendline break hints at increased selling pressure, though specific volume data is unavailable.
Outlook: This chart supports a shorting strategy with a defined entry and stop loss. The price is currently in a bearish phase following the trendline break, with targets at $3,365.880, $3,346.664, and $3,335.066. Watch for a break above $3,382.374, which could signal a shift to a bullish trend.

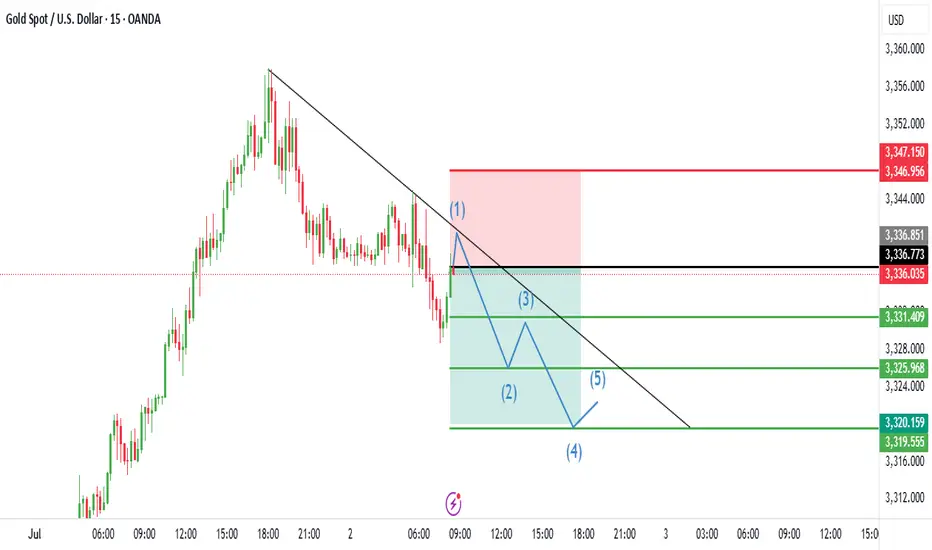
Analysis of Gold Spot / U.S. Dollar (XAU/USD) 15-Minute ChartHistorical Trend: The chart displays the Gold Spot / U.S. Dollar (XAU/USD) price movement on a 15-minute timeframe from June 22 to June 23, 2025. The price experienced a sharp decline from a peak around $3,369.447, followed by a potential reversal pattern.
Key Levels:
Stop Loss: Set at $3,369.447 (red line), indicating the upper limit to exit a short position if the price reverses upward.
Entry: Positioned at $3,362.463 (gray line), marking the entry point for a potential short trade after the peak.
Target 1: $3,353.009 (green line), the first profit-taking level.
Target 2: $3,340.915 (green line), the second profit-taking level.
Target 3: $3,323.157 (green line), the final target for the short trade.
Recent Price Action: The price peaked near $3,369.447 and began a downward move, forming a potential shorting opportunity (labeled 1-5). The chart suggests a bearish pattern with the price breaking below a support level, followed by a retest (2) and continuation downward (3, 4). The current position (5) indicates the price is approaching Target 1.
Projected Movement: The downward projection suggests the price could reach Target 1 at $3,353.009, with potential to hit Target 2 at $3,340.915 and Target 3 at $3,323.157 if the bearish momentum persists. A break above $3,369.447 would invalidate the short setup.
Volume and Indicators: The chart includes Bollinger Bands (O3,362.860 H3,363.070 L3,361.747 C3,362.295) with a -0.615 (-0.02%) change, indicating low volatility. The pattern suggests a momentum shift, though specific volume data is not detailed.
Outlook: The chart outlines a shorting strategy with clear entry and exit levels. The price is currently in a bearish phase, with potential targets at $3,353.009, $3,340.915, and $3,323.157. Monitor for a break above $3,369.447 to reassess the trade, as it would signal a bullish reversal.

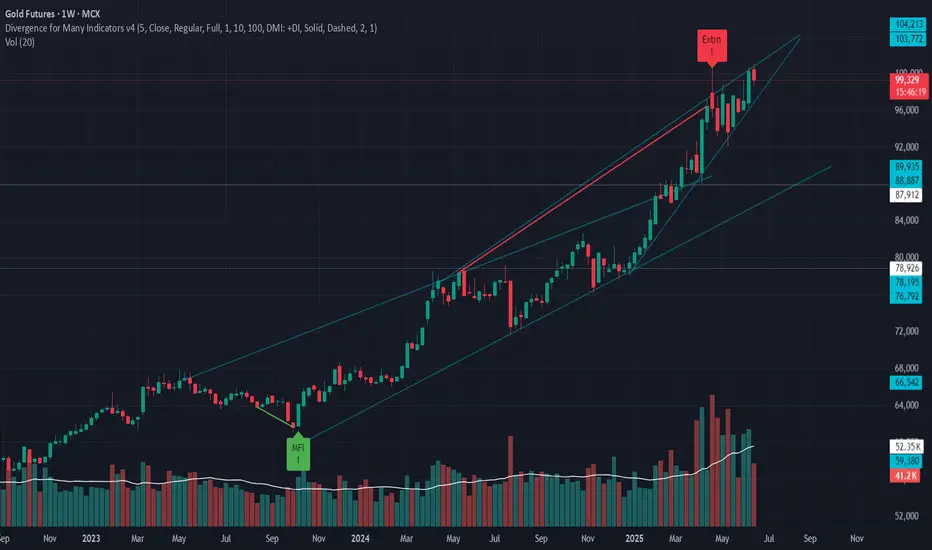
Gold Futures is forming a rising wedge with weakening momentum.
Gold is currently testing a rising trendline on the daily/weekly chart.
A trendline breakdown could signal a shift from bullish to corrective phase.
If the trendline breaks, the structure suggests:
Stop-loss: ₹101,000
Target 1: ₹90,000
Target 2: ₹86,000
This aligns with a potential retracement before the next macro wave (e.g., Fed rate cut cycle or global risk-off).
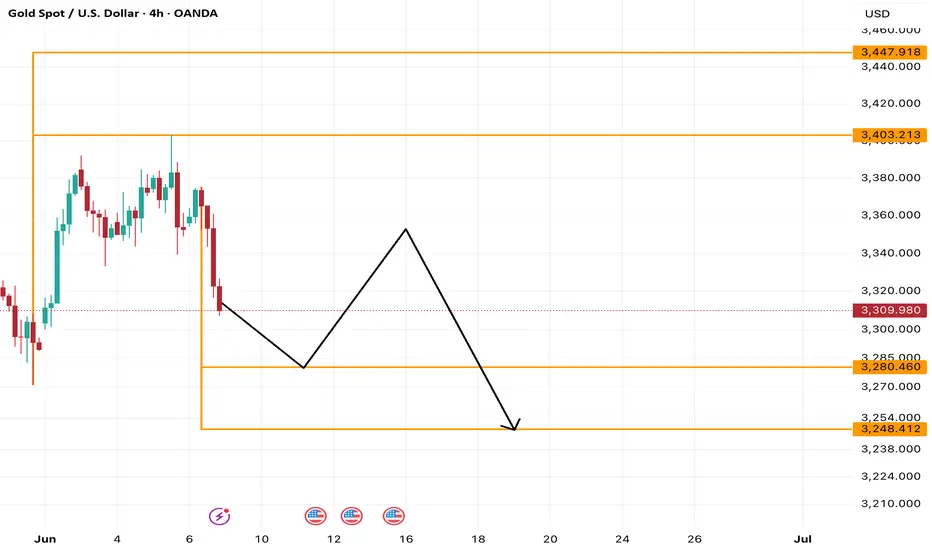
XAUUSD | Weekly Analysis for Week 9 - 13 June 2025Hi,
I am sharing my view on gold movement for coming week. It can go downside upto 3280 and 3248 levels.
Disclaimer: This is only for educational purpose.
Thanks
Gold (XAU/USD) Trade Plan – Daily TimeframeGold ( FXOPEN:XAUUSD ) has finally broken below the lower boundary of the rising channel after a strong bullish rally that peaked above $3,450. Today's bearish candle closed below the trendline support, indicating potential short-term weakness.
🔍 Technical Highlights:
Breakdown from Rising Channel
Price has broken below the lower channel, hinting at a short-term reversal or deeper pullback.
Immediate Support Zones
Watch the horizontal zones around $3,194 and $3,168 – these could act as short-term supports.
Further Downside Targets
If these levels break, next major supports lie at $3,055 and $2,972.
💡 Trade Ideas:
Bearish Bias Below $3,220
Look for short entries if price retests and rejects the lower channel boundary.
Target Levels: $3,168 > $3,055 > $2,972
Invalidation: Daily close back above $3,250 would negate the bearish setup.
⚠️ Risk Management:
Always manage risk with stop-loss orders and proper position sizing. Volatility remains high, so wait for confirmation candles or retests.

Goldm futures is trying to cool off.as you can see this is a 5-0 pattern from Harmonics trading.
one can enter into this trade with an stoploss of 86953
your target should be at 82820

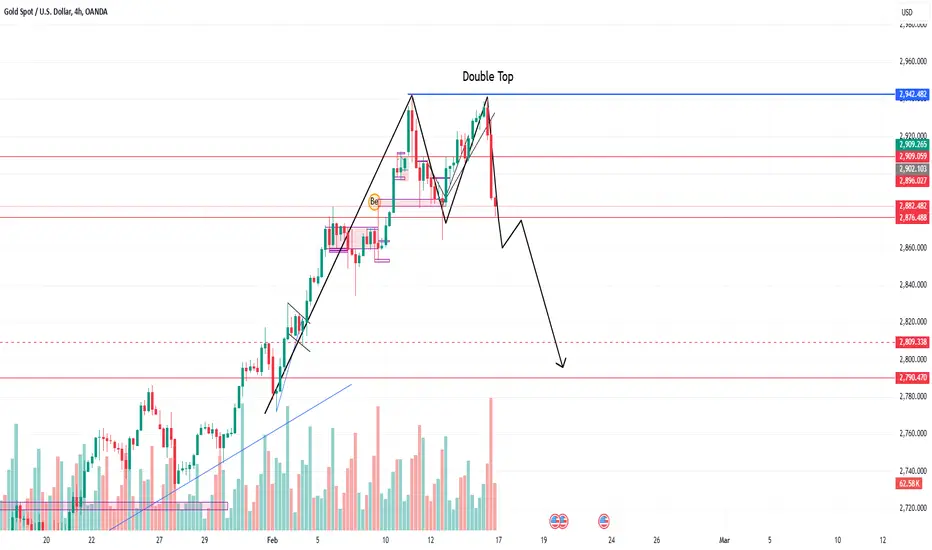
XAUUSD Double Top PatternOANDA:XAUUSD
Hi All, here you can see that XAUUSD has created Double top pattern in 4HR Time frame. so if it breakes down the drawn level we can short and capture some pips.
bearish view | gold | Short TermHi,
Overall looking to the charts and analyzing Elliot wave patterns,
I have this bearish view on gold.. this time i have given time target also..
finger crossed, lets see if we get another opportunity to buy gold at lower levels..

XAUSD [Gold] Short IdeaThe price failed to breach the 2665 supply level and reversed from the high, closing at 2638.
The OANDA:XAUUSD remains in a downtrend, indicating a range-bound trading pattern.
The price is expected to swing down to the 2615 to 2606 range before reversing back to 2665.
Consider going long near the demand zone highlighted in the chart.

Gold in Bearish zone Billow 2636 Price Level According to my Analysis Gold will down approx. 2400 Price Zone in 1-3 months , and then continue its bullish trend .
Billow 2636 Price Level Gold Bearish .
Like 2636 is strong Ressistance .
Lets see what happens (Gold Sell Target 2400 somthing_
