GOLD DIVE—Sniping the $405x Dip Before FOMC!Welcome Traders! Gold (XAU/USD) is correcting sharply, dropping 1.10% towards $4,065. This weakness is driven by trade optimism, but the underlying Fed rate cut expectation keeps our BUY ON DIPS strategy highly profitable!
🧠 MARKET PSYCHOLOGY (MIND)
Bears' Power: Trade optimism is pushing safe-haven assets down. Sellers are targeting the recent uptrend structure.
Bulls' Anchor: Weak US inflation data means a Fed rate cut is almost certain (25 bps expected). This long-term USD weakness acts as a floor for Gold.
Action Bias: BUY THE DIP at critical Fibo supports, anticipating the Fed decision to fuel the next rally.
📊 KEY LEVELS & ACTION ZONES (H1)
We are using the Fibo retracement from the recent high to define our optimal entry points.
🎯 SELL TARGET / CEILING: $4,164.938 (Zone 416x). This is the immediate resistance and the ultimate target for the Long trade.
🔥 HIGH-CONVICTION BUY ZONE: $4,048.493 (Fibo 0.5 Zone 405x). The optimal entry to maximize risk/reward.
Strategy: Wait for a clean tag and H1/M30 reversal signal here.
⚡️ SCALP BUY REACT ZONE: $4,077.605 (Zone 407x). A quick bounce area for aggressive buyers.
❌ INVALIDATION: SL must be placed safely below the 0.618 Fibo level of the 405x zone.
📈 TRADING PLAN SUMMARY (DIP BUY)
Entry Focus: Prioritize the $4,048.493 (405x) Fibo Zone for a high-quality Long entry.
SL Placement: Strict SL below the 0.618 Fibo of the 405x zone.
TP Target: Aim for the recent high at $4,164.938 (416x).
💬 TRADER'S QUESTION
The drop is here! Are you buying the aggressive 407x level or patiently waiting for the optimal 405x Fibo zone before the expected Fed cut rally?
Goldtradingstrategy

Gold Awaits FOMC Breakout While Holding Key Liquidity BaseMarket Overview:
Gold remains trapped in a tight range as traders weigh optimism from US–China trade progress against cautious expectations for the upcoming FOMC meeting.
The macro picture feels balanced: risk sentiment improves, yet the weaker USD and lingering Fed cut expectations quietly support the metal.
In essence, gold isn’t trending — it’s coiling.
Liquidity is being built, not lost.
Every test of 4,050–4,060 shows strong absorption, while short-term sellers are still defending the 4,186–4,260 region.
The market is waiting for a trigger,
and the FOMC might be the one that decides which side breaks first.
Technical Structure (H1)
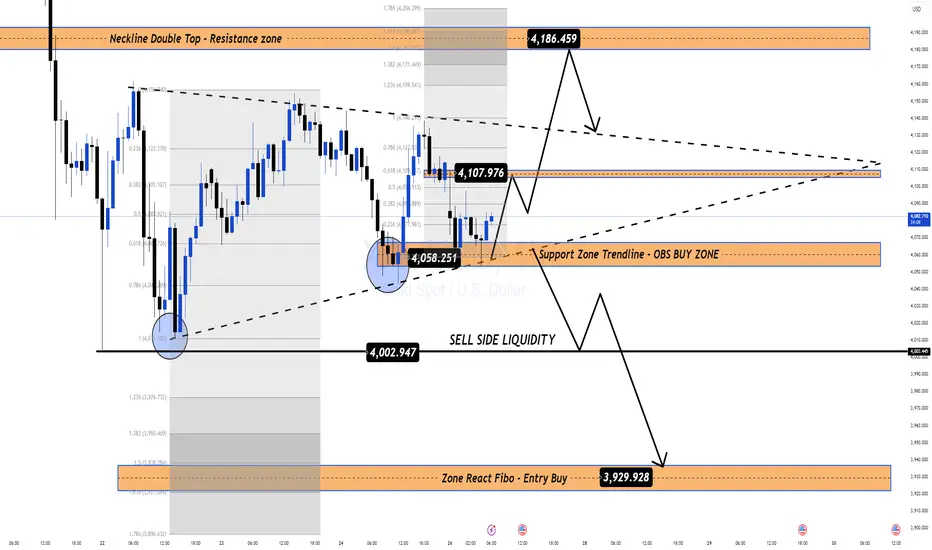
Price continues to respect the ascending support trendline from 4,003 and the neckline resistance near 4,107.
This structure has the DNA of a compression model — narrowing volatility, thinning liquidity, preparing for expansion.
If the support at 4,050 holds, a retest of 4,107 → 4,186 remains likely before the next decision point.
Conversely, a liquidity sweep under 4,002 could form the last dip before a bigger rally unfolds.
Key Structural Levels:
Support / Accumulation Zone: 4,058 – 4,050
Mid-Level Pivot / Neckline: 4,107
Upper Supply Zone: 4,186 – 4,260
Deep Liquidity Pool: 4,002 – 3,930
MMFLOW Perspective:
For now, gold is accumulating energy — this is not a breakout market, it’s a build-up market.
Price action above 4,050 still favours the bulls, but conviction will only return once we see a clean break beyond 4,186.
Ahead of FOMC, patience is strategy.
The next wave won’t come from guessing policy —
it’ll come from reading the flow once volatility hits.
Summary:
Gold’s structure remains stable — liquidity is concentrated below 4,050, and compression continues within the 4,060–4,186 band.
Bias stays neutral-to-bullish as long as the liquidity base holds.
📊 What’s your take?
Will the FOMC spark the breakout, or is gold just reloading for the next wave?
👉 Follow MMFLOW TRADING for institutional flow analysis and smart money structure updates.
Gold Rebounds as CPI Cools and USD WeakensMarket Overview:
Gold has regained bullish traction after the latest US CPI report showed softer inflation data, leading to a weaker USD and renewed buying across metals.
CPI figures came in below market expectations (Core CPI 0.2% vs 0.3%, CPI m/m 0.3% vs 0.4%, CPI y/y 3.0% vs 3.1%), signalling lower inflation pressure and reinforcing bets that the Fed will stay dovish heading into November.
As a result, gold bounced strongly from the 4,050–4,058 support zone, reclaiming key structure levels and stabilising above 4,100 USD/oz.
Market sentiment remains risk-sensitive, but the short-term tone favours further upside correction, as long as gold holds above the trendline and liquidity support zones highlighted on the chart.
Technical Outlook (H2):
The market structure suggests gold has completed its correction phase and is attempting to form a new bullish leg.
Price action shows a clean rejection at the 4,050 liquidity base, and the next immediate objectives are the 4,211 neckline and 4,260–4,342 supply zones.
Key Technical Levels:
Support / Buy Zone: 4,058 – 4,002
Liquidity Sweep Zone: 3,930 – 3,940
Resistance / Neckline: 4,211
Sell Zone Reaction Fibo: 4,260 – 4,342
Trading Plan – MMFLOW View
🔹 BUY Zone #1 (Continuation Play)
Entry: 4,058 – 4,050
Stop Loss: 4,035
Take Profit: 4,155 → 4,211 → 4,260
🔹 BUY Zone #2 (Liquidity Sweep Scenario)
Entry: 4,002 – 3,930
Stop Loss: 3,915
Take Profit: 4,058 → 4,155 → 4,211
Ideal setup if price retests liquidity before CPI-induced recovery continues.
🔹 SELL Zone(Reaction Trade)
Entry: 4,260 – 4,342
Stop Loss: 4,355
Take Profit: 4,211 → 4,100 → 4,058
Weekly Bias & Summary:
With CPI cooling and the USD losing momentum, gold’s structure points to a recovery phase, possibly extending into Wave III of the medium-term cycle.
However, the 4,211 neckline remains the key pivot — a breakout above this zone could trigger momentum extension toward 4,260–4,340, while a rejection may result in another range-bound pullback.
🟡 MMFLOW Bias: Bullish while above 4,050 — dips remain opportunities to buy.
Macro tone favours risk-on rotation, supporting gold’s upside into next week.
📊 Do you think gold will break 4,211 for the next bullish leg, or is another correction incoming before the real move?
👉 Follow MMFLOW TRADING for daily institutional updates and Smart Money Flow structure.

Gold Stuck Near ₹4,100 Ahead of CPIMarket Pulse:
Gold is holding steady around ₹4,100, caught between uncertainty and opportunity as traders brace for the US CPI release and new developments in US–China trade talks.
The yellow metal has paused its recovery from ₹4,050 → ₹4,160, while the US Dollar and bond yields edge higher amid renewed geopolitical tension and surging oil prices.
This is the classic “calm before volatility” moment — the market is simply waiting for data to decide the next wave.
If CPI comes in softer or trade talks disappoint, liquidity could flood back into gold, breaking above ₹4,155–₹4,160 and opening the path toward ₹4,215 → ₹4,261.
But a strong CPI surprise could flip sentiment fast — dragging price back into the ₹4,056 and ₹4,018 buy zones, where the next reaction will decide direction.
📊 Technical Outlook (M30)
Price continues to coil within a tight structure between ₹4,100 – ₹4,155, forming a “spring compression” right below trendline resistance.
Market flow suggests accumulation beneath ₹4,100, hinting that liquidity is building before the next expansion.
Key Structure Zones:
Resistance Pivot: ₹4,154 – ₹4,155 → Key breakout level
Breakout Support (CP Zone): ₹4,056 – ₹4,060
Liquidity Buy Zone: ₹4,018 – ₹4,020
Sell Zone (Fibo Reaction): ₹4,215 – ₹4,261
🎯 Trading Plan – MMFLOW Style
🔹 BUY PLAN – Reaccumulation Base
Entry: ₹4,056 – ₹4,060
Stop Loss: ₹4,045
Targets: ₹4,100 → ₹4,140 → ₹4,155
Focus on reaction candles & liquidity grab confirmation.
🔹 BUY PLAN – Liquidity Sweep Setup
Entry: ₹4,018 – ₹4,020
Stop Loss: ₹4,005
Targets: ₹4,056 → ₹4,100 → ₹4,150
If liquidity sweeps this zone clean, watch for a sharp recovery flow.
🧭 Summary – MMFLOW View
Gold is in “decision mode”, waiting for CPI and macro catalysts to trigger the next trend.
The structure stays neutral-bullish as long as price holds above ₹4,056.
A confirmed breakout above ₹4,155 may unlock a fast rally toward ₹4,215–₹4,260, while a break below ₹4,018 could open the door for one more liquidity flush.
⚜️ MMFLOW Bias: No need to predict the move — just follow the flow when liquidity confirms.
📊 Do you expect gold to break higher after CPI, or trap traders before reversing?

$4,005 BROKEN! GOLD READY FOR CPI COLLAPSEFranCi$$_FiboMatrix Emergency Action Plan (H1 Focus)
Welcome Traders! Gold (XAU/USD) has attracted sellers and is now trading below $4,100. With the US CPI release looming, the DOWNSIDE BREAKDOWN is our highest conviction scenario!
1. Market Snapshot
Current State: Gold is consolidating in a Sideway Zone between $4,159 (Resistance) and $4,005 (Critical Support).
Pressure: The recent break below $4,100$ and the recovering USD are key bearish factors.
The Catalyst: US CPI today. A hot inflation print will fuel the USD and shatter the $4,005$ floor.
Dominant Risk: Break below $4,005.438$ confirms the major bearish trend targeting $3,889$.
2. MAIN TRADING PLAN: Breakdown Scenario (SHORT) 💰
We are setting the trap to execute the SELL trade immediately upon the decisive breach of the $4,005$ Support.
Activate SHORT: Breakdown below $4,005.438$. (Wait for H1 close confirmation).
STOP-LOSS (SL): $4,159.686$. Placed safely above the Sideway Resistance.
TAKE-PROFIT 1 (TP1): $3,938.128 (Fibo Target).
TAKE-PROFIT 2 (TP2): $3,889.330 (Ultimate Structural Target).
3. Contingency Scenario (LONG) ⬆️
Activate LONG: Only if Gold decisively breaks $4,159.686$ (Breakout Zone) and targets $4,237.334.
Note: High-risk counter-trend trade, likely requiring a major negative surprise from the CPI report.
Community Interaction 🚀
The CPI is coming! Will the data be hot enough to smash $4,005$? Or is the Sideway Zone here to stay?
Drop your priority scenario NOW! 👇

XAUUSD – Awaiting a Breakout to Confirm the Next Bullish WaveGold remains under pressure, trading slightly below 4,100 USD/oz despite ongoing geopolitical tensions and weak global sentiment.
On the higher timeframe, the structure still respects its ascending channel, showing no signs of a deep breakdown yet.
During the early Asian session, renewed buying interest has started to emerge, supported by a stable inflow of safe-haven demand.
Technically, price is attempting to form a bullish continuation structure (Dow wave) around the 4,110 zone.
If a breakout above this key level occurs, gold could accelerate toward 4,155, and potentially extend into a corrective bullish wave targeting 4,220–4,260, aligning with the Fibonacci retracement confluence and the CP/OBS sell zone on the chart.
Technical Outlook (M30):
Price action suggests a potential wave recovery structure forming after last week’s steep decline.
The 4,155 level acts as a key inflection point — it will decide whether bulls regain control or bears push for another correction.
Key Levels:
CP Zone Up / Breakout Base: 4,053 – 4,055
Short-Term Key Level: 4,110 – 4,115
Mid-Level Resistance: 4,155 (structure pivot)
Fibo Sell Zone / Wave End Target: 4,220 – 4,263
Trading Plan:
🔹BUY Setup #1
💥Entry: 4,020 – 4,018
❌Stop Loss: 4,010
✔️Take Profit: 4,030 → 4,035 → 4,040 → 4,050 → 4,060 → 4,100
⏸Bias: Reaccumulation Phase (structure support)
🔹BUY Setup #2 (Scalp Play)
🔔Entry: 4,053 – 4,051
❌Stop Loss: 4,043
✔️Take Profit: 4,060 → 4,070 → 4,080 → 4,090 → 4,100 → 4,150
⏸Note: Ideal for intraday traders watching the breakout base.
🔹SELL ZONE (Liquidity Reaction Zone)
📊Entry: 4,263 – 4,265
❌Stop Loss: 4,273
✔️Take Profit: 4,255 → 4,250 → 4,240 → 4,230 → 4,220 → 4,210 → 4,200
⭐️Summary:
Gold continues to consolidate above 4,050, showing signs of early recovery after the recent 3,000-pip correction.
The 4,155 level remains the key pivot for short-term direction — a breakout here could confirm a Wave 3–5 recovery structure, while rejection could bring one more pullback.
Macro and geopolitical uncertainty still favour safe-haven flows, keeping the bullish scenario valid as long as 4,000–4,020 holds.
📊What’s your take — will gold break above 4,155 to start a new bullish wave, or reject and extend the correction further?

SELLOFF IMMINENT GOLD TRAPP Final Warning Before $4000 COLLAPSEWelcome Traders! The Gold market (XAU/USD) is tightly constrained, and the pressure from the USD, combined with the technical breakdown risk, makes the SHORT scenario our highest conviction trade!
1. Sharp Technical Analysis
The H1 chart confirms a Bearish Consolidation structure after the steep drop from $4,370$. The price is locked in a high-stakes "No-Trade Zone".
Dominant Trend: BEARISH (following the breakdown of the Double Top pattern at $4,100$).
Consolidation Range (No-Trade Zone): Price is squeezed between $4,005 (Support) and $4,159 (Resistance).
Bear Flag Warning: A highly probable Bear Flag pattern is forming, suggesting an explosive downside move upon breakout.
Action Mandate: WAIT FOR THE BREAKDOWN CONFIRMATION!
2. Fundamental Analysis: USD Fueling the Drop
USD Strength: The USD sustained its upward momentum, increasing the burden on Gold. While a slight pullback occurred at the US open, the overall positive USD momentum remains a significant bearish factor.
Impact: Consistent USD demand makes a decisive break above $4,159$ highly unlikely. This heavily favors the scenario where Gold breaches the critical $4,000$ support.
3. MAIN TRADING PLAN: Breakdown Scenario (SHORT)
We are setting the trap to execute the SELL trade immediately upon the decisive breach of the $4,005$ Support.
Activate SHORT: Breakdown below $4,005$. Confirm with an H1 candle closing decisively beneath this level.
STOP-LOSS (SL): $4,159$. Placed safely above the No-Trade Zone Resistance.
TAKE-PROFIT 1 (TP1): $3,955.772. The next structural support target.
TAKE-PROFIT 2 (TP2): $3,889.251. The final objective, aligning with the larger pattern target.
Contingency Scenario (LONG)
Activate LONG: ONLY if Gold decisively breaks $4,159$ (Breakout Zone) and targets $4,332.127.
Note: This is a counter-trend, high-risk trade requiring massive news to justify.
Community Interaction 🚀
Are you ready for the break? Will Gold collapse to $3,889$ or surprise us with a break of $4,159$?
Drop your priority scenario NOW! 👇

GOLD RECOVERS: H1 Bounces at $4,150 – Sniping the Fibo SELL Zone🎯 Macro Summary & Bias: Weak USD & CPI Focus Drive Recovery
Gold price gained some traction in early European trading on Wednesday, recovering above the $4,150 level.
Primary Driver: The weaker US Dollar (USD) is currently supporting the price recovery.
Mixed Forces: Easing US-China trade tensions are putting some pressure on Gold, but this is offset by Fed rate cut expectations and general market uncertainty, which should limit the downside.
Key Event: Traders are keenly focused on the US CPI (Consumer Price Index) inflation report for September this Friday. Any sign of hotter-than-expected US inflation could lift the USD and pressure Gold in the short term.
Technical Bias: After the DOUBLE TOP DUMP and a +3000 PIPS move down, the market is now attempting a corrective rally. Our strategy is to SELL the strong Fibo/Volume resistance (Sell on Rally) before looking for the next BUY zone.
📊 In-Depth Technical Analysis (H1): Pinpointing the FIBO Reaction Levels
Based on the recent major market reversal from the Double Top and the current corrective bounce (Referencing image_43ce7f.png), we have our strategic levels:
1. Strategic SELL Zones (FIBO SELL REACT ZONES):
These are the primary resistance zones for executing SELL trades, anticipating the continuation of the post-dump correction:
REACTION FIBO 0.5 ZONE - SELL ZONE 4190 - 4200: This is the first critical resistance zone (0.5 Fibo retracement) to look for a Short entry.
REACTION FIBO - SELL ZONE BIG VOLUME for SELL SIDE 4300 - 4310: This is the major supply/liquidity zone and the ultimate target for the current corrective rally.
2. Strategic BUY Zone (ORDER BUY REACT ZONE):
This is the key support area where the previous dump found temporary relief, which we use for stop-loss or potential re-entry:
ORDER BUY ZONE 4100 - 4090: This is the immediate support zone formed after the dump, which is currently holding the price.
📈 TODAY'S ACTION PLAN
Primary Action (Prioritize SELL on Rally): Wait for the corrective bounce to reach the REACTION FIBO 0.5 ZONE - SELL ZONE 4190 - 4200.
Short Entry: Execute the SELL entry upon confirmed reversal candles (H1/M30/M15) in the 4190 - 4200 zone.
Targets (TP): Aim to retest the recent low and the LIQUIDITY PUMP area.
Contingency BUY: If price breaks decisively above 4200, the rally may extend to the BIG VOLUME SELL ZONE 4300 - 4310.
⚠️ Risk Warning
Risk Management: Place Stop Loss (SL) above the 4200 zone for the short entry. Watch the US CPI report on Friday closely, as inflation data could cause extreme volatility.
Wishing all FranCi$$_FiboMatrix traders a disciplined and victorious day!

GOLD PULLBACK: $4330 SLIDE! Sniping the Fibo BUY Zone🎯 Macro Summary & Bias: USD Stability Triggers Profit-Taking
Gold is extending its corrective slide from the all-time high zone, hitting around $4,331 - $4,330.
Primary Headwind: The US Dollar (USD) attracted buyers for three consecutive days, causing stability which triggered profit-taking in the overbought Gold market.
Long-Term Support: DXY trades slightly negatively due to the US government shutdown and trade tensions, keeping the long-term bullish outlook intact.
Technical Bias: The market is in a deep correction/profit-taking phase. Our focus is strictly on finding the FIBO BUY REACT ZONES to join the underlying bullish trend. DO NOT CHASE THE SELL MOVE.
📊 In-Depth Technical Analysis (H1): Pinpointing the FIBO Reaction Levels
Based on the current corrective structure and the Fibo/Volume zones defined on image_ddd575.png, we have our strategic levels:
1. Strategic SELL Zones (FIBO SELL REACT ZONES):
These are current resistance areas for short-term rejection or supply zone testing:
REACTION FIBO SELL ZONE 4340 - 4320: Current resistance. Look for a SCALP SELL opportunity if the price rejects this zone.
REACTION SELL ZONE - Big Volume for Sell Side 435x: Major supply/liquidity zone if price attempts a deeper retracement.
2. Strategic BUY Zones (FIBO BUY REACT ZONE):
These are the most critical Fibo support zones for initiating Long entries:
REACTION FIBO BUY ZONE 4270 - 4265: The first crucial Fibo Retracement support.
REACTION BUY ZONE - Big Volume For Buy Side 4230 - 4220: The high-volume demand zone and optimal entry point for the major Long trade.
📈 TODAY'S ACTION PLAN
Primary Action (Prioritize BUY): Wait for the price to correct to the REACTION FIBO BUY ZONE 4270 - 4265 or 4230 - 4220.
Long Entry: Execute the BUY entry only upon confirmed reversal candles (H1/M30/M15).
Scalp SELL Action: If the price strongly rejects the 4340 - 4320 zone, a quick SCALP SELL targeting the nearest BUY ZONE can be considered.
Targets (TP): Aim for the highs and the 435x Sell Zone for the Longs.
⚠️ Risk Warning
Risk Management: Always place a safe Stop Loss (SL) below the nearest active BUY ZONE. DO NOT OVERLEVERAGE in this corrective phase.
Wishing all FranCi$$_FiboMatrix traders a disciplined and victorious day!

Gold Holding Gains Ahead of Key US CPI DataGold extends its bullish momentum in early Asian trading, hovering near ₹4,370, supported by rate-cut expectations from the Fed and ongoing US government shutdown concerns, which continue to pressure the USD.
According to CME FedWatch, markets are now pricing in a 99% probability of another rate cut next week — a strong catalyst for gold bulls.
Lower interest rates reduce the opportunity cost of holding non-yielding assets like gold, reinforcing the medium-term uptrend.
However, all eyes are on the US September CPI report due later this week.
A hotter-than-expected reading could temporarily lift the USD and trigger short-term volatility in gold prices.
🔍 MMFlow Technical Outlook
Gold is currently consolidating around the ₹4,320–₹4,370 range after reaching the ATH zone.
Price action shows a clear liquidity sweep at the highs, followed by a minor retracement — still within the bullish structure.
The main trendline remains intact, suggesting that any dip toward ₹4,305–₹4,260 may attract new buyers.
⚙️ Trading Plan (MMFlow View)
🔼BUY SCALP
📌Entry: ₹4,302 – ₹4,300 (½ volume)
❌Stop Loss: ₹4,292
✔️Take Profit: ₹4,310 → ₹4,315 → ₹4,320 → ₹4,330 → ₹4,340 → ₹4,350+
🔼BUY ZONE (Swing)
✨Entry: ₹4,260 – ₹4,258
❌Stop Loss: ₹4,252
✔️Take Profit: ₹4,265 → ₹4,270 → ₹4,280 → ₹4,290 → ₹4,300+
📈Buy setups remain favored as long as price holds above ₹4,260.
Intraday sell reactions near ₹4,360–₹4,378 are short-term only — watch for liquidity grabs and bullish re-entry opportunities.
⚡️Key MMFlow Zones
CP Down Zone / OBS Sell Zone: ₹4,360
ATH Liquidity Sell Zone: ₹4,448
Retest Trendline / OBS Buy Zone: ₹4,305
End FVG Uptrend / OBS Buy Zone: ₹4,260
Sentiment: 🟢 Bullish Bias
Bias Confirmation: CPI Data & Fed Rate Expectations
Strategy: Buy-the-Dip → Target Liquidity Above ₹4,370–₹4,380
🔥 Stay patient — let liquidity drive the next leg. MMFlow tracks smart money zones, not emotions.

XAU/USD – Gold Technical Rebound Prepares for Next Waveb]🔍 Market Context
After reaching a peak at the ATH GOLD 4,391 USD region, gold has undergone a technical correction — reflecting temporary profit-taking following a strong upward trend.
The market structure still maintains a bullish bias as the support zones below (FVG + OB) remain intact and untested.
Currently, the price is hovering around 4,325 USD, indicating that selling pressure has weakened.
Buyers are likely to return at two strategic zones below — where institutional money (Smart Money) typically accumulates positions before the next upward wave.
💎 Technical Analysis
ATH GOLD: 4,391 USD
Liquidity Zone $$$: 4,465 – 4,424 USD → the upper liquidity zone, the main target for the next upward wave.
FVG Zone: 4,284 – 4,267 USD → an unfilled gap, likely to be retested.
Order Block Zone: 4,244 – 4,230 USD → deep discount zone confluence with Fibo 0.786, high probability of strong reaction.
Liquidity Clear $$$: 4,186 – 4,190 USD → the last defense zone of the main upward trend.
Overall structure remains bullish ; the current decline is merely a phase of adjustment to “accumulate liquidity” before continuing the upward momentum.
📈 Trading Scenarios
1️⃣ BUY Setup #1 – FVG Zone 4,267 USD
Entry: 4,267 – 4,270
SL: 4,255
TP: 4,330 → 4,366 → 4,391
✅ Condition: Confirming bullish candle (rejection / engulfing bullish) at the FVG zone or a small BoS appears on M15.
➡️ Short-term “buy-the-dip” setup, leveraging the unfilled FVG zone — where technical buyers often initiate positions first.
2️⃣ BUY Setup #2 – Order Block Zone 4,244 USD
Entry: 4,244 – 4,230
SL: 4,210
TP: 4,284 → 4,366 → 4,391 → 4,424
✅ Condition: Strong confirming candle (engulfing bullish) or a retracement pattern breaking a small BoS back up.
➡️ Swing-buy setup at deep discount zone — confluence of OB + Fibo 0.786, high probability and optimal R:R.
⚠️ Risk Management
Avoid FOMO buying in the middle of the range (4,320–4,340).
Prioritize waiting for clear reactions at 4,267 and 4,244 before entering trades.
If the price closes an H1 candle below 4,210 → pause all buy orders, re-evaluate price action at 4,186.
Maintain moderate trading volume during the current rebound phase.
💬 Conclusion
Gold is in a phase of healthy technical correction within a major upward trend.
The two zones 4,267 USD (FVG Zone) and 4,244 USD (Order Block Zone) are key “accumulation” areas for large capital.
When bullish confirmation signals appear, these will be safe buy positions before gold heads back to the peak 4,391 – 4,465 USD .
👉 Reasonable Strategy:
Buy at 4,267 – 4,270 USD if reversal confirmation occurs.
Buy at 4,244 – 4,230 USD if a strong OB reaction signal appears.
🔥 “Smart money waits at precise levels — not at the top. The next gold wave will emerge between 4.267 and 4.244.”

XAUUSD PLAN | When balanced breaks, strength leaves its mark.🔍 Market Context
After setting a short-term peak at the 4,385 – 4,372 USD zone, gold has entered a strong technical correction phase, with a series of consecutive red candles breaking the short-term upward structure.
The sellers temporarily dominate, pushing the price through the H1 upward trendline. However, the support zone below (Liquidity Zone + Order Block Bullish) is beginning to show absorption, indicating that buyers might return at discounted price zones.
💎 Technical Analysis
Previous Bullish BoS: confirms the main trend is still long-term bullish .
FVG Down Zone: 4,285 – 4,260 USD → a price imbalance zone left in the downtrend, possibly where the price may retrace to “fill the gap” before choosing a direction.
Liquidity Zone $$$: 4,222 – 4,218 USD → a short-term support zone where new buying liquidity appears.
Order Block Bullish: 4,203 – 4,185 USD → a confluence area between OB and Fibo 0.786, where large capital might return.
Deep Bullish OB: 4,142 – 4,128 USD → the last defensive zone for the main upward trend.
Order Block Bearish: 4,372 – 4,385 USD → a critical resistance zone, likely to react if the price retraces.
The current structure shows gold is in a retracement – liquidity rebalancing phase, with insufficient signals to reverse the trend.
📈 Trading Scenarios
1️⃣ Main Scenario – Buy reaction at Liquidity zone 4,222 – 4,203 USD
Entry: 4,222 – 4,203
SL: 4,185
TP: 4,260 → 4,318 → 4,372
✅ Condition: Strong rejection candle (rejection / engulfing bullish) appears at the support zone or small reversal BoS.
➡️ This is a “buy the dip” setup following the main trend, leveraging the liquidity zone and confluence OB.
2️⃣ Secondary Scenario – Sell reaction at FVG Down 4,285 – 4,260 USD
Entry: 4,260 – 4,285
SL: 4,300
TP: 4,222 → 4,203
✅ Condition: Strong bearish candle or rejection signal appears at the FVG zone.
➡️ This setup is for scalping traders or short-term shorts in the unfilled price balance zone.
⚠️ Risk Management
Do not FOMO buy when the price has not confirmed the 4,222 zone.
If the price breaks below 4,185 → wait for a re-test to continue selling towards the 4,128 zone.
Keep moderate volume, as the market is in a rebalancing phase – liquidity remains noisy.
💬 Conclusion
Gold is in a transitional phase after a strong decline .
The 4,222 – 4,203 USD zone will be key to determining whether the medium-term upward trend continues.
If this zone holds, gold is likely to retest the 4,318 – 4,372 USD zone.
👉 Reasonable Strategy:
Buy reaction at 4,222 – 4,203 USD when confirmed.
Technical Sell at FVG 4,260 – 4,285 USD if a clear rejection appears.
🔥 “When the market is unbalanced, the strongest side will leave a mark – and this time, the mark is around the 4,220 USD zone.”

Gold Bullish Reversal from Demand Zone Targeting 4320 ResistanceGold has displayed a strong bullish rejection from the 4,220–4,240 demand zone, signaling that buyers are stepping back in after a brief corrective phase. The price has respected the previously broken ascending trendline, now acting as dynamic support, indicating that market sentiment remains positive.
Key Observations:
Trend Structure: The broader trend continues to favor the bulls, with higher highs and higher lows still valid.
Demand Zone: Buyers defended the 4,220–4,240 area with stxrong volume, confirming institutional interest.
Price Action: Recent bullish engulfing candles suggest renewed buying momentum.
Next Resistance: The 4,310–4,330 region stands as a key resistance zone where partial profit-taking could occur.
Volume: Noticeable increase in bullish volume near support adds confirmation to the move.
Trading Outlook:
If price sustains above 4,240, the bias remains bullish toward 4,320–4,340.
A daily close below 4,220 would invalidate this setup and shift focus back to the 4,100 zone.
Summary
Gold is currently positioned for a potential continuation of its primary uptrend, with early signs of buyer strength re-emerging at major support. Momentum remains in favor of the bulls as long as the 4,220 base holds firm.

GOLD Accumulates Above $4200 Which Fibo React Zone Fires First ?🎯 Macro Summary & Bias: The Calm Before the Geopolitical Storm
Gold is trading above the psychological $4,200 mark but struggled to gain meaningful traction on Monday due to mixed forces.
Driving Forces: Increased geopolitical tensions and trade uncertainty act as tailwinds for the safe-haven asset.
USD Weakness: Expectations for more Fed rate cuts and the US government shutdown weaken the USD, providing support for XAU/USD. Traders have fully priced in two more rate cuts this year, which continues to pressure the US Dollar.
Technical Outlook: Gold is currently consolidating above $4,200, signaling that the bullish structure remains intact. We are now watching for confirmation at key Fibo levels before the next breakout.
📊 In-Depth Technical Analysis (H1): Pinpointing the FIBO Reaction Levels
Our core strategy is to BUY ON DIPS at the identified Fibo Reaction Zones and look for short-term Sells only as resistance tests (Referencing image_58f686.png).
1. Strategic BUY Zones (FIBO BUY REACT ZONE):
These are the crucial support zones for initiating Long entries:
Reaction Fibo Buy Zone 4230 - 422x. This is the immediate, primary support zone where we anticipate the first bounce.
Big Volume For The BUY Side 4205 - 4200. This is the major demand zone and the ultimate pullback point to catch the large growth wave.
2. Strategic SELL Zones (FIBO SELL REACT ZONES):
These are high-volume resistance areas for potential Take Profit (TP) or short-term Scalp Sells:
Reaction Fibo Sell Zone 4280 - 4285. The first key resistance level where the price may encounter selling pressure.
Reaction Fibo Sell Zone 4315 - 4320. The next significant resistance and TP level.
Big Volume For The Sell Side 4356 - 4360. The major supply and long-term TP target.
📈 TODAY'S ACTION PLAN
Primary Action (Prioritize CHỜ ĐỢI BUY): The market is consolidating. Do NOT FOMO. Patiently wait for the price to correct to the Reaction Fibo Buy Zone 4230 - 422x.
Long Entry: Upon confirmation (H1/M30/M15 reversal candles) at the BUY Zones, confidently activate the Long (BUY) entry.
Targets (TP): Aim for the successive SELL Zones: 428x, 431x, and the ultimate target at 4356 - 4360.
⚠️ Risk Warning
Risk Management: Always place a safe Stop Loss (SL) below the nearest active BUY ZONE. Monitor trade talks closely as they could trigger sharp volatility.
Wishing all FranCi$$_FiboMatrix traders a disciplined and victorious week!

4,200 or 4,285? Gold’s Next Move Decides It All📊 Market Overview
Gold remains under pressure at the start of the week, trading below last week’s record highs, after a sharp correction from the 4,380s down to the 4,240 zone.
Investor sentiment is cautious as the market navigates a mix of uncertain U.S. economic data, a still-closed U.S. government, and renewed geopolitical tensions across multiple regions — all of which are fueling both fear and indecision in the market.
During early Asian hours, gold showed a mild recovery but continues to move sideways in a tight consolidation range, reflecting indecisive liquidity buildup before the next major move.
🧠 Technical Structure (MMFLOW View)
Gold is consolidating between short-term support near 4,206–4,204 and resistance around 4,285–4,287.
Liquidity has started to cluster above and below the current range, suggesting that a breakout is imminent.
The 4,166 – 4,140 region remains a major Smart Money re-entry zone, aligned with the CP BUY ZONE + OBS demand block.
On the upside, 4,313 – 4,342 stands as a key supply zone where large sellers previously stepped in.
Until price breaks out decisively, traders should expect choppy intraday conditions with limited follow-through.
🔑 Key Levels to Watch
🟢 BUY ZONE (Liquidity Re-entry Zone)
Zone: 4,206 – 4,204
SL: 4,200
TP: 4,210 – 4,215 – 4,220 – 4,230 – 4,240 – 4,250 – ???
🔴 SELL ZONE (Liquidity Reaction Zone)
Zone: 4,285 – 4,287
SL: 4,292
TP: 4,280 – 4,275 – 4,270 – 4,260 – 4,250 – ???
⚙️ MMFLOW Scenarios
1️⃣ Bullish Scenario:
If gold sustains above the 4,200 – 4,210 support area, a short-term rebound toward 4,270 – 4,285 can be expected.
Breaking above 4,287 would open room toward 4,313 – 4,342 (OBS Sell Zone), where Smart Money may begin distributing again.
2️⃣ Bearish Scenario:
A clean break below 4,200 could trigger a deeper retracement toward 4,166 – 4,140 (CP BUY ZONE).
This would still represent a healthy correction within the broader bullish macro structure.
⚡️ MMFLOW Insights
Market remains neutral-to-bullish, but current movement reflects accumulation within a compression range.
Sideway structure indicates the market is loading liquidity for the next impulsive leg.
Patience is key — traders should wait for clean breakout confirmations before scaling positions.
⚠️ Trading Notes
✅ Use tight Stop Losses — gold’s volatility remains unpredictable during macro uncertainty.
✅ Avoid over-leveraging while price stays inside the sideway channel.
✅ Focus on reaction zones (CP, OBS, and liquidity sweeps) for precise entries.
🧭 Quick Summary
Gold trades sideways below record highs.
Key support: 4,206 – 4,204, key resistance: 4,285 – 4,287.
Short-term bias: Range-bound with bullish undertone.
Best approach: Buy dips at liquidity zones; wait for breakout confirmation before trend trades.

GOLD Awaiting Sell Reaction at Peak & Buy Pullback Support🔍 Market Context
After a series of strong Break of Structure (BoS) , gold has reached a new ATH at 4,385 USD – marking a sustainable uptrend over the past 3 sessions.
However, this peak area is currently acting as a significant psychological and technical barrier . Buying momentum is temporarily slowing as the price reacts to the Liquidity Zone around 4,351 – 4,385 USD .
The market is in a phase of liquidity rebalancing .
The major trend remains upward, but the current price area may see a short-term correction before further wave expansion.
💎 Technical Analysis
ATH GOLD: 4,385 USD
Sell Liquidity Zone: 4,430 – 4,435 USD → high liquidity resistance zone, potential for short-term sell reactions.
Liquidity Zone $$$: 4,284 – 4,282 USD → nearby support zone, confluence with trendline.
Order Block | Fibonacci Zone: 4,226 – 4,230 USD → deep discount zone confluencing with Fibo 0.618, high reversal potential.
Overall Structure: remains bullish , but showing short-term signs of weakness as the price fails to hold above 4,360.
📈 Trading Scenarios
1️⃣ SELL Setup – Rejection at peak area 4,385 – 4,433 USD
Entry: 4,430 - 4,435
SL: 4,440
TP: 4,425 → 4,420 →4,415→4,410→4405
✅ Condition: Appearance of rejection or strong bearish engulfing candles at high Liquidity zone.
➡️ This is a liquidity reaction setup – sell when the price sweeps the peak and clear sell signals from major players appear.
2️⃣ BUY Setup #1 – Pullback at 4,284 – 4,282 USD
Entry: 4,284 – 4,282
SL: 4,272
TP: 4,290 → 4,300 → 4,310/Open
✅ Condition: Strong H1 candle reaction at support or minor reversal structure.
➡️ Buy with the main trend, taking advantage of a slight pullback around the support Liquidity zone.
3️⃣ BUY Setup #2 – OB Deep Zone 4,226 – 4,230 USD
Entry: 4,226 – 4,230
SL: 4,190
TP: 4,235 → 4,240 → 4,250/Open
✅ Condition: Appearance of bullish BoS or confirming bullish engulfing candle.
➡️ This is a deep discount zone, suitable for swing orders following the main trend.
⚠️ Risk Management
Avoid FOMO buying at high zones (4,360+).
Prioritize observing price behavior at 4,284 and 4,226 before entering orders.
Sell orders at 4,385–4,430 are only triggered if there is a clear confirmation signal.
Maintain moderate volume, avoid averaging down without confirmation.
💬 Conclusion
Gold is accumulating after reaching the peak of 4,385 USD , this is a crucial phase to determine the correction before the new upward wave.
The most effective strategy now is sell reaction at the high peak area 4,385 – 4,430 and buy with the trend at 4,284 – 4,226 USD when confirmation appears.
👉 Reasonable Strategy:
Sell Reaction: 4,385 – 4,430 → TP 4,284 – 4,226
Buy Pullback: 4,284 – 4,282
Buy OB Deep: 4,226 – 4,230

Gold Plan | Where will gold drop today?🔍 Market Context
Gold continues to maintain a short-term upward trend following a series of Break of Structure (BoS) , confirming active buying from lower zones.
Currently, the price is approaching the ATH GOLD zone and heading towards the Liquidity Sell Zone 4,281 USD – a densely liquid area where short-term sell reactions from major players may occur.
After a hot rise, technical correction risks are starting to increase. Lower zones like 4,186 – 4,152 – 4,130 USD will be potential “accumulation zones” for institutional buyers in the upcoming pullback.
💎 Technical Analysis
ATH GOLD: 4,275 – 4,280 USD
Liquidity Sell Zone: 4,281 – 4,285 USD → high liquidity resistance area, may trigger short-term reversal reactions.
Liquidity Zone $$$: 4,186 – 4,152 USD → crucial support area in the uptrend, where technical reactions are expected.
FVG – BoS Zone: 4,152 – 4,148 USD → “price balance” zone yet to be filled, likely to be retested.
OB Deep Zone: 4,130 – 4,120 USD → deep demand zone converging with Fibo 0.786 – ideal area for large capital to re-accumulate.
Overall structure remains bullish , but in the premium zone – an area where institutions typically distribute orders to gain liquidity before adjusting.
📈 Trading Scenarios
1️⃣ Main Scenario – Sell reaction at Liquidity Zone 4,281 USD
When the price hits the 4,275 – 4,281 USD zone and clear reversal signals appear (rejection candles, bearish engulfing, or minor structure break),
→ open short-term sell orders (scalp/intraday).
Target: 4,186 → 4,152 USD.
Stop Loss: above 4,285 USD.
➡️ This is a typical “liquidity sweep – technical reaction” scenario, capitalising on short-term sell-offs at high liquidity peaks.
2️⃣ Secondary Scenario – Buy back following the main trend after correction
When the price corrects to the 4,186 – 4,152 USD zone or deeper to OB Deep 4,130 USD ,
and clear upward confirmation signals appear (strong rejection or minor BoS increasing again),
→ open buy orders in line with the main trend.
Target: 4,230 → 4,275 USD.
Stop Loss: below 4,120 USD.
➡️ Trend-following scenario – waiting for price correction to discount zones to accumulate in line with the larger trend.
⚠️ Risk Management
Do not FOMO buy when the price is hitting the 4,275 – 4,281 USD zone.
Prioritise short-term sells with clear confirmations or buys at lower OB zones.
Keep light volume when trading against the main trend.
Observe reactions at the 4,186 zone – this is the key level of the day.
💬 Conclusion
Gold is at the peak of the current rise , short-term profit-taking pressure may appear around the 4,281 USD zone.
If strong reactions occur, a correction to the 4,186 – 4,152 USD zone is reasonable for market rebalancing.
The larger trend remains upward , so lower OB zones will be reasonable buy opportunities for the next wave.
👉 Reasonable Strategy:
Sell reaction at 4,281 USD when reversal signals appear.
Buy back at 4,186 – 4,152 – 4,130 USD when confirmation signals appear.

Gold Pulls Back From All-Time High – Correction Looks Limited📊 Market Overview
Gold slightly corrected from its all-time high near $4,239, showing early signs of a short-term pullback, but the overall trend remains bullish.
Despite the correction, fundamental sentiment still supports Gold:
💬 US–China trade tensions and geopolitical risks continue to fuel demand for safe-haven assets.
💵 The US Dollar remains under pressure amid expectations of a Federal Reserve rate cut later this year.
⚖️ Ongoing concerns about a possible US government shutdown further enhance Gold’s attractiveness.
These factors suggest that the current dip is likely a healthy correction within a strong uptrend, not a reversal.
🧠 Technical Structure (MMFLOW Wave View)
Gold has likely completed a minor Wave (V) on the M30 chart, forming a new ATH Zone near 4,239.
Currently, price is unfolding a corrective A–B–C pattern, expected to find support at key liquidity zones before resuming the uptrend.
Our model highlights two potential BUY setups and a short-term SELL scalp opportunity for today’s trading session.
🔑 Key Levels to Watch
🔵 BUY Setup 1
Zone: 4,184 – 4,182
SL: 4,178
TP: 4,188 – 4,192 – 4,196 – 4,200 – 4,210 – 4,220 – ???
🟢 BUY Setup 2 (Deeper Retrace)
Zone: 4,148 – 4,146
SL: 4,140
TP: 4,152 – 4,156 – 4,160 – 4,170 – 4,180 – 4,190 – 4,200
🔴 SELL SCALP Opportunity
Zone: 4,230 – 4,234
SL: 4,238
TP: 4,220 – 4,215 – 4,210 – 4,200 – 4,190 – ???
⚙️ MMFLOW Trading View
📈 Price is currently respecting Wave (A) of the correction.
We expect a possible (B) retracement toward 4,220 – 4,230, followed by (C) decline completing near 4,147 – 4,150 (Fibo 0.618 / CP Buy Zone).
From there, Smart Money may re-enter long positions targeting a fresh liquidity sweep toward the 4,285 SELL ZONE.
In short:
The uptrend remains intact, only a short-term correction is unfolding.
Patience is key — best opportunities will likely appear around 4,150 – 4,180 range.
The structure aligns perfectly with both technical confluence (Elliott + Liquidity Zones) and macro sentiment.
If the market holds above 4,140, Gold could aim for new highs toward 4,285 – 4,300 in the next few sessions.
However, traders should:
✅ Always use Stop Loss — volatility is high near record highs.
✅ Avoid overtrading in narrow pullback zones.
✅ Focus on reaction at key liquidity levels before entering.
⚡️ Summary
Gold remains technically bullish with limited downside correction.
Watch for price reaction around 4,184 and 4,147 — both zones represent strong liquidity areas where Smart Money may look to buy again.
After completing this correction, a new impulsive leg up toward 4,285+ could unfold, potentially marking the next all-time high.

XAUUSD – Safe-Haven Flows Continue to Support GoldMarket Context:
Gold has attracted strong buying for the fourth consecutive session, supported by a mix of global risk factors: renewed US–China trade tensions, rising geopolitical uncertainty, and growing fears of a prolonged US government shutdown.
Meanwhile, dovish expectations from the Federal Reserve are keeping the USD under pressure — further enhancing the appeal of gold as a non-yielding safe-haven asset.
During the Asian session, XAU/USD printed a fresh all-time high, with bulls now eyeing a potential extension toward the 4,200 USD/oz region amid escalating global concerns.
Technical Outlook (M30):
Gold continues to respect its ascending channel structure, maintaining dynamic support between 4,167 – 4,154.
As long as price holds above 4,139, the broader trend remains bullish, with the next liquidity target sitting at 4,240 – 4,241.
Key Zones to Watch:
Liquidity Sell Zone: 4,240 – 4,242
ATH Zone / Short-Term Resistance: 4,190 – 4,200
OBS Buy Zone – CP Trendline Support: 4,141 – 4,139
Secondary Buy Zone: 4,114 – 4,112
Trading Plan:
🔹 BUY Zone
Entry: 4.141 – 4.139
SL: 4.134
TP: 4.145 → 4.150 → 4.155 → 4.160 → 4.170 → 4.180
🔹 BUY Zone
Entry: 4.114 – 4.112
SL: 4.106
TP: 4.120 → 4.125 → 4.130 → 4.140 → 4.150
🔹 SELL Zone (Scalp Reaction)
Entry: 4.240 – 4.242
SL: 4.248
TP: 4.235 → 4.230 → 4.225 → 4.220 → 4.210 → 4.200
Summary:
The bullish market structure remains intact as long as price holds above the 4,139 zone.
Watch for potential long opportunities from 4,141 – 4,139, where the confluence of trendline and order block support could trigger fresh demand.
Bulls remain in control, targeting the 4,240 – 4,241 liquidity area in the coming sessions.
📊 What’s your take — will gold break above 4,200 or pause for a correction first?
👉 Follow MMFLOW TRADING for daily market structure insights and institutional-style setups.
🟣 Chart: XAUUSD M30 – Smart Money Flow structure highlighting liquidity pools, CP confluence and key buy/sell zones.

XAU/USD – Buyers Reclaim Structure, Targeting Liquidity Zone🔍 Market Context
After a strong Liquidity Sweep yesterday, gold has rebounded and formed consecutive Break of Structure (BoS) , confirming buyers have regained control.
The price has now filled the Fair Value Gap (FVG 4,191 – 4,202) and is heading towards the Sell Liquidity Zone 4,237 – 4,240 USD — a concentration of pending sell orders and stop-losses from previous short positions.
The current structure shows strong bullish momentum , however, the possibility of a correction from this high liquidity area is noteworthy.
💎 Technical Analysis
Liquidity Sweep: Completed, clearing liquidity below 4,070.
FVG (Fair Value Gap): 4,191 – 4,202 → filled, confirming price balance.
Sell Liquidity Zone: 4,237 – 4,240 → potential resistance zone, likely strong reaction.
OB Zone | Buy: 4,143 – 4,145 → nearby support, expected first reaction when price corrects.
OB Deep | Buy: 4,110 – 4,115 → deep demand zone, confluence with Premium Zone 4,156 – 4,118.
Overall Structure: The main trend remains bullish , with strong upward momentum but requires a technical correction for re-accumulation.
📈 Trading Scenarios
1️⃣ Main Scenario – Sell reaction at liquidity zone
When the price approaches the Sell Liquidity Zone 4,237 – 4,240 USD , observe candlestick reaction (rejection, bearish engulfing).
If confirmation signals appear, open a short-term sell order .
Target: OB Buy Zone 4,145 → 4,110 USD.
Stop Loss: above 4,245 USD.
➡️ This is a liquidity reaction setup, high probability when the market encounters resistance confluence with Fibonacci zone 0.786–1.0.
2️⃣ Alternative Scenario – Buy with trend from OB
If the price corrects to the OB Zone 4,143 – 4,145 USD and shows a clear reaction (strong rejection or minor structure break),
→ a buy with the main trend can be opened.
Target: return to 4,200 → 4,235 USD.
Stop Loss: below 4,130 USD.
If the price drops further, the OB Deep Buy 4,110 – 4,115 USD will be the final “liquidity attraction” zone for a new upward bounce.
⚠️ Risk Management
Avoid FOMO buying at 4,200+ as it is near the liquidity resistance zone.
Prioritise short-term sell at 4,237 if clear signals are present.
When price corrects to OB, wait for reaction before buying, do not bottom fish early.
💬 Conclusion
After completing the liquidity sweep, gold has confirmed a return to bullish structure with multiple consecutive BoS.
Currently, the price is approaching the liquidity zone 4,237 USD – a short-term correction is highly likely.
The 4,145 – 4,110 USD zone will be where buyers await reaction to accumulate orders and continue the medium-term uptrend.
👉 Reasonable Strategy:
Short sell at 4,237 USD if reversal signals are present.
Wait to buy at OB zone 4,145 – 4,110 USD when clear reaction occurs.

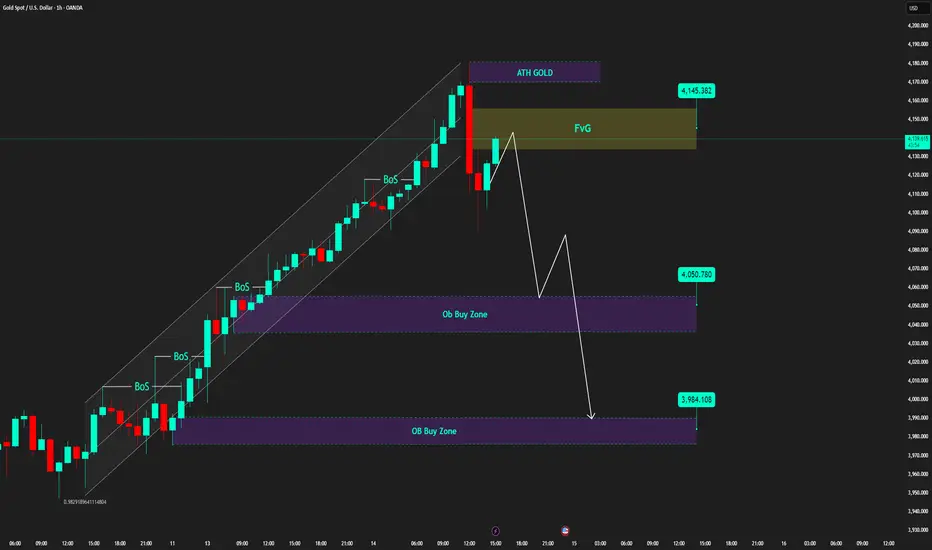
m15 timeframe sees gold drop sharply by 50 points 🔍 Market Context
Gold prices have just reached an all-time high (ATH GOLD) around the 4,180 USD mark, following a steep upward rally over several sessions.
Immediately after, the market witnessed the first break of structure (BoS) – a sign that the upward momentum is weakening .
Currently, prices are returning to fill the Fair Value Gap (FVG) at 4,125 – 4,145 USD , and this is likely a liquidity rebalancing phase before prices choose the next direction.
💎 Technical Analysis
ATH GOLD: 4,180 – 4,185 USD
Fair Value Gap (FVG): 4,125 – 4,145 USD → an empty price zone that needs to be filled.
Order Block Buy Zone 1: 4,050 – 4,060 USD → the nearest demand zone, potentially creating the first technical reaction.
Order Block Buy Zone 2: 3,980 – 3,985 USD → a deeper demand zone, large liquidity confluence, possibly becoming the main "accumulation point."
Overall Structure: After breaking the upward channel, the market is in a retracement phase – the medium-term structure remains bullish .
📈 Trading Scenarios
1️⃣ Short-term Sell Scenario – filling FVG and technical adjustment
If prices continue to test the FVG 4,125 – 4,145 USD zone without surpassing it,
→ consider a short-term sell to catch the technical retracement phase.
Target: the first OB Buy Zone at 4,050 USD .
Stop Loss: above 4,155 USD (to avoid being swept above the FVG peak).
➡️ This scenario suits short-term traders following corrective waves – only enter when there is a clear reversal candle confirmation.
2️⃣ Trend-following Buy Scenario – catching the rebound from OB Zone
If prices adjust to the 4,050 – 4,060 USD zone, observe reaction signals such as Bullish Engulfing or strong Rejection .
Upon confirmation, initiate a trend-following buy order .
Target: zone 4,125 → 4,145 USD or the previous peak at 4,180 USD.
Stop Loss: below 4,030 USD.
If the first OB zone does not hold, the 3,980 – 3,985 USD zone will be an ideal area for long-term "accumulation."
⚠️ Risk Management
Avoid FOMO buying at high prices when the FVG is not yet filled.
Prioritise trading at clear reaction zones (OB, FVG edge).
Reduce volume when entering counter-trend orders to preserve capital.
💬 Conclusion
After a steep rise, gold is entering a value rebalancing phase .
The current market structure leans towards a short-term technical retracement before continuing the main upward trend.
If the 4,050 – 4,060 USD zone reacts well, gold may soon rebound and aim for the 4,150 – 4,180 USD zone.
👉 Reasonable Strategy:
Short-term sell when price reacts at FVG.
Wait to buy at OB Buy Zone when there is a confirmed bullish signal.
XAUUSD – Sharp Pullback After Hitting New ATHMarket Context:
Gold has seen a steep intraday drop after hitting a fresh all-time high at 4,179 USD/oz, extending beyond the morning target of 4,170–4,172.
The move likely reflects profit-taking amid broader market caution, as the US Dollar strengthened and GBP fell sharply, indirectly weighing on XAUUSD.
Silver also followed the correction, down over 2%, trading near 51 USD/oz after peaking at 53.60 earlier.
Despite this drop, the overall market sentiment remains defensive — both metals are still up about 2% for the week, suggesting this is a technical retracement, not a full trend reversal.
Technical Outlook (M30):
Price has broken below the short-term rising channel and is now retesting key liquidity areas.
Watch the 4,134 – 4,135 zone for a potential retest (50% pullback) before continuation toward lower buy zones.
End Liquidity Sell Zone: 4,165 – 4,170
Retest Zone (50% Down): 4,134 – 4,135
CP Buy Zone / Fibo 0.618: 4,052 – 4,054
OBS Buy Zone: 4,000 – 4,005
Trading Plan:
🔹 Sell Setup (Correction Play):
Entry: 4,134 – 4,136
Stop Loss: 4,142
Take Profit: 4130 - 4125 - 4120 - 4110 - 4100 - ???
🔹 Buy Setup (Reaction Zone):
Entry 1: 4,052 – 4,054 (Fibo 0.618 Confluence)
Stop Loss: 4,044
Take Profit: 4056 - 4060 - 4065 - 4070 - 4080 - 4090 - ???
Summary:
Gold’s sharp drop after a new ATH signals a short-term correction phase while the broader bullish trend stays intact.
A pullback toward 4,052 or even 4,000 could attract buy-side liquidity before any recovery.
Keep an eye on 4,135 for a potential retest before continuation.
📊 What’s your view — is this just a healthy retracement or the start of a deeper correction?
👉 Follow MMFLOW TRADING for precise intraday setups and structure-based analysis.

XAU/USD – Liquidity Cleared, Gold Reloads for the Next Breakout🔍 Market Context
This morning, gold price (XAU/USD) experienced a classic liquidity sweep :
The price surpassed the previous high of 4058 , touched 4060 , wicked strongly , and short-term corrected – a textbook “liquidity hunt” by major funds.
After this drop, the price recovered back to the old ATH zone (4055 – 4060) .
This indicates that short-term sellers have weakened , and buyers are reclaiming the crucial structure zone .
Therefore, selling strategy is no longer optimal , instead, the market is preparing for a re-accumulation – next breakout.
💎 Technical Analysis
Current ATH: 4060 USD
Previous High: 4058 USD
This morning's liquidity sweep “cleared out” liquidity above, paving the way for a re-accumulation phase before the next rise.
The zone 4048 – 4052 is acting as a retest zone – if it holds, this could be the “launchpad” for a breakout to higher price zones.
Overall Structure: still bullish , no signs of medium-term reversal.
⚙️ Key Price Zones
Retest Zone: 4048 – 4052 → support zone after the sweep, where the price might bounce back.
Breakout Zone: 4065 – 4070 → zone confirming buyers regain dominance.
Extended Target: 4090 – 4100 USD.
Invalidation Zone: below 4040 USD → if breached, the short-term bullish structure will weaken.
📈 Trading Scenarios
1️⃣ Buy Continuation Scenario – Buy with the main trend
Wait for the price to retest the 4048 – 4052 zone , observe bullish candle reactions or confirmation signals (Engulfing, Rejection).
Open a buy order upon confirmation of holding the support zone.
Target: 4065 → 4090 USD.
Stop Loss: below 4040 USD.
➡️ This is a trend-following scenario, with the highest probability when the market has completed the liquidity sweep and is re-accumulating.
2️⃣ Buy Breakout Scenario – Buy on confirmed breakout
If the price breaks and closes above 4065 , it signals that major funds have returned.
Open buy stop or limit retest breakout around 4065 – 4070.
Extended Target: 4090 → 4100 USD.
Stop Loss: below 4050 USD.
➡️ This scenario suits momentum traders, avoiding the risk of “fake breakout” by waiting for clear confirmation.
⚠️ Risk Management
Do not sell against the trend at the ATH zone, as liquidity above has been taken.
Maintain reasonable volume when trading around the peak zone.
Prioritize buying when there is confirmation of the bullish structure holding the 4050 zone .
💬 Conclusion
This morning's liquidity sweep has shaken out weak hands , while helping gold pave the way for the next rise .
Currently, the price is re-accumulating around the old peak zone 4055 – 4060 , and if the zone 4048 – 4052 continues to hold, there is a high possibility that gold will break out to the 4090 – 4100 USD zone in the upcoming sessions.
👉 Reasonable Strategy:
Wait to buy at the support zone or buy when the price breaks above 4065.
Avoid selling against the trend now – the risk is very high as major funds have shifted to the accumulation phase.
