New ATH Above 3800 & FOMO Buying Still Driving the Market📊 Market Context
Gold has once again set a new all-time high above 3800 USD/oz, showing no signs of losing bullish momentum. The surge is fueled by strong FOMO buying flows, as traders continue to pile into safe-haven assets.
Concerns about a possible US government shutdown and renewed discussions around tariff policies have weighed on the dollar, while expectations of upcoming Fed rate cuts keep gold supported. Meanwhile, Fed speeches and incoming US data remain key drivers that could inject short-term volatility, but the broader bullish narrative remains intact.
🔎 Technical Analysis (H1/H4)
Price is firmly holding above the 3800 psychological level, confirming the breakout.
Buy zones remain intact at 3790–3792 and 3784–3782, with solid demand expected on any dip.
Sell liquidity sits around 3823–3825, where short-term profit-taking or traps may emerge before the next leg higher.
🔑 Key Levels
Resistance / Sell Zone: 3823–3825
Support / Buy Zones: 3790–3792, 3784–3782
📈 Scenarios & Trading Plan
BUY ZONE 1: 3790–3792
SL: 3786
TP: 3795 - 3800 - 3810 - 3820 - 3830 - ???
BUY ZONE 2: 3784–3782
SL: 3778
TP: 3790 - 3795 - 3800 - 3810 - 3820 - 3830 - 3840 - ???
SELL ZONE (Liquidity Trap Zone): 3823–3825
SL: 3830
TP: 3818 - 3814 - 3810 - 3805 - 3800 - ???
⚠️ Risk Notes
Beware of liquidity sweeps near 3823–3825 before continuation higher.
Fed comments and macro data may cause sudden spikes — adjust risk accordingly.
Stick to confirmation entries around zones to avoid being trapped by false moves.
✅ Summary
Gold is riding strong FOMO-driven bullish momentum, printing new highs above 3800. Main bias: buy on dips at 3790–3782, while monitoring short-term sell liquidity at 3823–3825 for potential pullbacks. The broader trend remains bullish, so patience and disciplined entries will be key.
Goldtradingstrategy

XAUUSD – Trading Plan: Gold Awaits PCE Catalyst📊 Market Context
Gold remains in consolidation mode after a sharp run earlier this week, holding steady below 3750. The market is now laser-focused on the US Core PCE Index, which could provide fresh direction for both the dollar and precious metals. With US yields stabilising and risk sentiment shifting, gold’s safe-haven appeal remains intact — but traders are weighing whether the recent pullback is a healthy correction or the start of a deeper retracement.
Meanwhile, the geopolitical backdrop continues to offer underlying support, while positioning in ETFs and futures suggests investors are cautious, awaiting clearer signals from the Fed. The upcoming data will likely decide whether gold breaks higher towards fresh highs or retests deeper liquidity zones.
🔎 Technical Analysis (H1/H4)
Price capped near short-term resistance at 3770–3772.
Immediate supports are 3741 and 3722, with deeper demand zones at 3690–3688 and 3670–3668.
The structure indicates possible liquidity sweeps before a decisive move.
🔑 Key Levels
Resistance / Sell Zone: 3770–3772
Support / Buy Zones: 3690–3688, 3670–3668
📈 Scenarios & Trading Plan
BUY ZONE 1: 3690–3688
SL: 3684
TP: 3695 - 3700 - 3710 - 3720 - 3730 - ???
BUY ZONE 2: 3670–3668
SL: 3664
TP: 3675 - 3680 - 3690 - 3700 - 3710 - ???
SELL ZONE: 3770–3772
SL: 3777
TP: 3765 - 3760 - 3750 - 3740 - ???
⚠️ Risk Notes
Watch for false breakouts at 3770–3772 before reversal.
PCE release may inject volatility across gold and USD pairs.
Position sizing and risk control are crucial into data.
✅ Summary
Gold is at a crossroads — safe-haven demand is still supportive, but technical resistance near 3770 remains a hurdle. Core strategy: buy dips into 3690–3670 zones, while staying cautious of short-term sell setups at 3770–3772. Manage exposure, wait for confirmation, and be prepared for volatility once PCE data hits.
📢 Follow MMFLOW TRADING for real-time updates and next-level trade setups.

Fed Cuts & Geopolitical Risks Keep Gold Strong📊 Market Overview
Gold is holding firm above 3750 USD/oz, extending gains and refreshing daily highs in the European session. Expectations that the Federal Reserve will continue cutting rates this year are supporting bullish sentiment, while ongoing geopolitical tensions keep safe-haven demand elevated. For Indian traders, this combination of softer USD and global uncertainty keeps gold attractive both as a hedge and a short-term trading instrument.
🔎 Technical Analysis (H1/H4)
Price structure remains bullish while holding above 3750.
Buy Zones: 3742–3740 (main support) and 3757–3755 (scalp setup).
Resistance nearby at 3778, with extended upside potential towards 3813–3815 (liquidity sell zone).
A rejection at 3813–3815 could trigger a short-term pullback to demand levels.
🔑 Key Levels
Resistance: 3778 - 3813 - 3815
Support / Buy Zones: 3757 - 3755 - 3742 - 3740
📈 Scenarios & Trading Plan
✅ BUY ZONE (Main Setup): 3742–3740
SL: 3735
TP: 3748 - 3752 - 3756 - 3760 - 3770 - 3780 - …
✅ BUY SCALP (Quick Entry): 3757–3755
SL: 3750
TP: 3762 - 3766 - 3780 - …
✅ SELL ZONE (Liquidity Trap): 3813–3815
SL: 3820
TP: 3810 - 3805 - 3800 - 3795 - 3790 - 3780 - …
⚠️ Risk Management Notes
Watch out for false breakouts at 3813–3815 — liquidity sweeps are likely before reversals.
Focus on buying confirmed pullbacks rather than chasing price mid-range.
Keep trade size moderate — volatility can increase on Fed comments or geopolitical updates.
✅ Summary
Gold’s bullish trend remains intact, supported by Fed cut expectations and geopolitical risks. Trading plan: buy dips at 3757–3755 and 3742–3740, aiming for 3770–3780, while monitoring the 3813–3815 zone for short-term sell opportunities if rejection occurs.
📢 Follow MMFLOW TRADING on TradingView for intraday setups, liquidity-based strategies, and high-probability trade ideas tailored for global traders.

Gold Trading Plan: After Record High Pullback📊 Market Context
Gold is struggling to recover after the pullback from its all-time high near 3791 USD/oz. During the Asian session on Thursday, price action turned cautious as traders await US mid-tier data and further comments from Federal Reserve officials. While the long-term outlook remains bullish, in the short-term, XAU/USD faces potential liquidity sweeps and sharp volatility around key zones.
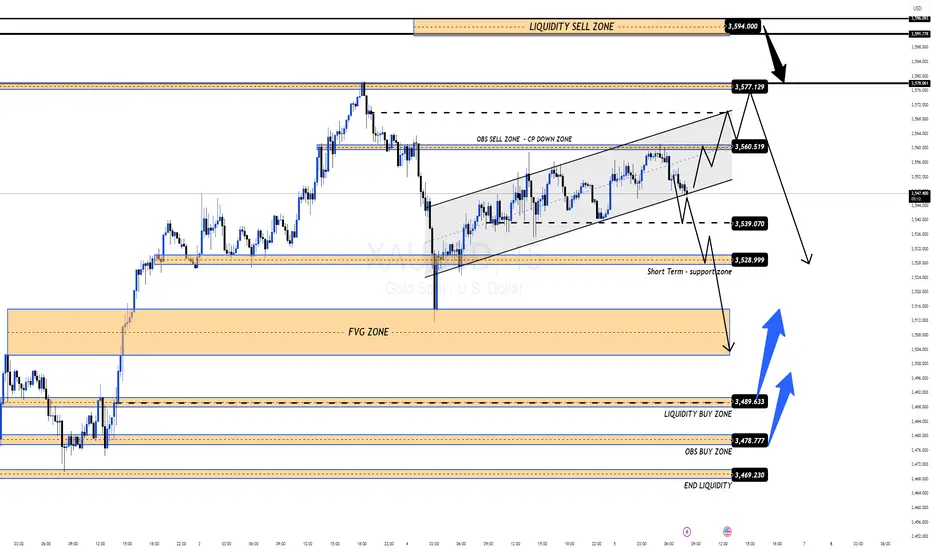
🔎 Technical Analysis (H1/H4)
ATH zone 3791 triggered heavy selling pressure.
Price is currently moving below the 3755–3757 downtrend reaction zone, signaling short-term weakness.
Strong demand/liquidity sits at 3712 and deeper at 3688–3686 (CP + OBS Buy Zone).
Sell-side liquidity lies at 3775–3777, likely to trigger reactions on retests.
A broader Liquidity Sell Zone is visible at 3824–3830, only valid if 3777 breaks cleanly.
🔑 Key Technical Levels
Resistance / Sell Zones: 3775–3777 - 3791 - 3824–3830
Support / Buy Zones: 3712 - 3688–3686
📈 Trading Scenarios & Plan
✅ BUY ZONE (priority): 3688–3686
SL: 3680
TP: 3696 - 3700 - 3705 - 3710 - 3720 - 3730 - …
✅ SELL ZONE (scalp): 3775–3777
SL: 3782
TP: 3770 - 3765 - 3760 - 3750 - 3740 - 3730 - …
⚠️ Risk Notes
Be careful with false breakouts at 3775–3777 before reversals.
Avoid chasing price in the middle of the range; wait for price action confirmations at zones.
US data and Fed speeches can bring volatility – adjust position sizes accordingly.
✅ Summary
Gold is consolidating after its sharp rally to 3791 ATH, waiting for new catalysts from the US and Fed. Main plan: buy dips at 3688–3686 aiming for 3720–3730, while a short-term sell opportunity at 3775–3777 remains valid if rejection signals appear. If bulls clear 3777, the upside opens towards 3824–3830 liquidity.
📢 Follow MMFLOW TRADING for real-time liquidity setups and BIGWIN strategies!

Daily Trading Plan: Liquidity Zones & Bullish Outlook📊 Market Context
Gold is holding strong after its breakout, trading near 3760 USD/oz as safe-haven demand stays elevated. The combination of geopolitical tensions, global fund flows into ETFs, and a weaker USD continues to support the bullish bias. For Indian traders, gold’s rally is closely watched as both an investment hedge and a short-term trading opportunity. While the broader structure remains bullish, price may first sweep liquidity in key zones before pushing towards higher levels.
🔎 Technical Analysis (H1/H4/2H)
Price recently tested 3760, confirming bullish momentum.
Immediate support: 3725, marked as a CP retest zone.
Stronger support: 3689–3690, overlapping with OBS + FVG demand zone.
Resistance targets: 3788 (short-term liquidity pool) and 3805–3830 (major liquidity area).
Overall structure: Still bullish, but likely to retest demand zones before the next leg higher.
🔑 Key Levels
Resistance / Sell Zones: 3760 ➡️ 3788 ➡️ 3805–3830
Support / Buy Zones: 3725 ➡️ 3689–3690
📈 Scenarios & Trading Plan
✅ BUY ZONE 1 (Shallow Pullback): 3725
SL: 3716
TP: 3760 ➡️ 3788 ➡️ 3805 …
✅ BUY ZONE 2 (Deeper Liquidity Retest): 3689–3690
SL: 3680
TP: 3725 ➡️ 3760 ➡️ 3788 ➡️ 3830 …
✅ SELL SCALP (Liquidity Trap Setup): Around 3788–3805, if rejection patterns confirm
SL: 3810
TP: 3775 ➡️ 3760 ➡️ 3740 …
⚠️ Risk Management Notes
Watch out for false breakouts above 3788 or below 3725 – liquidity sweeps are common.
Enter trades only after confirmation; avoid chasing price in the middle of the range.
Keep risk per trade controlled, as Fed speeches and geopolitical headlines could spark volatility.
✅ Summary
Gold remains in a strong uptrend, with 3788–3805 as the next upside magnet. The plan is to buy dips at 3725 or 3689–3690, while keeping an eye on potential short-term sell setups near 3788–3805. The bias stays bullish, but risk management is key.
📢 Follow MMFLOW TRADING for intraday updates, liquidity-based setups, and strategies tailored for global gold traders.

Fed Dovish Signals & Geopolitical Tensions Boost Gold📊 Market Context
Gold continues to receive solid support from the Fed’s dovish tone and rising geopolitical tensions. However, the USD has extended its rebound from multi-year lows, which may temporarily limit gold’s upside. Broader risk-on sentiment in financial markets could act as a short-term headwind for XAU/USD before the next round of Fed speeches. Still, the long-term bullish trend has re-emerged, and gold is positioned to challenge new all-time highs in the near term—an important signal for Indian traders watching for fresh momentum in precious metals.
🔎 Technical Analysis (H1/H4)
Price has broken above the descending trendline, confirming that bullish momentum has returned.
Short-term support: 3686–3684, maintaining this level preserves the bullish structure.
Additional support: 3670–3668, overlapping with CP and liquidity zones on the chart.
Key resistance: 3720–3722, a crucial reaction level for profit-taking or liquidity sweeps.
🔑 Key Levels
Resistance: 3707 ➡️ 3720
Support: 3685 ➡️ 3669 ➡️ 3658
📈 Scenarios & Trading Plan
✅ BUY ZONE 1: 3686–3684
SL: 3680
TP: 3690 ➡️ 3695 ➡️ 3700 ➡️ 3705 ➡️ 3710 ➡️ 3720 ➡️ …
✅ BUY ZONE 2: 3670–3668
SL: 3664
TP: 3675 ➡️ 3680 ➡️ 3690 ➡️ 3700 ➡️ …
✅ SELL ZONE (Liquidity Trap Watch): 3720–3722
SL: 3726
TP: 3715 ➡️ 3710 ➡️ 3705 ➡️ 3700 ➡️ …
⚠️ Risk Management Notes
Watch for false breakouts at 3720–3722 — price could sweep stops before reversing lower.
Only enter longs with price action confirmation at the buy zones; avoid chasing price mid-range.
Manage trade size carefully given potential volatility from Fed comments and geopolitical news.
✅ Summary
Gold’s long-term bullish trend is firmly back, supported by Fed dovishness and geopolitical factors—key drivers for India’s gold market sentiment. The plan focuses on buying dips at 3686–3684 and 3670–3668 targeting 3705–3720, while short-term selling at 3720–3722 is valid if rejection appears.
📢 Stay updated with MMFLOW TRADING on TradingView for fresh market insights and actionable setups tailored for gold traders

XAUUSD – Breakout Confirmed & Macro Outlook📊 Market Context & Macro View
Gold (XAUUSD) has broken out above its short-term descending trendline, signalling renewed bullish momentum after several sessions of consolidation. This breakout aligns with traders pricing in slower US inflation and growing confidence that the Federal Reserve may pause or ease monetary policy in the coming months.
🔹 Macro Drivers Supporting Gold:
Soft US CPI & PPI → Cooling inflation strengthens expectations for stable or lower rates.
Steady Treasury yields and a weaker USD continue to fuel gold’s upside.
Geopolitical tensions and central bank accumulation remain long-term bullish factors.
⚠ Risk: Liquidity sweeps remain possible before the Fed meeting—watch for fakeouts or sharp reversals.
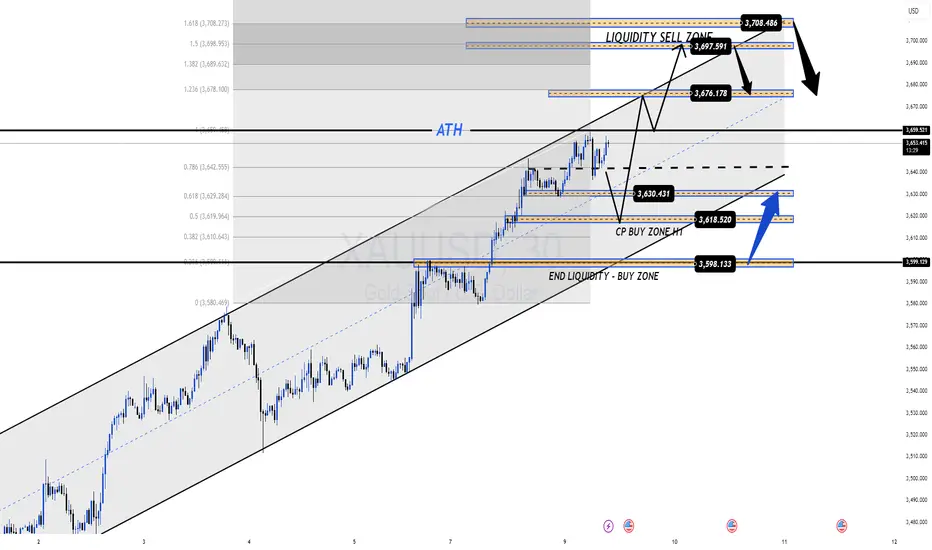
🔑 Key Technical Levels (H1)
Immediate Resistance: 3,654.17 (React Zone FIB)
OBS Sell Zone: 3,664.52
Upper Liquidity Target: 3,679.31
Major Sell Liquidity: 3,709.85
Supports / Buy Liquidity Zones:
• 3,637.91 – Breakout Retest
• 3,631.63 – CP Support
• 3,622.41 – Deeper Liquidity Layer
• 3,584.78 – END Liquidity BUY ZONE
📈 Scenario & Outlook
London Session: Possible retest at 3,638–3,632 for liquidity collection before the next leg higher.
A clean break through 3,654 → 3,664 could spark strong buying toward 3,679–3,709.
Losing 3,622 would expose 3,584 as the next major support.
📌 Trading Plan
🔵 BUY ZONE 1: 3,635 – 3,633
SL: 3,629
TP: 3,640 → 3,645 → 3,650 → 3,660 → 3,670 → ???
🔵 BUY ZONE 2: 3,621 – 3,619
SL: 3,615
TP: 3,625 → 3,630 → 3,635 → 3,640 → 3,650 → 3,660 → ???
🔴 SELL ZONE: 3,708 – 3,710
SL: 3,715
TP: 3,704 → 3,700 → 3,695 → 3,690 → 3,680 → ???
🔴 SELL SCALP: 3,679 – 3,681
SL: 3,685
TP: 3,675 → 3,670 → 3,665 → 3,660 → ???
✅ Summary
Gold is maintaining its breakout, supported by softer US inflation and a weaker USD. While liquidity sweeps may occur, the overall trend remains bullish above 3,622.
👉 Follow MMFLOW TRADING for real-time updates, liquidity plays, and BIGWIN setups as gold reacts to key macro drivers and price zones.

XAUUSD – CPI Today: Liquidity Sweep & Trading Plan📊 Market View
Gold (XAUUSD) is moving under short-term resistance (descending trendline), indicating sellers still dominate in the short term. On the M30 chart, buy-side liquidity zones are clearly stacked at 3,624 → 3,612 → 3,599 → 3,586.
👉 During the European session, expect a breakdown liquidity sweep toward these support zones before any bullish reaction.
📈 CPI View – US Session
Soft CPI (below expectations) → Weaker USD, lower yields → Gold could bounce sharply from 3,612 / 3,599 / 3,586 and retest trendline/resistance.
Hot CPI (above expectations) → Stronger USD, higher yields → Gold may break 3,612, sweep deeper to 3,599 or 3,586, then recover.
⚠️ High risk of news traps: the first reaction can reverse quickly—wait for retests + confirmation candles before entering.
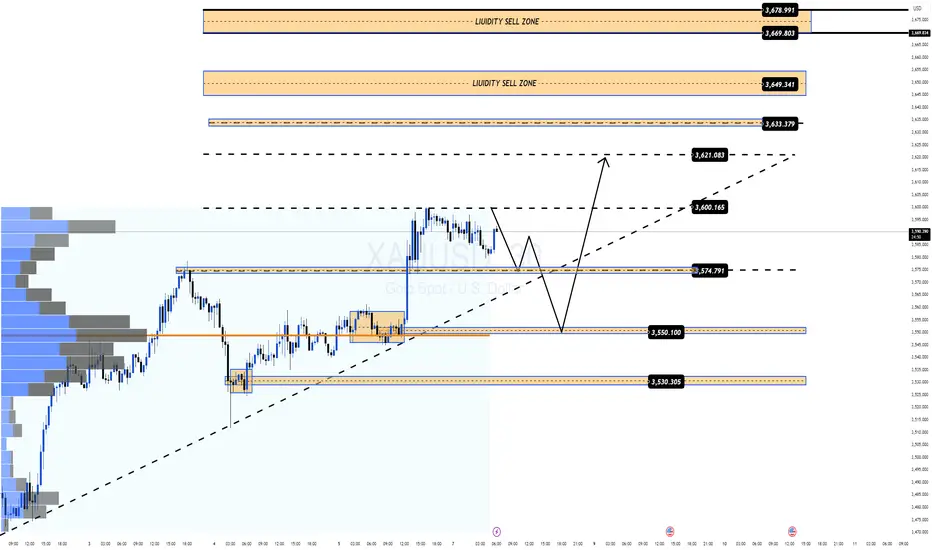
🔑 Key Levels
Dynamic Resistance (trendline): 3,643 – 3,646
React Zone FIB: 3,650 – 3,654
OBS Sell Zone: 3,665
Support / Liquidity Zones:
3,624.36 (Key Zone Support BUY)
3,612.60 (CP/React FIB)
3,599.31 (BUY ZONE)
3,586.49 (END LIQUIDITY – BUY ZONE)
📌 Trading Plan
🔴 SELL ZONE: 3,646 – 3,648
SL: 3,652
TP: 3,640 → 3,635 → 3,630 → 3,620 → 3,610 → ???
🔵 BUY SCALP: 3,612 – 3,610
SL: 3,605
TP: 3,616 → 3,620 → 3,625 → 3,630 → ???
🔵 BUY ZONE (Primary): 3,600 – 3,598
SL: 3,592
TP: 3,605 → 3,610 → 3,615 → 3,620 → 3,630 → 3,640 → ???
🛡️ Backup BUY: (If liquidity sweep deepens) 3,58x
Hard SL: 3,578
❗ If 3,578 breaks, don’t re-enter immediately—CPI volatility can extend the move further.
⚠️ Notes & Risk
Reduce position size near the CPI release.
Wait for confirmation (pin bar / engulfing / retest) before entering trades.
Use staggered TPs to lock in profits early.
An M30 close above 3,654 invalidates near-term shorts and opens 3,665.
✅ Summary
Gold may sweep liquidity into the buy zones before bouncing. Trade the reaction: SELL at 3,646–48 on rejection, BUY at 3,612/3,600 on a clean bounce, and hold a backup BUY at 3,58x with tight risk.
👉 Follow MMFLOW TRADING for real-time updates and BIGWIN setups during CPI volatility.

XAUUSD – PPI Ahead: Key Liquidity Levels & Trading PlanMarket View:
After yesterday’s sharp drop where sellers dominated the liquidity zone, gold (XAUUSD) is now recovering from 362x → 364x during the Asian session. In the short term, price may range between 362x–365x in Asia/Europe before going sideways to await the PPI release in the US session.
Today’s PPI is expected at 0.3% vs 0.9% previous, signalling cooling inflation. However, actual data could come in higher – often creating a “news trap”. From a technical view, gold may need to retest 360x liquidity before resuming its uptrend ahead of CPI & the upcoming FED meeting.
👉 In short: Structure stays bullish, but short-term liquidity sweeps are likely before continuation.
Key Levels:
Resistance: 3647 – 3654 – 3665 – 3674 – 3704
Support: 3635 – 3613 – 3600 – 3586
Trading Plan:
🔵 BUY Zone: 3600 – 3598
SL: 3592 (or tighter at 3580)
TP: 3605 → 3610 → 3615 → 3620 → 3630 → 3640 → 3650+
🔴 SELL Zone: 3703 – 3705
SL: 3710
TP: 3698 → 3694 → 3690 → 3680 → 3670 → 3660+
Summary:
✅ Gold remains in an uptrend, but may retest 360x liquidity before heading higher.
✅ PPI today & CPI tomorrow could trigger traps – caution is advised.
👉 Watch the key levels and follow MMFLOW TRADING for daily updates & BIGWIN setups!

XAUUSD – Intraday Plan: Bullish Trend + Key Liquidity ZonesMarket Pulse:
The US jobs data (05/09) showed a slowdown in hiring. According to CME FedWatch, there is an 88% chance of a 0.25% Fed rate cut in September, and 12% for a 0.5% cut. Lower rates support gold as a non-yielding asset.
Gold has already gained 38% YTD, after rising 27% in 2024. A weaker USD, central bank buying (China added gold for the 10th month in a row in August), loose monetary policy, and global risks keep gold in a strong bullish trend.
👉 Market bias: Macro + liquidity flows favour BUY.
Technical View (M30):
Price stays in an up channel, making higher lows.
3616–3596 is the key support zone.
Liquidity SELL zones at 3653–3655 and 3675–3677 may give short intraday pullbacks before trend continues.
Execution Plan (Today):
🔵 BUY ZONE #1: 3618 – 3616
SL: 3610
TP: 3624 → 3630 → 3635 → 3640 → 3650 → 3660 → 3670+
🔵 BUY ZONE #2: 3598 – 3596
SL: 3590
TP: 3602 → 3606 → 3610 → 3615 → 3620 → 3630 → 3640 → 3650+
🔴 SELL ZONE #1: 3653 – 3655
SL: 3660
TP: 3648 → 3644 → 3640 → 3635 → 3630 → 3620
🔴 SELL ZONE #2: 3675 – 3677
SL: 3681
TP: 3670 → 3665 → 3660 → 3650 → 3640
Summary:
✅ Gold trend stays bullish – best setups are buying dips into liquidity zones.
⚡ Intraday scalps possible at SELL liquidity zones.
👉 Follow MMFLOW TRADING for daily precision setups.
XAUUSD – Weekly Trading Plan: Bulls Still in Control MMFLOW TRADING PLAN XAUUSD
Market View:
Gold (XAUUSD) is trading exactly as expected from our weekly outlook. After the big Nonfarm push near $3600/oz ATH, price is consolidating around 357x–358x while holding the rising trendline. Both Daily and Weekly charts remain bullish, showing that buyers are still strong. The bias for this week stays upside, but volatility can come from key US data (PPI, CPI, Jobless Claims, UoM Sentiment).
Technical Outlook (H1 Chart):
Structure is bullish as long as price holds above 3550.
If 3592 breaks cleanly → more upside towards 3620–3640+.
If 3575 or 3530 breaks → expect a pullback before buyers return.
Trading Plan:
🔵 BUY ZONE: 3552 – 3550 | SL: 3544 | TP: 3556 → 3560 → 3565 → 3570 → 3575 → 3580 → ????
🔵 BUY SCALP: 3573 – 3571 | SL: 3567 | TP: 3578 → 3582 → 3586 → 3590 → ????
🔴 SELL SCALP: 3598 – 3600 | SL: 3604 | TP: 3595 → 3590 → 3585 → 3580 → 3570 → 3560 → ????
🔴 SELL ZONE: 3631 – 3633 | SL: 3638 | TP: 3626 → 3622 → 3618 → 3614 → 3610 → 3600 → ????
Summary:
✅ Gold remains in a strong uptrend.
👉 Watch 3592 (bullish trigger) and 3575 (bearish trigger) – these levels will decide the next big move.
Follow MMFLOW TRADING for daily setups and updates.
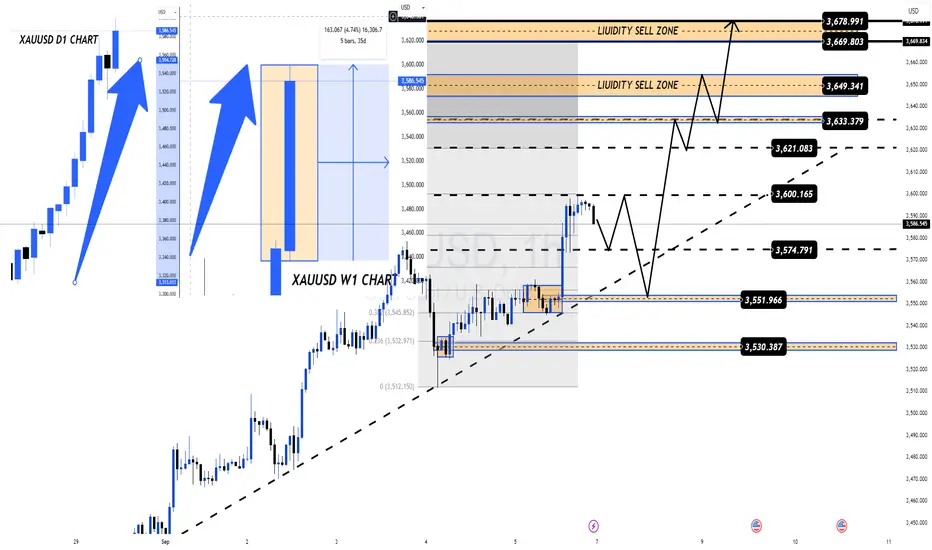
Weekly Outlook: Big Bullish Move + Key US DataMarket View:
Gold (XAUUSD) finished the week with strong momentum after Nonfarm pushed price close to $3600/oz ATH. On the daily chart, the candle closed almost full body (only ~30% wick), showing no profit-taking yet. The weekly chart is also strongly bullish – confirming that buyers are in control. This signals more upside likely in the coming week and month.
Key US Events This Week:
Wed, Sep 10: Core PPI & PPI m/m → If higher than expected, USD may strengthen short-term, creating pressure on gold.
Thu, Sep 11: CPI (Core, m/m, y/y) + Jobless Claims → the most important release. Lower CPI + higher claims = bullish for gold. Higher CPI = hawkish Fed = pressure.
Fri, Sep 12: UoM Consumer Sentiment & Inflation Expectations → could shift Fed outlook further.
👉 Fundamentals may bring volatility, but overall medium-term trend remains bullish.
Technical Outlook (H1 Chart):
After the Nonfarm breakout, gold is consolidating sideways. Levels to watch:
Support: 3574 – 3551 – 3530 – 3516
Resistance: 3600 – 3621 – 3633 – 3649 – 3669 – 3678
Trading Plan:
BUY bias (preferred):
Long on dips near 3574–3550
SL: below 3530
TP: 3600 → 3621 → 3633 → 3649 → 3669 → 3678
SELL scalp (alternative):
Only if 3530 breaks with strong CPI surprise → target 3516/3527
Summary:
✅ Gold stays in a strong uptrend on Daily & Weekly charts. Macro factors support more upside if inflation keeps easing.
👉 Watch 3592 (bullish trigger) and 3575 (bearish trigger) as the key decision levels.
Follow MMFLOW TRADING for daily plans and quick updates.
XAUUSD Daily Trading Plan Ahead of NFP | MMFLOW TRADINGGold (XAUUSD) has slowed down after a strong bullish rally and is now consolidating in a sideways range 355x – 354x, waiting for today’s Non-Farm Payrolls (NFP) data to set the next major move.
📊 Macro View:
If NFP comes out better than expected, USD strength could push Gold lower into 352x – 350x zones, filling liquidity gaps before buyers step in.
If NFP is worse than forecast, Gold may break above ATH 357x and test higher liquidity zones near 3594+.
🔑 Key Resistance Levels
3560 – 3576
3594
🔑 Key Support Levels
3540
3528 – 3514
3502 – 3488 – 3478
📌 Trade Setups (MMFLOW Trading View)
🔵 BUY Zone: 3488 – 3486
🔴 SL: 3480
✔️ TP: 3492 – 3496 – 3500 – 3510 – 3520 – 3530 – 3540 – ????
🔵 BUY Scalp: 3528 – 3526
🔴 SL: 3520
✔️ TP: 3532 – 3536 – 3540 – 3550 – 3560 – ????
🔴 SELL Scalp: 3574 – 3576
🔴 SL: 3580
✔️ TP: 3570 – 3565 – 3560 – 3550 – 3540 – 3530 – ????
🔴 SELL Zone: 3593 – 3595
🔴 SL: 3600
✔️ TP: 3588 – 3584 – 3580 – 3570 – 3560 – 3550 – ????
📊 MMFLOW Trading View:
Gold is building momentum inside the 3540 – 3565 range.
Break below 3540 → correction towards 352x – 350x.
Break above 3565 → retest of 357x – 3595 supply zone.
Best setups are waiting for price reaction near 3515 – 3528 (Buy Zone) or 3576 – 3595 (Sell Zone).
Bearish Pressure Builds: Gold Poised for More RetreatGold retreated sharply today as expected, and directly hit my expected retracement target of 3520-3510 area; the lowest point happened to be around 3511. We added a lot of short positions around 3575 and 3578 overnight, which helped us to make considerable profits during the gold retreat. All short positions made a total profit of 1830pips after being closed.
Since gold has begun to retreat from 3578, and the retracement has reached 670 pips in the short term, a retracement that is rare in recent times, as gold has shown obvious signs of retreat, once large funds begin to withdraw, it may trigger serious selling sentiment in the market. Taking this opportunity, the gold market may usher in a round of sharp correction. Moreover, after gold retreats, 3578 is expected to become the interim peak, which will limit the room for gold to rebound while being conducive to the downward pressure on gold.
In addition, gold rose sharply before the NFP market, probably to reserve room for the NFP market to fall, so I think gold still has the demand and space to continue to retreat, so the current decline has not ended yet, and I think the current short-term rebound provides us with good conditions for entering the short market.
According to the current structure, gold still needs to retreat after fluctuating at high levels. Therefore, in trading, we can still look for suitable opportunities to short gold during the gold rebound. First of all, we need to pay attention to the short-term resistance area of 3545-3555. Once gold cannot effectively stand in this area during the rebound, gold will also test the 3510-3500 area. After falling below this area, it is expected to continue to the 3490-3480 area.

GOLD Daily Plan – Sideway before ADP & NFP | MMFLOW TRADINGAfter yesterday’s strong rally, Gold (XAUUSD) corrected by over 60 Prices, moving back to the VPOC 3537 zone. This pullback indicates a potential short-term ATH near 357x, where SELL positions were shaken out and BUY positions booked profits.
Currently, Gold is consolidating ahead of ADP today and NFP tomorrow. With ADP expected at 73K vs. 104K previously, weaker job data could pressure USD and provide upside momentum for Gold.
The 60+ point drop highlights profit-taking by institutions and created liquidity gaps on both sides, bringing price into the 353x–354x sideway zone. A clear breakout of this zone will decide today’s trend direction.
🔑 Key Resistance Levels
3540 – 3548 – 3560 – 3576
🔑 Key Support Levels
3526 – 3515 – 3502 – 3490 – 3476
📌 Trade Setups (MMFLOW Trading View)
🔵 BUY Scalp: 3502 – 3500
🔴 SL: 3494
✔️ TP: 3506 – 3510 – 3520 – 3530 – 3540 – ???
🔵 BUY Zone: 3477 – 3475
🔴 SL: 3470
✔️ TP: 3485 – 3495 – 3500 – 3510 – 3520 – 3530 – 3540 – 3550 – ???
🔵 SELL Scalp: 3559 – 3561
🔴 SL: 3566
✔️ TP: 3554 – 3550 – 3540 – 3530 – 3520 – 3510 – 3500 – ???
🔵 SELL Zone: 3574 – 3576
🔴 SL: 3580
✔️ TP: 3570 – 3560 – 3550 – 3540 – 3530 – ???
📊 MMFLOW TRADING View:
Today’s outlook suggests continued correction before ADP/NFP releases. Sideway accumulation dominates between 353x–354x, but whichever side breaks first will set the day’s direction.

GOLD crosses $3500! What’s next for Indian traders?Gold (XAUUSD) has shown massive momentum, moving nearly 50–60 points daily. Price is now reacting at an important FIBO extension level. Sellers are stepping in, but so far there is no strong confirmation on higher timeframes (H1–H2).
📊 MMFLOW VIEW
Sideways consolidation → Breakout → New ATHs every day.
Liquidity & FVG zones are still favoring the BUY side.
SELL is only safe when higher timeframe volume confirms.
For now: Focus on BUY entries from liquidity zones.
🔑 KEY LEVELS
Resistance: 3440–3446 (ATH) | 3564 | 3576 | 3586 | 3595
Support: 3528 | 3508 | 3494 | 3480 | 3468
🎯 MMFLOW PLAN
✅ BUY ZONE: 3481 – 3479
SL: 3474
TP: 3486 – 3490 – 3495 – 3500 – 3510 – 3520 – 3530 – ???
✅ BUY SCALP: 3496 – 3494
SL: 3490
TP: 3500 – 3510 – 3520 – 3530 – 3540 – ???
❌ SELL ZONE: 3576 – 3578
SL: 3584
TP: 3570 – 3565 – 3560 – 3555 – 3550 – 3540 – 3530 – 3520 – 3510 – 3500
⚠️ Important for Indian traders: GOLD is extremely volatile right now. Don’t rush into trades.
👉 Wait for confirmation at Key Levels, use proper Risk Management, and target smart entries for maximum profit.
🔥 This is the MMFLOW TRADING PLAN – Follow us on TradingView for daily GOLD strategies and never miss the next big move!

Gold on Fire – Will XAUUSD Keep Breaking Higher?Gold (XAUUSD) is showing unstoppable momentum this month. With the US Dollar Index (DXY) weakening and markets expecting the Federal Reserve to cut interest rates, investor sentiment is shifting away from holding cash. For Indian traders, this means one thing: Gold is the ultimate safe-haven play right now.
🔎 Macro View
FED rate cut expectations → Pressure on USD → Bullish for Gold.
Risk sentiment: Investors worldwide are running to gold for safety.
With strong global inflows, gold could continue to make new all-time highs (ATHs) in the coming months.
📊 Technical Outlook (H1/H4)
Gold has been forming sideway accumulation zones followed by strong breakouts. This shows volume and market flow still favor bulls.
BUY ZONE:
3482 – 3480
SL: 3474
TP: 3486 – 3490 – 3495 – 3500 – 3505 – 3510 – 3520 – 3530 – 3540 – ???
SELL ZONE (only for short-term counter-trade):
3540 – 3542
SL: 3548
TP: 3530 – 3520 – 3510 – 3500 – ???
At the moment, there are no strong signals for selling. Trend bias = BUY on dips until we see sentiment reversal.
⚠️ Risk Note
The market is highly volatile right now with sudden liquidity sweeps. Always stick to TP/SL discipline to protect your account.
💡 Conclusion:
Gold remains in a powerful bullish trend, supported by both macro and technical factors. For Indian traders, the best strategy is to stay aligned with the bulls — buy dips and ride the wave.
✅ Follow MMFLOW TRADING for daily market plans and gold insights. Let’s capture this historic rally together!

Gold Surges $70+ – Is XAUUSD Ready for the Next Big Move?🔥 Market Update
Gold (XAUUSD) just made a massive rally of more than $70, shaking the entire trading community.
The rise in geopolitical tensions is pushing safe-haven demand to extreme levels, and gold has once again become the most-watched asset worldwide.
For Indian traders, where gold holds not just market value but also cultural importance, this move is a wake-up call – volatility is at its peak, and discipline is key.
🔎 Macro Outlook
🌍 Global geopolitical risks → Strong inflows into gold as a safe haven.
💵 USD and bond yields are not enough to stop buyers rushing to gold.
📊 Upcoming US PCE data & Fed decisions could bring even bigger swings.
📊 Technical View (H4)
After the sharp rally, gold built a base around CP Zone H4 before breaking out again.
Key Support Levels
3,462 – 3,443 → Must hold to keep the bullish structure intact.
Key Resistance Levels
3,487 – 3,518 → Likely area for pullback or reaction.
A clean break could target 3,536+ next.
📌 Possible Market Scenarios
✅ Scenario 1 (Preferred)
Price holds above 3,462 → Tests 3,511 – 3,518 and can push towards 3,536.
⚠️ Scenario 2 (Deeper Pullback)
Break below 3,462 → Retest of 3,443 before buyers step back in.
🎯 Trade Plan (Reference Only)
✅ BUY ZONE 1
Entry: 3453 – 3451
SL: 3446
TP: 3460 – 3465 – 3470 – 3475 – 3480 – ???
✅ BUY ZONE 2
Entry: 3444 – 3442
SL: 3438
TP: 3450 – 3460 – 3470 – 3480 – ???
❌ SELL ZONE
Entry: 3512 – 3514
SL: 3518
TP: 3505 – 3500 – 3495 – 3490 – 3480 – 3470
💡 Key Takeaways for Indian Traders
Gold is in a powerful uptrend, driven by global uncertainty.
But after such a sharp move, a technical pullback is very possible.
Best approach now:
✔️ Wait for dip-buying opportunities near strong supports.
✔️ Respect stop loss – capital protection comes first.
✔️ Keep an eye on global news that can spark instant volatility.
This is the kind of market where patience + discipline = survival and profit. 🚀

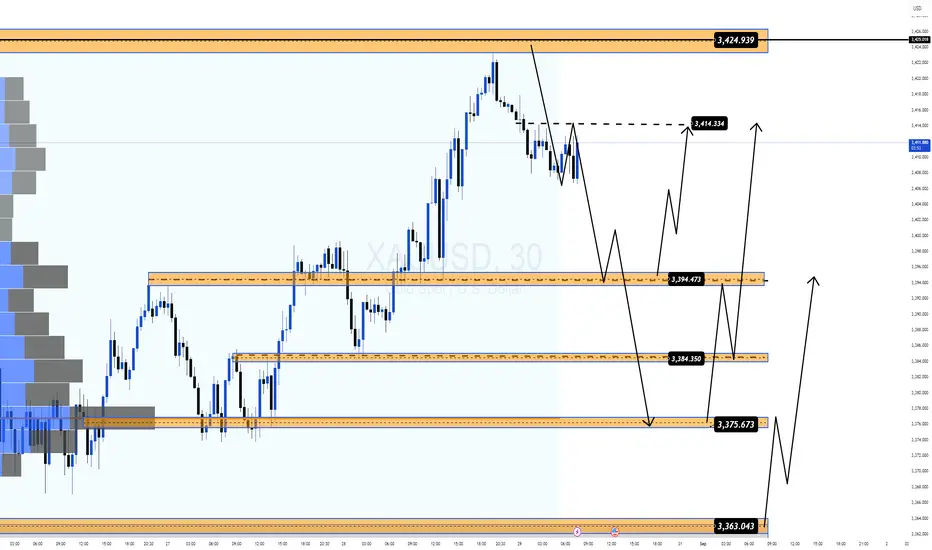
XAU/USD – End-of-Month Trading Strategy | MMFlow TradingGold is entering a short-term correction phase as we close the month. Looking at historical data, in the last 4 months, Gold has shown deep liquidity sweeps at month-end before continuing its upward rally. Today, we could see a similar setup.
📊 Market Context:
Month-end candles often create long wicks (343x → 335x).
If price breaks below 3395, we could see deeper liquidity grabs.
US Session has PCE Data release – expected to match the previous reading. This may trigger short-term volatility, providing opportunities for intraday traders.
📌 Key Levels
🔺 Resistance (Sell Zone)
3434 – 3436 → Short-term selling opportunity.
3424 – 3435 → A breakout here opens the path to new highs.
🔻 Support (Buy Zone)
3395 – 3390 → Important intraday liquidity zone.
3376 – 3374 (VPOC Area) → Strong demand zone, likely to attract buyers.
3363 – 3355 (Deep Liquidity Zone) → Extreme scenario, less likely without major news.
📌 Trade Plan
✅ Long Setup (Buy Zone)
Entry: 3376 – 3374
Stop Loss: 3369
Targets: 3380 – 3385 – 3390 – 3400 – 3410 – 3420 – ???
🎯 This aligns with the VPOC zone, highly probable for bullish reaction.
✅ Short Setup (Sell Zone)
Entry: 3434 – 3436
Stop Loss: 3440
Targets: 3430 – 3425 – 3420 – 3410 – 3400
⚠️ Short trades are better executed in Asian & European sessions to catch the correction move before US volatility.
📍 Summary:
Watch 3395 – 3375 closely → if this holds, September could bring strong bullish momentum.
Month-end dips are often the best opportunities to position for the next ATH rally.
Patience + precise levels = high probability setups.
🔥 Stay tuned with MMFlow Trading for precise institutional-style analysis & real-time market insights.
XAU/USD – Big Move Loading? Liquidity Grab Before the Next RallyGold has been holding strong at higher levels, consolidating near resistance without showing a real liquidity sweep yet. With key US data coming in (Prelim GDP q/q & Unemployment Claims), the market could be setting up for a sharp correction first – before the next bullish leg in September, especially as USD weakens and Fed rate cuts get closer.
🔑 Key Levels to Watch
Resistance: 3400 → A breakout can quickly push Gold to 342x – 343x, retesting old ATH.
Support: 3370 → A breakdown can send price into the 335x BUY Zone for a clean long setup.
📌 MMFLOW Trading Plan
✅ BUY ZONE
3356 – 3354
SL: 3349
TP: 3360 → 3365 → 3370 → 3375 → 3380 → 3390 → 3400+
❌ SELL ZONE
3424 – 3426
SL: 3430
TP: 3420 → 3395 → 3390 → 3385 → 3380 → 3370
🎯 MMFLOW View
End of month often comes with liquidity flushes before the market decides its next big move. Watch for a potential drop into 335x as a golden buying opportunity before Gold makes a run at new highs.
👉 Trade with discipline. Stick to Key Levels. No FOMO.
🔥 What do you think traders?
Will Gold break 3400 first or flush to 335x for the perfect buy?
👇 Drop your views in the comments – let’s analyze together!

XAU/USD Trading Plan – Gold Eyes 3400! 🚀Gold continues to hold its bullish momentum as the USD weakens, and buyers are stepping in with strong FOMO-driven demand. However, a short-term correction (1–2 days) is still possible before the next big leg higher.
The smart play? ⚡ Wait for clean pullbacks into strong liquidity zones — buy low, hold, and ride the trend.
📊 Short-Term View (M15–H1)
Break below 337x could push Gold quickly down to 335x–334x to fill liquidity gaps.
Bigger picture remains bullish with a potential run to 3400 and beyond.
🔑 Key Levels
Support: 3363 – 3356 – 3349 – 3335
Resistance: 3385 – 3391 – 3402 – 3425
🎯 Trading Plan
✅ Buy Setups
Scalp Buy: 3356 – 3354
SL: 3350
Targets: 3360 → 3365 → 3370 → 3375 → 3380 → 3390 → 3400+
Swing Buy Zone: 3336 – 3334
SL: 3330
Targets: 3340 → 3350 → 3360 → 3380 → 3400+
❌ Sell Setups
Scalp Sell: 3385 – 3387
SL: 3390
Targets: 3380 → 3375 → 3370 → 3365 → 3350
High-Risk Sell Zone: 3401 – 3403
SL: 3407
Targets: 3396 → 3390 → 3380 → 3370
📌 Takeaway
Gold is still bullish overall, but short-term dips are healthy and provide the best entry points. Stay patient, wait for price action to confirm at key support, and let the market pay you.

XAU/USD - H4 Downtrend Broken – Watch Key Liquidity Zones!MMFLOW Trading Plan | 26 Aug 2025 ⚡
💰 Gold looks ready for a strong move!
Gold has smashed through the H4 downtrend line, showing strong buying pressure and clear liquidity sweeps. This signals a potential bullish continuation. ⚠️ Be aware: wide support zones below may trigger quick pullbacks as liquidity gets collected.
📊 Market Snapshot (India Focus)
USD is losing strength amid political uncertainty and Fed moves
Trump’s efforts to influence lower interest rates are indirectly supporting gold
H4 downtrend line broken → buyers are in control
Short-term: expect sideways swings + liquidity tests
Watch for fast spikes – FOMO buy zones are usually targeted
⚡ Key Levels to Watch
Resistance: 3378 → 3384 → 3400
Support: 3363 → 3354 → 3340
🔥 Trading Scenarios
BUY SCALP (Short-Term Quick Trade)
Entry: 3355 – 3353
Stop Loss: 3349
Targets: 3360 → 3365 → 3370 → 3380 → 3390 → 3400+
BUY ZONE (Swing / Longer-Term Trade)
Entry: 3341 – 3339
Stop Loss: 3335
Targets: 3345 → 3350 → 3355 → 3360 → 3365 → 3370 → 3380 → 3390 → 3400+
SELL SCALP (Quick Reversal)
Entry: 3382 – 3384
Stop Loss: 3388
Targets: 3378 → 3374 → 3370 → 3365 → 3360 → 3350
SELL ZONE (High Risk / Big Moves)
Entry: 3400 – 3402
Stop Loss: 3406
Targets: 3395 → 3390 → 3385 → 3380 → 3370 → 3360
⚠️ Risk Notes
Expect rapid drops or spikes – stops can trigger fast
Sideways movement likely during sessions + retests of highs
Only trade when price action confirms key levels
🎯 Key Takeaways for Indian Traders
Gold is poised for a strong bullish continuation, but quick pullbacks will happen to collect liquidity
Use support / liquidity zones for entries and resistance zones for exits
MMFLOW = Market Rules | Key Levels = Profit

Gold Weekly Plan: Correction or New Rally Ahead? 🇮🇳Gold surprised everyone last week with a strong rally after the Jackson Hole symposium. The weakness in USD gave bulls fresh momentum, and now traders are once again eyeing the possibility of a new ATH in the coming weeks.
But remember — after every big impulse, the market loves to test patience. A short-term correction is possible before the next strong leg up. This is where smart traders prepare, while emotional traders often get trapped.
📊 Technical Outlook (H4 Chart)
Gold is moving inside a tight triangle pattern, signaling that a breakout is close.
Friday’s bullish candle shows the market still favors buyers, but watch out: gold often dips lower before making a major breakout move.
The strategy? Stay disciplined and only enter at confirmed Key Levels.
📌 Key Levels to Watch
Resistance: 3370 – 3383 – 3400 – 3425
Support: 3350 – 3340 – 3326 – 3315
🔥 Trading Plan (MMFlow Strategy)
BUY ZONE 🟢
Entry: 3340 – 3338
SL: 3334
Targets: 3345 – 3350 – 3355 – 3360 – 3370 – 3380 – 3390 – 3400+
SELL ZONE 🔴
Entry: 3400 – 3402
SL: 3407
Targets: 3395 – 3390 – 3385 – 3380 – 3375 – 3370
✨ Question for Indian Traders: Do you think Gold will retest supports first or break 3400 directly? 🚀
