XAUUSD Bullish Breakout! Ready to Ride Gold’s Pre-FOMC Pump? XAUUSD Bullish Breakout! Ready to Ride Gold’s Pre-FOMC Pump? 🇮🇳
Subheader:
Gold surged past short-term resistances overnight – here’s a clear plan for Indian traders to scalp, swing, and ride the bullish momentum safely.
📊 Market Outlook – MMFLOW India Edition
Primary Bias: Bullish – Buy the dips
Key Observations:
Gold broke through the descending trendline and short-term resistance in a single session.
Early pre-FOMC breakout confirms strong bullish momentum.
Market cleared liquidity below and reclaimed higher zones – bullish case remains strong.
Scenarios:
🔹 Buy near strong support zones (dip-buying opportunities)
🔹 Tactical sells only at confirmed resistance with clear rejection
Technical Insight (Daily Chart):
Strong bullish confirmation candle – pullbacks are ideal reload points for long positions.
🔥 Trading Plan – Buy/Sell Zones & Scalp Strategy
✅ BUY SCALP
Entry: 3333 – 3331
Stop Loss: 3327
Take Profit: 3338 – 3343 – 3348 – 3352 – 3356 – 3360
✅ BUY ZONE (Swing / Positional Trades)
Entry: 3316 – 3314
Stop Loss: 3310
Take Profit: 3320 – 3325 – 3330 – 3335 – 3340 – 3350 – 3360
🔻 SELL ZONE (Tactical)
Entry: 3368 – 3370
Stop Loss: 3375
Take Profit: 3364 – 3360 – 3355 – 3350 – 3345 – 3340 – 3330
📌 Key Levels to Watch
Support Levels: 3332 – 3323 – 3315
Resistance Levels: 3348 – 3362 – 3370 – 3383
🚨 Risk Note for Indian Traders
If price dips deep into 331x, watch out for liquidity traps.
Always stick to TP/SL rules – volatility is high around FOMC events.
✨ MMFLOW Reminder
Key Levels = Profits
Buy the dips, ride the bullish momentum
💡 Pro Tips for TradingView India Users
Bookmark support & resistance zones
Observe liquidity sweeps before major news
Use scalp or swing strategies depending on your timeframe
Goldtradingstrategy

Gold Price Awaits FOMC – Liquidity Levels in PlayGold price continued to slide into liquidity zones during the late US session yesterday and reacted perfectly at the MMFLOW BUY ZONE 3314 – 3316, delivering over +70 pips profit to traders ✅.
At present, on M5–M15, Gold is showing signs of a short-term recovery. However, for a strong upside move, buyers must break through the 3320 – 3322 resistance zone. A confirmed breakout here could trigger momentum towards higher KeyLevels, allowing price to retest important supply zones.
📈 Upside Targets (Intraday): 333x and 334x remain the key areas to watch for take-profits or potential reversal setups.
🔔 Why This Week Matters – The FOMC Decision
The highlight of the week is the FOMC meeting during the US session. Markets are awaiting clarity on the Fed’s next move. Any hint towards a September rate cut could trigger massive bullish momentum, breaking Gold out of its corrective channel.
👉 Asian & European sessions: Focus remains bullish toward 333x – 334x, with potential SELL setups at resistance.
⚠️ US session with FOMC: Expect extreme volatility – risk management is critical.
📉 MMFLOW Technical Trading Plan
🔹 BUY Scalp Setup
Entry: 3311 – 3309
SL: 3305
TP: 3315 → 3320 → 3325 → 3330 → 3340 → 3350 → 3360+
🔹 BUY Zone (FOMC Plan)
Entry: 3290 – 3288
SL: 3282
TP: 3295 → 3330 → 3335 → 3340 → 3350 → 3360 → 3370+
🔸 SELL Scalp Setup
Entry: 3342 – 3344
SL: 3348
TP: 3338 → 3332 → 3328 → 3324 → 3320
🔸 SELL Zone (FOMC Plan)
Entry: 3360 – 3362
SL: 3368
TP: 3355 → 3350 → 3345 → 3340 → 3330
⚠️ Key Notes for Indian Traders
FOMC = high volatility event – manage your exposure carefully.
Stick to strict TP/SL discipline to protect capital.
Smart traders know: KeyLevels = Profits ✅
🔥 Follow MMFLOW TRADING for daily Gold price analysis, liquidity maps, and Smart Money insights – designed for Forex & Gold traders in India.

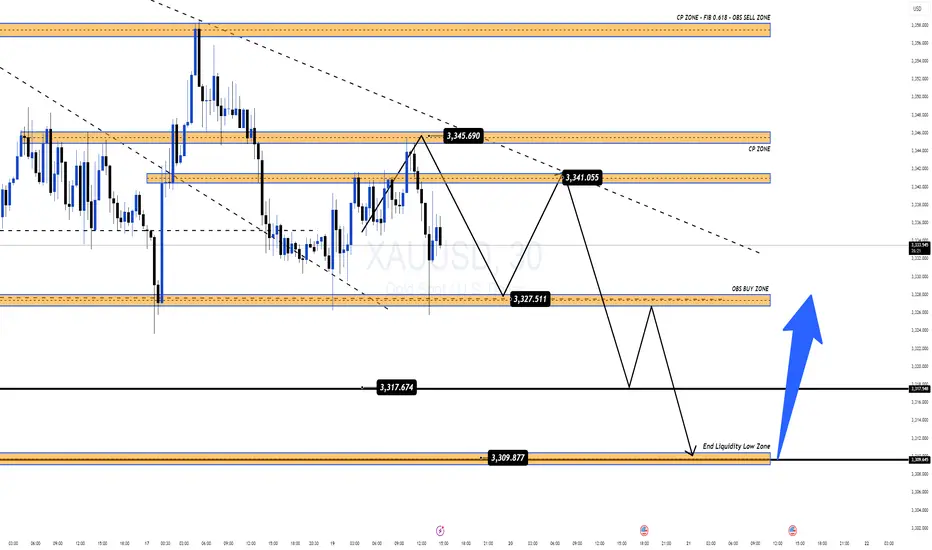
Gold Consolidates Ahead of FOMC Liquidity SweepGold is currently moving within a narrow range, with downside pressure becoming increasingly evident. With just over a day left before the FOMC meeting – an event that could shape the next major trend – the market seems to be preparing for a sharp liquidity sweep.
👉 At first glance, price action looks frustrating and unclear. But for traders following MMFLOW KeyLevels, this is actually the “golden range”, as key zones continue to hold with remarkable precision.
📉 Today’s Outlook
Main Trend: Ongoing corrective downside move.
Potential Scenario: A deep liquidity sweep towards the 331x zone before a strong bullish rebound.
🔑 Key Trading Levels
SELL Zone: 3340 – 3345 | Short SL: 4 – 5$
🎯 Targets: 3325 → 3317 → extended 3310
📌 Note: Manage risk tightly and watch reactions around KeyLevels – a single BreakOut move post-FOMC could unlock the next major opportunity.
✨ Once again: KeyLevels = Profits ✅
👉 Follow MMFLOW TRADING for daily KeyLevel strategies, liquidity maps & smart money insights
🇮🇳 Gold Under Pressure | Key Levels to Watch TodayGold continues to move in line with our weekly outlook. Despite strong rebounds from liquidity zones, the market still faces heavy selling pressure, unable to break out of the 335x – 336x resistance area.
With no major news events scheduled today, price action is expected to remain within range, making KeyLevels the most important zones to trade from.
📌 Trading Bias Today
Priority remains on SELL setups at upper resistance zones. Adjust entries slightly for better risk–reward.
For BUY positions, wait for deeper entries to avoid liquidity sweeps around 333x – 332x, which have been tested multiple times recently.
🔑 Key Market Levels
Resistance: 3346 – 3357 – 3370 – 3383
Support: 3324 – 3316 – 3309
📌 Trading Plan for India Traders
✅ BUY Zone: 3316 – 3314
SL: 3310
TP: 3320 – 3324 – 3328 – 3332 – 3336 – 3340 – 3350 – 3360+
✅ SELL Zone: 3356 – 3358
SL: 3362
TP: 3352 – 3348 – 3344 – 3340 – 3330 – 3320
⚠️ Summary
Gold remains inside a bearish channel, waiting for a clear breakout. Until major news like the FOMC hits, expect sideways price action within today’s KeyLevels.
👉 Watch reactions closely around 333x – 336x for the next potential move.
Stay disciplined, trade the levels, and let the market show its hand.
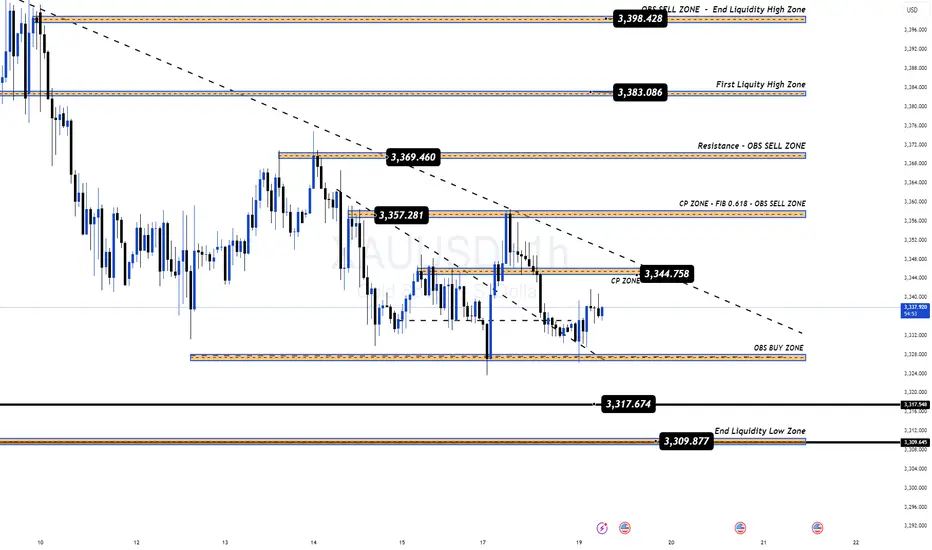
GOLD Waiting for the Big BreakOut after FOMC This WeekGold Sideway Compression | Waiting for the Big BreakOut after FOMC This Week
Gold is currently consolidating in a tight range, building up energy for a major BreakOut. After the liquidity sweep at the weekly open, price fluctuated strongly between the 332x – 335x zone, but on the H1 timeframe, the overall trend still remains within a descending channel.
Last week, CPI & PPI data failed to deliver a clear direction. This week, all eyes are on the FOMC meeting, expected to provide stronger signals for gold’s next move.
⏳ Early to mid-week: with limited impactful news, gold may continue to sideway within the narrow range or maintain downside pressure until FOMC is released.
🔑 Key Market Levels
Resistance: 3357 – 3369 – 3383 – 3398
Support: 3335 – 3317 – 3309
📌 Trading Setup
✅ BUY Zone: 3334 – 3332
SL: 3328
TP: 3338 – 3342 – 3346 – 3350 – 3355 – 3360 – 3370 – 3380
👉 If gold breaks the descending channel around 336x, expect a strong move towards 3383 – 3398.
✅ SELL Zone: 3383 – 3385
SL: 3390
TP: 3378 – 3374 – 3370 – 3360 – 3350
👉 If gold fails at higher resistance and reverses, liquidity may be swept back into 333x – 331x, with potential extension down to 329x.
⚠️ Summary
Gold is at a critical decision point: BreakOut or Breakdown.
Before FOMC: sideways / bearish bias within H1 channel.
After FOMC: expect a strong Pump or Dump to define the clear weekly trend.
🔥 Keep a close eye on reactions at KeyLevels (333x – 336x – 338x) to adjust trading strategy accordingly.

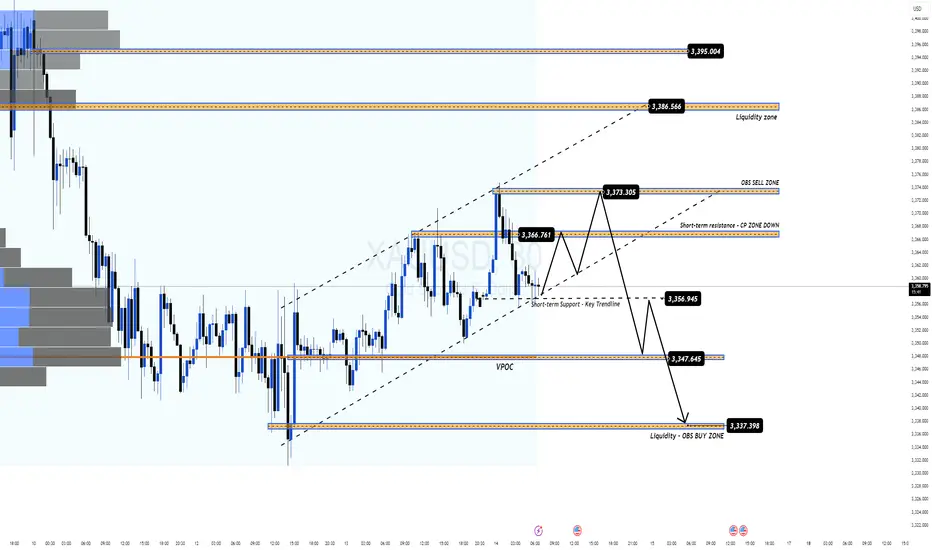
Fed Set to Cut 50bps: Gold Gains as the Bullish Wave Forms Again📌 Macro Overview
US Treasury Secretary Bessent gives the green light for a potential 50-basis-point rate cut by the Fed in September.
July CPI remains soft → USD weakens, bond yields fall, boosting gold’s bullish outlook.
Gold briefly touched $3,370/oz, closing at $3,355.9/oz (+0.24%).
Gains capped as US equities continue to break records and geopolitical tensions ease.
Market focus now shifts to PPI data, jobless claims, and the anticipated Trump–Putin meeting for the next directional cues.
🧐 Technical Outlook – MMFLOW Analysis
The bullish recovery wave is clearly re-emerging after a corrective phase, with price hunting liquidity zones left behind in the recent retracement.
Preferred strategy: Trade around key liquidity levels or continuation zones for SELL opportunities; BUY entries will be taken earlier to catch the recovery wave within the current price channel.
Price Structure & Observation Zones:
Short-term uptrend channel intact, primary support at 3336 – 3334 (Liquidity – OBS BUY Zone).
Major resistance at 3394 – 3396 (Liquidity Grab Zone + H1 Supply).
🎯 MMFLOW Trading Plan
🔹 BUY SCALP – Catch the recovery wave
Entry: 3336 – 3334
SL: 3330
TP: 3340 – 3345 – 3350 – 3355 – 3360 – 3365 – 3370 – 3380 – ???
🔹 SELL SCALP – Counter-trend at resistance
Entry: 3394 – 3396
SL: 3400
TP: 3390 – 3385 – 3380 – 3370 – 3360
📊 Key Levels
Resistance: 3365 – 3370 – 3395
Support: 3340 – 3336 – 3330
💡 MMFLOW Strategy Tip:
Wait for price to retest the 3336 – 3334 BUY ZONE for trend-following BUY positions.
Watch for liquidity absorption signals at 339x – a potential SELL reversal zone.
Trading Analysis for Gold Spot / U.S. Dollar (15-Minute Chart)Based on the provided 15-minute chart for Gold Spot / U.S. Dollar (XAU/USD), published by NAVIPIPS on TradingView.com on June 28, 2025, at 20:42 UTC, here’s a suggested trading setup for a sell position. Note that the chart indicates a buy setup, but since you requested a sell analysis, I will interpret a potential sell scenario based on the current price action and levels.
Current Price and Trend: The current price is 3,274.175, with a slight decline of -0.580 (-0.02%). The chart shows a recent uptrend that may be exhausting near the current level, with a potential reversal suggested by the downward trendline.
BUY Entry: Enter a sell position at 3,274.175 (current price), as it aligns with a resistance zone where the price has struggled to break higher, indicated by the buy entry level being a potential reversal point for a sell.
Stop Loss: Place a stop loss at 3,263.740, below the recent low, to protect against an upward continuation. This level is approximately 10.435 points below the entry, defining the risk.
Take Profit Levels:
Take Profit 1: 3,295.816, a conservative target about 21.641 points above the entry.
Take Profit 2: 3,280.254, a mid-range target approximately 6.079 points above the entry.
Take Profit 3: 3,263.825, a deeper target about 10.350 points below the entry, aligning with a support zone.
Price Action: The chart indicates an uptrend with a potential peak near the current level, supported by the downward trendline. The buy setup suggests a bounce, but a sell could be viable if the price fails to sustain upward momentum.
Risk-Reward Ratio: The distance to the stop loss (10.435 points) compared to the take profit levels (6.079 to 21.641 points) presents a mixed risk-reward profile. Take Profit 1 offers a 1:2 ratio, while Take Profit 3 results in a negative ratio, indicating a high-risk sell against the buy setup.
Conclusion
Enter a BUY at 3,274.175, with a stop loss at 3,263.740 and take profit levels at 3,295.816, 3,280.254, and 3,263.825. This is a counter-trend trade against the indicated buy setup, so confirm the reversal with additional indicators (e.g., candlestick patterns or RSI) and be prepared for potential upward momentum if the price breaks above the stop loss level.

"Gold Price Analysis: Supply Zone Rejection & Potential Drop Key Technical Levels:
Supply Zone Resistance (~3,004.973): Price is currently testing this resistance area, which could lead to a potential rejection.
FVG (Fair Value Gap) Support Level (~2,949.378 - 2,945.323): This area is marked as a potential support zone where price might find buying interest.
EMA 200 Support (2,945.323): A critical dynamic support level that aligns with the FVG zone.
Indicators:
EMA 30 (Red Line - 2,990.457): Short-term trend indicator.
EMA 200 (Blue Line - 2,945.323): Long-term trend indicator.
Price Action & Prediction:
The price is in the supply zone resistance and could potentially reject downwards.
The blue projected path suggests a pullback to the FVG support zone before a possible rebound.
If price breaks below this support, further downside could be expected.
Potential Trade Idea:
Short Setup: If rejection occurs at resistance, a short trade targeting the FVG/EMA 200 support could be considered.
Long Setup: If price reaches the FVG zone and finds support, a long position targeting previous highs could be a strategy.

GOLD TRADING POINT UPDATE >READ THE CHPTIANBuddy'S dear friend 👋
SMC Trading Signals Update 🗾🗺️ Gold Traders SMC-Trading Point update you on New technical analysis setup for Gold 🪙 Gold Traders list time post signals Hit sucksfully My target point ) Now Gold making choch FVG level) FVG level 2897 + 2906 down 👇 👎 trend 📉 point below 👇 ⬇️ target point 2868- 2859 first. Hit sucksfully FVG level that take entry ☺️ 🥂 good luck 🤞
Key Resistance level 2897 + 2906
Key Support level 2868- 2859
Mr SMC Trading point
Pales support boost 🚀 analysis follow)

GOLD TRADING POINT UPDATE > READ THE CHAPTIANBuddy'S dear friend 👋
SMC Trading Signals Update 🗾🗺️ Gold Traders SMC-Trading Point update you on New technical analysis setup for Gold 🪙 Gold Traders Gold 3 time frame 🖼️ looking FVG rejected point below 👇 2929+ 29209. Technical patterns). Weekly basis setup. )
Key Resistance level 2929 + 2957
Key Support level 2891 - 2848
2832
Mr SMC Trading point
Pales support boost 🚀 analysis follow)

GOLD TRADING POINT UPDATE > READ THE CHAPTIAN Buddy'S dear friend 👋
SMC Trading Signals Update 🗾🗺 Gold Traders SMC-Trading Point update you on New technical analysis setup for Gold 🪙 💥 Gold Traders Gold 4 Time Frame. Tast diamond zone support level. Close above EMA ) indicator. ) SMC Trading point expect it. Bull 🐂 trend 📈 supply zone 2920 2930. This levels. Expect it selling Arya )
Key Resistance level 2920 + 2930
Key Support level 2852 - 2834
Mr SMC Trading point
Pales support boost 🚀 analysis follow)

GOLD TRADING POINT UPDATE > READ THE CHAPTIAN Buddy'S dear friend 👋
SMC Trading Signals Update 🗾🗺️ Gold Traders SMC-Trading Point update you on New technical analysis setup for Gold 🪙 Gold Traders Gold weekly Time Frame 🖼️ looking a good time for. Short Trade 😁. Also Goldman Sachs talk and 2025 if gold tast 3000$. Not for now weekly candle 🕯️ close below 👇 ⬇️ 2800 Next target 2538.
Key Resistance level 2900 + 2956
Support level 2800 - 2782 - 2706 - 2538
Mr SMC Trading point
Pales support boost 🚀 analysis follow)

GOLD TRADING POINT UPDATE > READ THE CHAPTIAN Buddy'S dear friend 👋
SMC Trading Signals Update 🗾🗺️ Gold traders SMC trading poi nt update you on New technical analysis setup list time post signals 🚀 Hit sucksfully My target 🎯 point 2877 Now ✅ update you on New technical analysis update on gold 🪙 Gold still going to bullish trend 📈 🚀 today us session. More bullish on Gold take a New ATH 2904 I'm long Now 2869 + 2904 Good luck 💯🤞
Key Resistance level 2880 + 2904
Key Support level 2866 - 2854 - 2845
Mr SMC Trading point
Plaes support boost 🚀 analysis follow)

GOLD TRADING POINT UPDATE < READ THE CHAPTIANBuddy'S dear friend 👋
SMC Trading Signals Update 🗾🗺️ Gold traders SMC trading point update you on New technical analysis setup for Gold 🪙 After FOMC meeting 🤝💯 trot aril analysis setup breakout one said that entry open 👐 target 2766 close above more Bull Trend target 2780 2803 if close below 👇 2740 next target we'll see 2730 2692 MA support
Key Resistance level 2766 + 2772 + 2786 + 2803 New ATH
Key support 2730 2692
Support 💫 My hard analysis setup like And Following 🤝 me that star ✨ game 🎮

XAUSD [Gold] Short IdeaThe price failed to breach the 2665 supply level and reversed from the high, closing at 2638.
The OANDA:XAUUSD remains in a downtrend, indicating a range-bound trading pattern.
The price is expected to swing down to the 2615 to 2606 range before reversing back to 2665.
Consider going long near the demand zone highlighted in the chart.

Gold Trading Strategy for 6th January 2025Gold Trading Strategy
Key Levels:
Buy Above: The high of the 1-hour candle that closes above 2648
Sell Below: The low of the 15-minute candle that closes below 2631
Targets:
Upside Targets: 2655, 2665, 2680
Downside Targets: 2632, 2616, 2609
Strategy Details:
Buy Signal: Enter a buy position above the high of the 1-hour candle that closes above 2648, aiming for targets of 2655, 2665, and 2680.
Sell Signal: Enter a sell position below the low of the 15-minute candle that closes below 2631, aiming for targets of 2632, 2616, and 2609.
Trailing Stop-Loss: Use a trailing stop-loss to manage risk and protect your capital.
Book Profits: Regularly book profits at the specified resistance and support levels.
Disclaimer:
This strategy is based on historical data and technical analysis. Past performance is not indicative of future results. Trading involves risk, and you should only invest money that you can afford to lose. Always conduct your own research or consult with a financial advisor before making any trading decisions.

GOLD TRADING POINT UPDATE > READ THE CAPTAINBuddy'S dear friend 👋
Gold Trading Signals 🗺️🗾 Update Gold Traders SMC-Trading Point still holding Short Trade now 4H Time Frame 🖼️ candle test supply zone 2647 looks great patterns technical analysis Short Trade now List time post signals 🚀 Hit 400+ pips profits 2025 Xau USD ?! What is your target 🎯. SMC-Trading Point looks 2000 good fall
Small target we'll see 2606
Analysis target 🎯 2537 2482
Resistance level 2647 2656
2680
Support level 2620 2606 2537 2482
Mr SMC Trading point
Support 💫 My hard analysis Setup like And Following 🤝 me that star ✨ game 🎯

Gold Trading Strategy for 02nd January 2025Gold Trading Strategy
Buy Setup Condition:
Wait for a 15-minute candle to close above 2632.
Entry:Place a buy order above the high of this 15-minute candle.
Targets:2640, 2648, 2655.
Stop Loss:Set a stop loss below the low of the entry candle or according to your risk management.
Sell SetupCondition:
Wait for a 1-hour candle to close below 2616.
Entry:Place a sell order below the low of this 1-hour candle.
Targets:2608, 2602, 2590.
Stop Loss:Set a stop loss above the high of the entry candle or according to your risk management.
Disclaimer
Trading involves substantial risk and is not suitable for every investor. The strategy mentioned above is for informational purposes only and does not constitute financial advice. Always perform your own analysis and consult a professional financial advisor before making trading decisions. Past performance is not indicative of future results. Use this strategy at your own risk.

Gold Trading Strategy for 30.12.2024Gold Trading Strategy
Key Levels:
Buy Above: The high of the 15-minute candle that closes above 2642
Sell Below: The low of the 15-minute candle that closes below 2610
Targets:
Upside Targets: 2651, 2664, 2675, 2686
Downside Targets: 2598, 2589, 2579
Strategy Details:
Buy Signal: Enter a buy position above the high of the 15-minute candle that closes above 2642, aiming for targets of 2651,2664, 2675, and 2686.
Sell Signal: Enter a sell position below the low of the 15-minute candle that closes below 2610, aiming for targets of 2598, 2589, and 2579.
Trailing Stop-Loss: Use a trailing stop-loss to manage risk and protect your capital.
Book Profits: Regularly book profits at the specified resistance and support levels.
Disclaimer:
This strategy is based on historical data and technical analysis. Past performance is not indicative of future results. Trading involves risk, and you should only invest money that you can afford to lose. Always conduct your own research or consult with a financial advisor before making any trading decisions.

One more SHORT plan with XAUUSD - GOLD on TF M15It's Xmas day so that the Volumn of Market is week --> so that the price is very slow
But with the Cloud Trending System I saw some good signals to make a SHORT sell plan for GOLD OANDA:XAUUSD today.
On M15 Time Frame:
I saw a "Confirmed downtrend signal"
I saw a Downtrend Market Structure : LOWER HIGH
I saw downtrend on main trend of 4 time frames: H4-H1-M30-M15
Specially, I also saw a "Break down follow trend" signal on M15 Cloud Trending Chart
So I make one more SHORT SELL plan for GOLD XAUUSD today with Entry zone = 2616-2617
Stoploss = Trailing Stoploss (a Pink color line above the cloud)
Target 1 = about 2608
Target 2 = about 2598
============
Another: Check this plan yesterday : still running....

XAUUSD wave countxauusd in corrective wave ABC
of which wave A ended at 2536
wave B ended near 2726
and wave C down in progress expected to move in form og zigzag waves 1-2-3-4-5
till now low made near 2583
moving inside the channel where middle line acting as support.
XAUUSD sell on rise mode.
Disclaimer : views presented here are for educational purpose and not a trading advice

Gold Trading Strategies for 23rd December 2024Gold Trading Strategies
Strategy 1: Breakout Strategy
Buy Above: Enter a buy position above the high of the 15-minute candle that closes above 2636.
Upside Targets: 2650, 2665, 2680
Sell Below: Enter a sell position below the low of the 15-minute candle that closes below 2611.
Downside Targets: 2600, 2587, 2570
Strategy 2: Support Zone Buy Strategy
If the price trends lower from 2625:
Buy Between: 2610-2616
Stop Loss: 2604
Targets: 2625, 2635, 2650
Strategy 3: Resistance Zone Sell Strategy
If the price trends higher from 2623:
Sell Between: 2635-2645
Stop Loss: 2655
Targets: 2625, 2615, 2600
Summary:
Breakout Strategy: Utilizes the breakout levels of 2636 for buying and 2611 for selling based on the 15-minute candle close, with defined upside and downside targets.
Support Zone Buy Strategy: Focuses on buying in the support zone of 2610-2616 with a stop loss at 2604, targeting 2625, 2635, and 2650.
Resistance Zone Sell Strategy: Targets selling in the resistance zone of 2635-2645 with a stop loss at 2655, aiming for targets of 2625, 2615, and 2600.
These strategies provide a comprehensive approach to trading gold, incorporating different market conditions and defined targets.
This analysis is for informational and educational purposes only. Please consult with a certified financial advisor before making any trading decisions.

Gold Trading Strategy for 20th December 2024Trading Strategy
Key Levels:
Buy Above: The high of the 15-minute candle that closes above 2606
Sell Below: The low of the 15-minute candle that closes below 2583
Support and Resistance Levels:
Resistance: 2616, 2634, 2652
Support: 2573, 2555, 2530
Strategy Details:
Buy Signal: Enter a buy position above the high of the 15-minute candle that closes above 2606.
Sell Signal: Enter a sell position below the low of the 15-minute candle that closes below 2583.
Trailing Stop-Loss: Use a trailing stop-loss to manage risk and protect your capital.
Book Profits: Regularly book profits at the specified resistance and support levels.
Additional Tips:
Monitoring: Continuously monitor the 15-minute chart for clear buy or sell signals.
Risk Management: Always use stop-loss orders to manage risk and protect your capital.
Market Conditions: Stay updated on market news and events that could impact prices.
Disclaimer:
This analysis is for informational and educational purposes only. Please consult with a certified financial advisor before making any trading decisions.
