INVERSE HEAD AND SHOULDER PATTERN BREAKOUT Stock has Given Multiyear Resistance Breakout Of Dec 02.12.2020 With Inverse Head Shoulder Pattern Confirmation .
Buy :- 432/-
Stop Loss :- 420/-
T1 :- 450/-
T2 :- 480/-
Stock is trading in upward trend
Goodvolumes

Bull Flag Pattern Breakout and Retest seen in Dixon TechnologiesHello Traders, i have brought another analysis on a pattern breakout which called (Bull Flag Pattern). Well i have marked and written most of the things on chart, but still i am gonna to teach you here guy's about this pattern so if you see this type of Bull flag pattern next time, So at least you guy's will be able to trade. So Let's start.
Q:- What is Flag Pattern and How to Use this Flag Patterns when you see Breakouts in it?
Rahul Replies: - A bull flag is a continuation pattern that occurs as a brief pause in the trend following a strong price move higher. The bull flag chart pattern looks like a downward sloping channel/rectangle denoted by two parallel trendlines against the preceding trend. During this period of consolidation, volume should dry up through its formation and resolve to push higher on the breakout. The actual price formation of the bull flag resembles that of a flag on a pole hence its namesake.
These three elements are integral for the bullish flag to occur:-
The flagpole:- The asset’s price must trade higher in a series of the higher highs and higher lows.
Flag:- A consolidation must take place between two parallel trend lines;
A breakout:- The consolidation can’t take forever. A breakout to the upside activates the pattern, while a break of the supporting line invalidates the formation.
Guy's now i will tell how to use this Bull Flag Pattern if you see breakouts in it?
Buy when prices breakout above the consolidation pattern on high volume.
Place stop loss order below bottom of consolidation pattern or if you have short term view on particular stock which has given successfully breakout then you place below of breakout candle and ride the trade.
Guy's according to the study we have two types of Profits targets 1st one is, if you have short term view then you should go at least length of flag pattern and 2nd one is if you have long term view kind of investment purpose then you should go length of Flag Pole.
The main thing to look for in this pattern is volume. Volume confirms major moves and the likely hood that a breakout will be successful. In Dixon Technologies we have seen huge volume, which says this is a genuine breakout.
So guy's this was the process of Bull Flag Pattern. So if you spot this bull flag pattern in any stock or index you can go longer according to the setup i have told you. In our chart we have got double breakout, 1st breakout of flag pattern and 2nd we have seen for resistance zone which i have marked on chart.
I hope you guy's have understand now, how to trade bull flag pattern after breakout.
So now let's focus about company background.
Dixon Technologies (India) Limited is the largest* home grown design-focused and solutions company engaged in manufacturing products in the consumer durables, lighting and mobile phones/smart phones markets in India.
Market Cap
₹ 28,218 Cr.
Current Price
₹ 4,738
High / Low
₹ 4,968 / 2,553
Stock P/E
102
Book Value
₹ 216
Dividend Yield
0.04 %
ROCE
25.8 %
ROE
22.4 %
Face Value
₹ 2.00
Debt
₹ 200 Cr.
EPS
₹ 46.8
PEG Ratio
3.08
Promoter holding
34.0 %
Intrinsic Value
₹ 1,549
Pledged percentage
1.13 %
EVEBITDA
50.6
PROS
Company has reduced debt.
Company has delivered good profit growth of 33.2% CAGR over last 5 years
Company's median sales growth is 15.7% of last 10 years
CONS
Stock is trading at 22.0 times its book value
Important levels for DIXON TECHNOLOGIES:-
Buy in between 4750-4679 Range.
Targets we can see 5697/6493+ (Long term Targets will be 9704+)
Keep Stop loss at 4023 (Long term Stop loss will be 2450)
Price is above 200 EMA
We have seen Proper Breakout of Bull Flag Pattern in weekly timeframe.
with Good Volume
Price is sustaining above breakout and above resistance levels and it has given pull back to retest the levels
MACD and RSI has given bullish crossover (I have not placed RSI here as i want chart neat and clean but i have analysed already)
Disclaimer:- Please always do your own analysis or consult with your financial advisor before taking any kind of trades.
Dear traders, If you like my work then do not forget to hit like and follow me, and guy's let me know what do you think about this idea in comment box, i would be love to reply all of you guy's.
Thankyou.

DELTA CORP LTD SWING TRADEAs we see RECTANGLE breakout in DELTA CORP. we can go long by keeping our stoploss below 300.

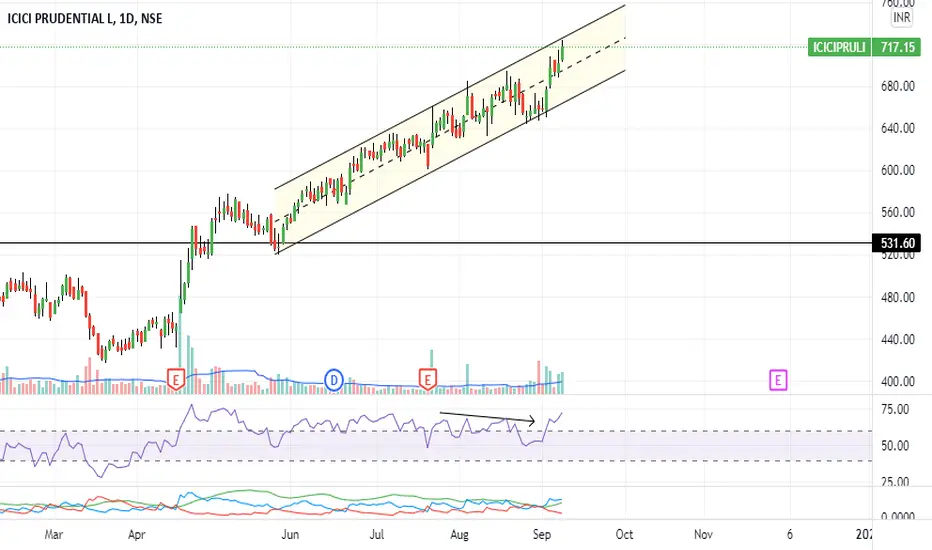
#iciciprudential trending at all time high with volume&momentum#iciciprudential trending with channel at all time high with volume and momentum
weekly has a momentum bullish reverse divergence playing out.
adx trend indicators are also seen rising in strength in all timeframes in bull zones
look like most other stocks in insurance sector also rallying.
ORIENTELECTRICCUP AND HANDLE PATTERN.GOOD VOLUME BREAKOUT.
T1- 357 levels approx.
T2- 393 levels approx.
Disclaimer: Chart is shared only for educational purpose. Before investing please consult your financial advisor.

TCS: With lower risk, and average profit, TCS can give 2.65%Hello Traders,
TCS looks bullish. Had high volume positive trade in last session. Can be entered to tap immediate average move for a target profit of INR 75 with SL of 54.
I would suggest instead of placing a Target profit order, put the trailing SL order, and this is because USD also seems to be rising against INR and that could further give TCS a further upward move.
Enter TCS: At CMP (between 3250 and 3280 depending on how it opens)
Target profit: Rs 75
SL: Rs 54
