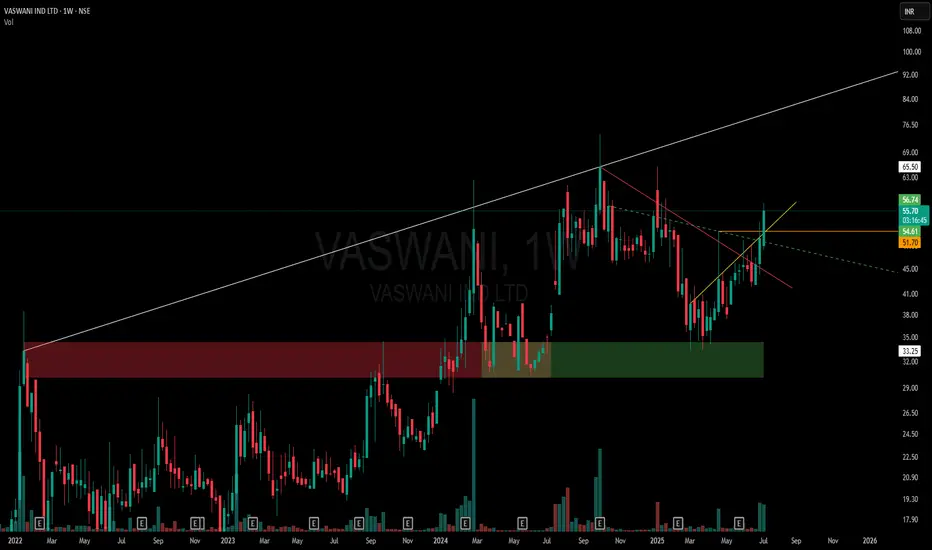
One-Sided Broadening Pattern | Pure Price Action Storytelling🔹 White Line: Captures the expanding higher-high resistance zone — part of the broader one-sided broadening pattern. Each new high is breaching the prior, giving the top side its expanding identity.
🔹 Horizontal Zone (Red to Green Shift): What once acted as a strong supply zone now flipped to a demand zone — price has respected this region multiple times, marking its evolution.
🔹 Red Line: A clean Counter-Trendline (CT) containing multiple touches, recently broken.
🔹 Yellow Line: A hidden diagonal resistance — tight and respected — offering another layer of confluence.
🔹 Green Dotted Line: Subtle hidden support built over time — watch how the structure was reacting along this line.
🔹 Orange Line: Marks wick-based rejection from a recent swing — subtle but clear evidence of supply exhaustion on that specific level.
🧠 This chart is not about predictions — it's about how beautifully price respects structure when drawn with logic and precision. Just charting. Just behavior. Just price.
H-pattern
FLOKI UPSIDE MOVE COMINGBINANCE:FLOKIUSDT
It's making a cup & Handle pattern and a breakout from that pattern, too
Now, once it comes inside the range, the upside move is unbeatable
Keep this in you watchlist

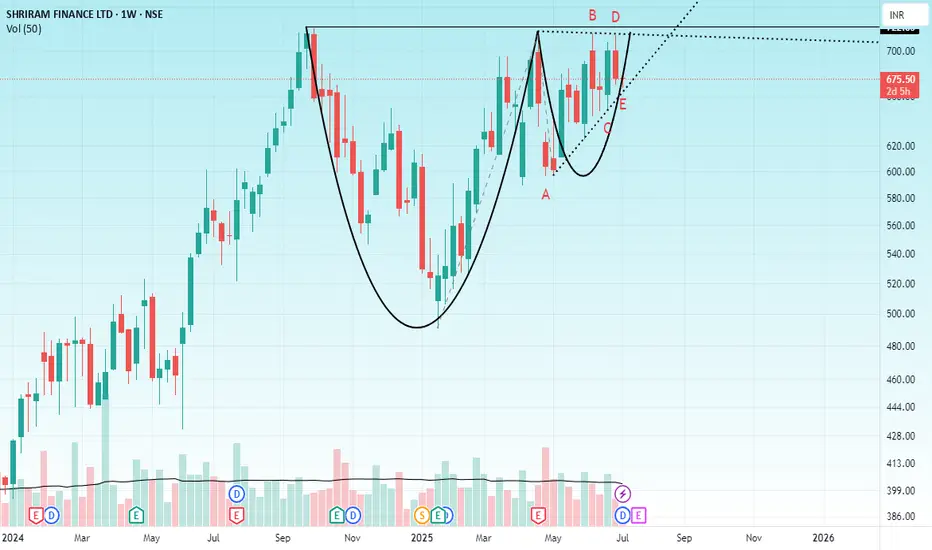
SHRIRAM FINANCEHello & welcome to this analysis
After a very strong uptrend the stock went into a consolidation to form a cup & handle pattern, the handle being completed now in the form of a triangle.
As long as it does not break below 640 it has a high probability of breaking above the trendline at 700 for targets of 800 / 875 / 950
Good risk reward set up at the moment.
All the best
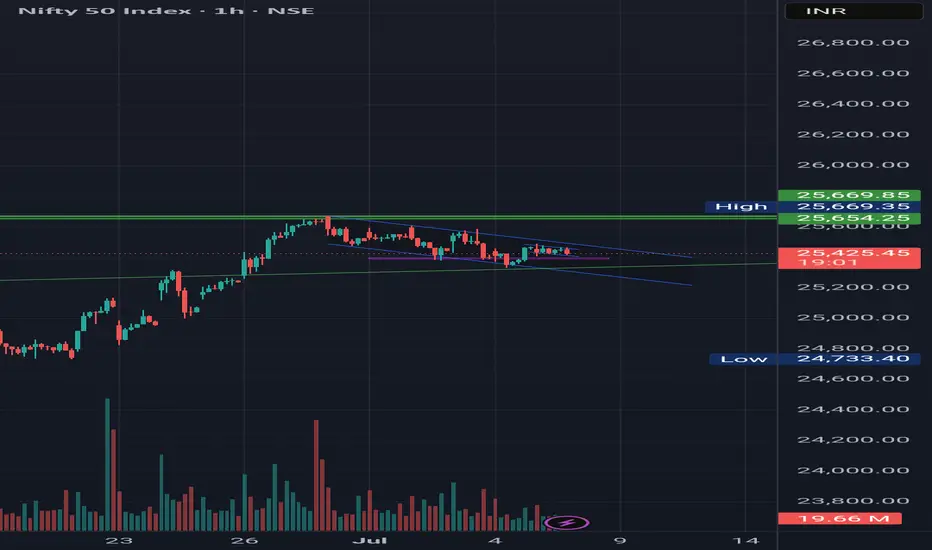
Nifty in a pole and flag pattern consolidation or M pattern.Nifty is in consolidation range waiting for the India US trade deal which has deadline of 9th july.
Based on the news the pattern can be made as Pole and flag if the news becomes positive.
Else, can make M pattern if deal doesn't happen.
Both side good targets are available.
Note: This analysis is for Educational Purpose Only. Please invest after consulting a professional financial advisor.
Punjab National Bank Flag Breakout Setup📈 Punjab National Bank (PNB) – Flag Breakout Setup
Observed a classic flag pattern on the daily chart after a strong pole move in 2023–24.
✅ Breakout above the channel confirmed with price action near 113.
✅ Entry plan: Watch for daily close >113 with volume.
✅ Stop-loss idea: Below 106.
✅ Target 1: 140 (first swing resistance).
✅ Measured move projection targets up to ~198 possible based on full flag pole.
Volume confirmation and broader market context will guide the actual trade trigger.

OPTIEMUS | Reclaiming Zones, Respecting Trendlines🟩 Price is navigating a critical structure:
White Line = Major CT (Control Trendline) — currently acting as resistance.
White Zone = MTF Supply ➡ Demand Flip Zone — price is holding above it.
Blue Zone = WTF Demand Pocket — also reclaimed recently.
📌 After reclaiming both the blue and white zones, price is now consolidating just under the CT, possibly coiling up.
🧠 Not a prediction. No tips. Just structure-based storytelling.

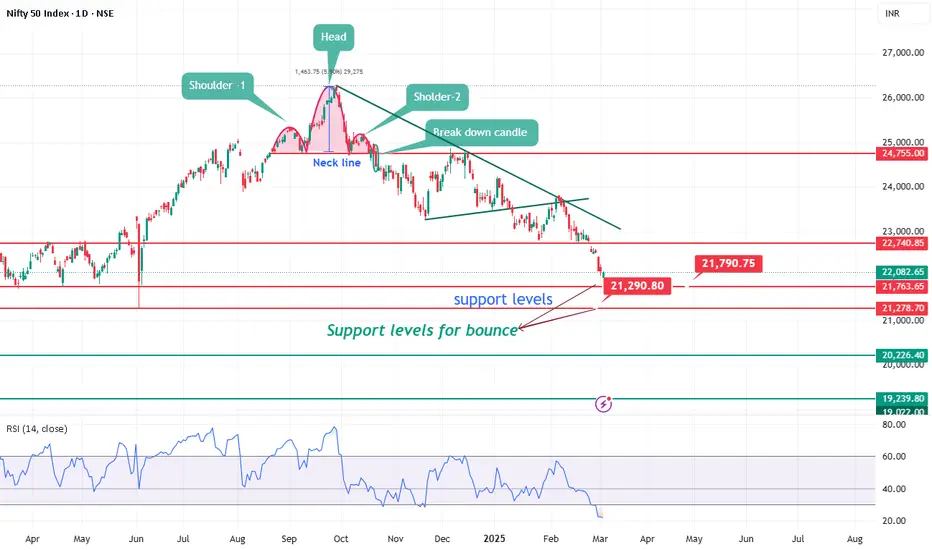
Nifty support levels for bounce.Nifty has been corrected 17% from top. As per chart index is in oversold condition on daily chart. There is still space for downside lower levels for support would be 21800 and 21222.
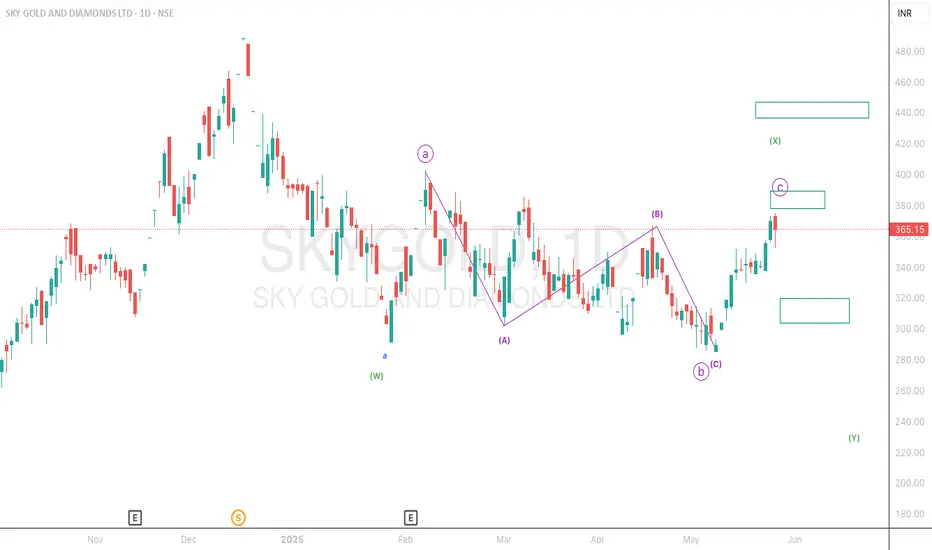
Too cloudy in sky gold and diamond..A consolidation phase is going on. as of now this script having correction or pullback value of 78.6% as its nature.
We need to wait and watch till the clouds disappear..
i am not a SEBI registered advisor. Before taking a trade do your own analysis or consult a financial advisor. I share chart for education purpose only. I share my trade setup.
CT Breakout + H&S! What’s Brewing in Udaipur Cement?📌 Chart Overview
A clean Counter-Trendline (CT) breakout is visible on the weekly timeframe.
The breakout also aligns with a classic Inverted Head & Shoulders structure.
The left shoulder, head, and right shoulder are all clearly formed, suggesting a potential reversal pattern.
📌 Hidden Resistance Lines
Dotted white lines represent hidden resistances, derived from prior swing highs/lows.
The extended hidden line from the top acts as future resistance, adding confluence to the zone.
📌 Monthly Supply Zone
A monthly supply area is marked at ₹34.63, closely aligning with the extended hidden resistance.
This zone could act as a potential hurdle in the next leg up.
📌 Volume Analysis
Breakout lacks strong volume, which is a key point to remember.

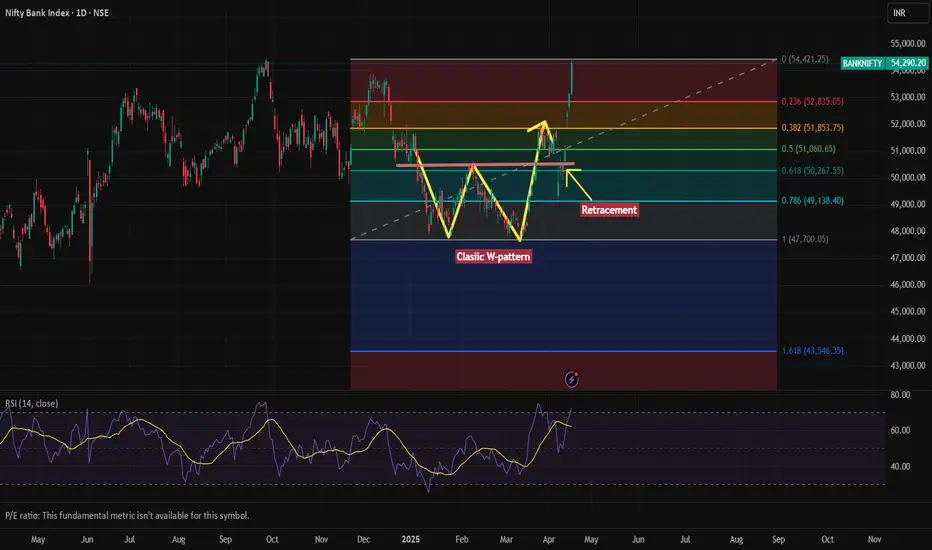
Bank Nifty Breaks Out: Classic W-Pattern Signals Bullish MomentuThis chart represents the **Nifty Bank Index** (BANKNIFTY) on a daily timeframe and showcases a technical analysis using:
1. **Fibonacci Retracement Levels**
2. **A Classic W-Pattern (Double Bottom)**
3. **RSI (Relative Strength Index)** at the bottom
---
### 🔍 **Pattern Analysis**
#### 📈 Classic W-Pattern (Double Bottom)
- A W-pattern, also called a double bottom, typically indicates a **reversal from a downtrend to an uptrend**.
- It’s clearly marked in yellow, showing the index formed two distinct lows around the same level.
- This formation was followed by a **bullish breakout** above the neckline (horizontal resistance), confirming the pattern.
---
### 🔢 **Fibonacci Retracement Levels**
- The retracement tool is drawn from the swing high (around 54,421) to the swing low (around 43,546).
- Key levels marked:
- **0.236 (52,835)**
- **0.382 (51,853)**
- **0.5 (51,060)**
- **0.618 (50,267)**
- **0.786 (49,138)**
- The price **retraced to the 0.5-0.618 level** (a strong support zone) before resuming its uptrend — a typical bullish retracement behavior.
---
### 🔄 **Recent Breakout & Momentum**
- After retesting the neckline (as indicated by the arrow labeled “Retracement”), the price **broke above previous highs**, signaling strong bullish momentum.
- The latest candle shows a significant upward move, closing around **54,290**, very close to the **previous high of 54,421**, suggesting a potential **breakout into uncharted territory** if volume supports it.
---
### 📊 **RSI Indicator**
- RSI is around **72**, entering the **overbought zone (>70)**.
- This indicates **strong bullish momentum**, but could also suggest a potential for **short-term consolidation or minor correction**.
---
### ✅ Summary
- **Trend**: Strong bullish trend confirmed by W-pattern breakout and higher highs.
- **Support Levels**: 51,060 (0.5) and 50,267 (0.618) are key support zones.
- **Resistance**: Immediate resistance is the previous high at 54,421. A breakout above this could lead to new highs.
- **Momentum**: Overbought on RSI – bullish strength, but monitor for possible pullbacks.
Max Financial Services Ltd – Trend Reversal in Play?🚀 Technical Analysis Breakdown:
The yellow trendline shows a long-term support, which has held well despite recent corrections.
The red downtrend line indicates a recent bearish phase, which has now been broken with a strong bullish candle.
The stock has bounced from the trendline support, showing signs of strength.
Above all the strong Pinbar candle looks amazing for a candle close .
🔎 Your Take? Do you see further upside or a pullback? Comment below! 👇

Inverted Head & Shoulders: 3 Must-Know Variations for Traders!Not all Inverted Head & Shoulder patterns work the same way! Here’s a deep dive into 3 powerful variations that can help traders find strong trend reversals and breakouts in swing & momentum trading

Identical patterns in Godfrey Phillips and Swan EnergyI showcase two identical patterns in Godfrey Phillips and Swan Energy in this video. I had previously traded Swan Energy, and because I journal my trades, I remembered its price action when I spotted the same setup in Godfrey Phillips.
This is the power of journaling! By maintaining a trading journal, you track your profits and losses and improve your ability to recognize repeating patterns and backtest data effectively.
Do you maintain a trading journal? Let me know in the comments!

Unique way of Trading the Broadening Patterns with examplesI daily make educational content videos for swing / positional trading

Pre and Post Breakout with Pattern trading I make educational content videos for swing / positional trading

2 Amazing swing trading ideas for 27 Jan 2025I daily make educational content videos for swing / positional trading

3 Swing Trading ideas that can give you Amazing Returns I daily make educational content videos for swing / positional trading

Swing trading idea Using the concept of Gaps and MtfaI daily make educational content videos for swing / positional trading

2 Amazing swing trading ideas for 17 Jan 2025 I make educational content videos for swing / positional trading

Double Symmetrical Triangle Breakout Plan in Navine FluorineI daily make educational content videos for swing / positional trading

3 Potential swing trading ideas for 9 jan I make educational content videos for swing / positional trading

Detailed Price action analysis and swing trading ideas for 8 JanI make educational content videos for swing / positional trading

UNITDSPR: Cup & Handle pattern breakout📊 Analysis :
Good bullish candle breakout of C&H pattern with good volume.
📈 Trading Plan :
Entry: Buy above 1565 (wait for a breakout above candle at least 15-30 min with strong volume confirmation).
Target 1: 1650
Stop-Loss: 1525
R:R 1:2
