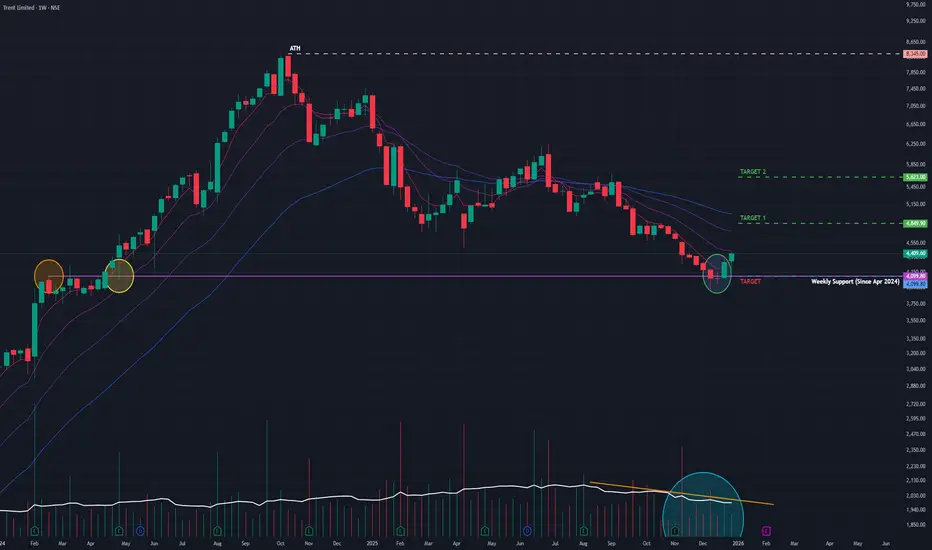
Trent (W): Bullish Reversal, Trend Reversal at Major SupportTimeframe: Weekly | Scale: Logarithmic
The stock is staging a classic reversal after a brutal 2-month correction. The "Morning Star" and "Hammer" combination at the 200-day EMA equivalent support signals that the "Panic Selling" is over and "Smart Money" accumulation has begun.
🚀 1. The Fundamental Catalyst (The "Why")
The reversal is driven by a shift in market perception:
> Valuation Comfort: After correcting ~50% from the top, the stock's valuation has cooled off significantly, attracting long-term institutional buyers who missed the earlier rally.
> Q3 Expectations: Investors are positioning for strong Q3 FY26 numbers, driven by the heavy wedding season demand in December, which directly benefits Westside and Zudio sales.
📈 2. The Chart Structure (The Complex Bottom)
> The Floor: ₹3,865 – ₹4,100 zone was a resistance in early 2024 and has now flipped to become a rock-solid support (Polarity Principle).
> The Pattern:
- Week 1 (Dec 8): Formed a long-legged Doji/Hammer at support (Stopping Volume).
- Week 2 & 3: Followed by a Morning Star formation (a bullish reversal pattern).
- Current Action: The confirmed Hammer this week shows that every dip is being bought aggressively.
📊 3. Volume & Indicators
> Volume: Volume was low during the drop (weak selling). The recent uptick in volume on bullish candles confirms Accumulation .
> RSI: The Weekly RSI turning up from the "Oversold" zone (near 30-40) is a high-probability buy signal in strong uptrends.
🎯 4. Future Scenarios & Key Levels
The stock is primed for a relief rally that could turn into a new trend.
> 🐂 Bullish Targets (The Recovery):
- Target 1: ₹4,850.
- Target 2: ₹5,625
- Blue Sky: If it clears ₹5,625, the structure shifts back to a full bull run targeting ATHs.
> 🛡️ Support (The "Must Hold"):
- Immediate Support: ₹4,100 . The "Shoulder" of the reversal pattern.
- Stop Loss: A close below ₹3,850 would invalidate the Morning Star and suggest a deeper fall to ₹3,400.
Conclusion
This is a Grade A Reversal Setup.
> Refinement: The structure is "Oversold Bounce" turning into "Trend Reversal."
> Strategy: This is an ideal entry point. Accumulate near ₹4,200–4,300 with a stop at ₹3,850 for the ride back to ₹4,850+ .
Hammer
Bearish Hammer - Ema and Rsi Confirmation🔎 Overview
The Bearish Hammer with EMA and RSI Confirmation is a structure-based reversal setup that focuses on price rejection at higher levels, supported by EMA positioning and RSI behavior. This setup helps filter weak candles and highlights situations where selling pressure begins to emerge after an upward move.
────────────────────────────
📘 EMA & RSI
EMA (Exponential Moving Average)
• EMA represents short-term price balance and dynamic support/resistance.
• The EMA High–Low Band defines the acceptable price zone for healthy trend structure.
RSI (Relative Strength Index)
• RSI measures momentum strength.
• The RSI MA (signal line) helps confirm whether momentum is sustaining or shifting.
────────────────────────────
🛠 How to Use
Bearish Hammer Formation Rules
• The Bearish Hammer must form at a swing high.
• The candle should show rejection from higher prices with a long upper wick.
• This indicates exhaustion of upward price movement.
────────────────────────────
✅ Validation & Devalidation Rules
Validation (Reversal Confirmation)
• A successive candle close below the low of the Bearish Hammer confirms the setup.
• This shows acceptance below the rejection zone.
Devalidation (Failure Protection)
• A successive candle close above the high of the Bearish Hammer invalidates the setup
────────────────────────────
📌 EMA Band Confirmation
• The Bearish Hammer must form completely above the EMA High–Low Band.
• The EMA High–Low Band should NOT touch the Bearish Hammer candle.
• This confirms that price is stretched away from value and rejection is valid.
────────────────────────────
📉 RSI Confirmation
• RSI should be above its MA line.
• This reflects mature momentum before rejection occurs.
• RSI alignment helps filter low-quality signals.
────────────────────────────
📊 Chart Explanation
• Bearish Hammer forms at a clear swing high.
• EMA High–Low Band remains below the candle, confirming price extension.
• Validation and devalidation lines define the decision zone.
• RSI supports momentum context during the setup.
────────────────────────────
📝 Summary
• Swing-high Bearish Hammer highlights rejection.
• EMA High–Low Band confirms price stretch.
• RSI MA alignment validates momentum context.
• Validation and devalidation levels provide clear structure.
• The setup emphasizes rule-based and disciplined analysis.
────────────────────────────
⚠️ Disclaimer
📘 For educational purposes only.
🙅 Not SEBI registered.
❌ Not a buy/sell recommendation.
🧠 Purely a learning resource.
📊 Not Financial Advice.

ETH BIG HAMMERAfter good correction ETH has made a hammer at the previous liquidity zone (Support).
One can look for Buy on dip from here on in ETH.
SL- 4070
Target- 4300, 4370, 4400
Disclaimer- This is just for Education Purpose.
Follow for mor such content and learnings.
Jai Shree Ram.

VERANDA - Breakout and RetestPrice breakout triangle and came back inside the triangle and it formed hammer like candle now (Weekly Timeframe). We should consider entering a trade only if a strong green candle forms in the next session. On the daily timeframe, it appears to be forming a morning star-like structure.

JUBLFOOD formation of Double BottomDouble bottom chart pattern formed in JUBLFOOD and pattern will active only after break and close above 470.
It is also important to note that JUBLFOOD is bounced back from prior support level with formation of bullish candlestick called Hammer.
Price is also pierced the downtrend line and currently price is consolidating near neckline.
We have also found inside bar pattern near the neckline, if upside breakout is sustained then we can get sharp up move or else pattern will be invalid.

HCLTECH, Stock of the WeekAfter a strong hammer candle from the low, the price has formed a three soldiers pattern.
Also the price has given the breakout of the LTMA band.
CMP:1,431.50
R1-1,531.45
S1-1,350.90
Disclaimer : This is my pre market analysis and my trading journal. Not a suggestion to buy or sell.

PNB, Intraday View for 23-MayDaily: Trend Negative, The Hammer candle formed in the compression zone decreases the probability of the next negative candle.
5m TF: Trend Positive, Break of Structure

METROPOLISMETROPOLIS
get trail of another one study of my bottom fishing scanner this name is eRHr buy at LTP . trg is 1) 1700 2) 1800.
1) good support zone .
2) technically swing trading set up
3) and last one is "my efforts "
.If You LIKE MY Idea …please…Boost its for motivation for study .
for MORE check in my TradingView ID
“Disclosure : I am not Sebi-registered.” This channel is for only educational purpose. Any profit/loss, I am not responsible.
Before taking any trade on our charts /calls , please consult your financial advisors. Thank you

BHARTIARTL, 1D formed Hammer on supportNSE:BHARTIARTL formed Hammer on 9 ema and support area.
Entry : 920.25
Target : 943.50
SL : 899
RR : 1.1

LAURUSLABS, 1D formed hammer on 200 emaNSE:LAURUSLABS formed Hammer on support as well as on 200 ema.
Entry : 394
Target : 427.25/411.5
SL : 378.5
RR : 0.85/1.1

Hammer in BEL, 1DNSE:BEL formed Hammer and gave closing above it.
Entry : 137.65
Target : 143.35
SL : 133
RR : 1.2

Hammer in FINPIPE, 1D NSE:FINPIPE formed Hammer and gave rejection on 50 ema and today it gave closing above it with above average volumes.
Entry : 228.25
Target : 250/280
SL : 210
RR : 1.22

IDFCFIRSTB, 1D forms Hammer on 21 EMANSE:IDFCFIRSTB formed Hammer on on Daily TF taking support on 21 ema. The stock is above 21 ema from past 6 months, and it bounces from 21 ema as it touches it.
Entry : 94.55
Target : 100.25/104.5
SL : 88.85
RR : 1/1.75

Hammer on HINDCOPPER, 1DNSE:HINDCOPPER formed Hammer on Daily TF.
Entry : 161.95
Target : 172.30
SL : 150
RR : 0.87
Can hold position for RR : 1

Investing in Uncertain Times Amid Gaza-Israel ConflictOn Monday it looks like Nifty will see 19550 level and post that will start upward journey !!
Overall nifty is poised for a good run upwards !!
Waiting to take out 19750-85 levels and 19850-880 level for strong rally to start.

Hammer in TATACHEM, 1DNSE:TATACHEM formed hammer and gave closing above it.
Entry : 1045
Target : 1075
SL : 1019
RR : 1.15

Hammer in MARICO, 1DNSE:MARICO formed hammer on supporting trendline on daily TF.
Entry : 578.8
Target : 590
SL : 567.65
RR : 1

ABCAPITAL, 1D form hammer on supportNSE:ABCAPITAL formed hammer on support zone and on lower level of parallel channel and gave closing above the hammer candle on Daily TimeFrame.
Entry : 184.55
Target : 192.5/193.6
SL : 175.5
RR : 0.88/1

HONAUT, 1D forms Hammer after a dwntrndNSE:HONAUT Honeywell Automation India Limited (HAIL) is a ~$350 million+ company listed on the Bombay Stock Exchange (BSE) and the National Stock Exchange (NSE). It was incorporated in India in 1984 and its registered office in Hadapsar, Pune. HAIL is a leader in providing integrated automation and software solutions, including process solutions and building solutions. It has a wide product portfolio in environmental and combustion controls, and sensing and control, and also provides engineering services in the field of automation and control to global clients.
HONAUT dorms Bullish Hammer after a downtrend on Daily time frame and gave closing above it.
Entry : 39941
Target : 41100/41400
SL : 38600
RR : 0.85/1

Divislab,1D formed HammerDivi's Laboratories Limited is an Indian multinational pharmaceutical company and producer of active pharmaceutical ingredients and intermediates, headquartered in Hyderabad. The company manufactures and custom synthesizes generic APIs, intermediates.
Hammer formed in Divislab , 1d with parallel channel support
Entry : 3629
Target : 3735
SL : 3525
RR : 1

ICICIPRULI, 1D formed hammer.NSE:ICICIPRULI ICICI Prudential Life Insurance Company Limited is a life insurance company in India. Established as a joint venture between ICICI Bank Limited and Prudential Corporation Holdings Limited, ICICI Prudential Life is engaged in life insurance and asset management business.
ICICIPRULI forms bullish hammer on 6 sept,2023 and gave closing above hammer on 7 sept,2023 on support line.
Entry : 547.15
Target : 560.5
SL : 530
RR : 1.06

l o n g l i v e L A R S E NLT fut made hammer pattern on an hourly chart & has highest PE writing on 2640 with addition of 4.8%.
Could be bought with very small stoploss below hammer low of 2634.

Buy FINPIPE @ 168 "Delivery Idea 13-06-23
FINPIPE (CMP: 168.1)
Buy Price: 168
SL Below: 160
Target: 196"
