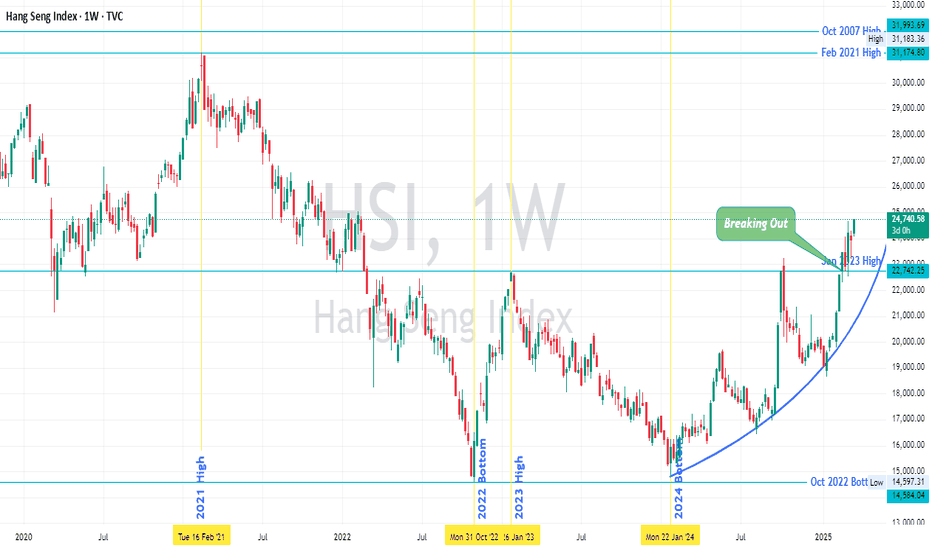
Hang Seng Index (HSI) 's Price Action vis-à-vis Major PivotsHSI seems to have broken out of last year's high (Oct 2024) and Jan 2023 high, and retested it too.
The index is about 67% from Jan 2024 low.
The next major pivot is Feb 2021 High, after that Oct 2007 High and then Jan 2018 High (all are marked on chart).
The price seems to be gaining momentum and moving parabolically, as marked on chart.
It seems price will move higher over months, of course there would be retracements.
As always it won't be as predictable as I have hypothesized above.
Nevertheless at this juncture price action is positive and depending upon price action further into the months the hypothesis will succeed or fail.
Trade Safe
Hangsengindex
Hang Seng Ready for Wave 3Hang Seng tech is finally getting ready for Wave 3. To play safe, we'll consider it as a corrective move, which can also go till 5700: ~50% from here.
If it turns out to be Wave 3, then long way to go.
One step at a time - Let's wait for the trendline (black) to break.
Disclaimer: Have position in ETF - MAHKTECH
Hang Seng Tech - Defining MomentHSTECH has gone through a deep correction in last few years.
My wave counts suggest that the bottom has been made and it's the beginning of the next leg up/ or at least a big enough pullback of the entire fall - in any case a good bullish trade.
We have completed Wave 1 and 2 and Wave 3 has begun.
Within wave 3, just minor 1 and 2 have been done and we are in 3 of 3.
View negates if we break 2990.
MAHKTECH is an ETF in India for trading this index.
Disclaimer: Invested.
HANG SENGHello & welcome to this analysis
HANG SENG is entering the PRZ of two bullish Harmonic Trading Patterns in the monthly time frame, Cypher and Butterfly.
The index has been in a downtrend since 2017, the potential reversal zone is between 14450-13950 would also coincide with a probable parallel channel starting from 2008.
In India the Nippon India ETF Hang Seng Bee (HNGSNGBEES) is listed in BSE. One can look at it from a medium to long term investment perspective since this is a monthly reversal signal coming up.
Happy Investing
HSI 1 Day Time Frame Chart - Short till 22050As after the bearish setup on daily time frame the market is falling making inverted flags again it looks like an inverted flag which is a decent flag. Targets can act as support or resistance, trade what you see. trail profits at every target or SL at cost.


