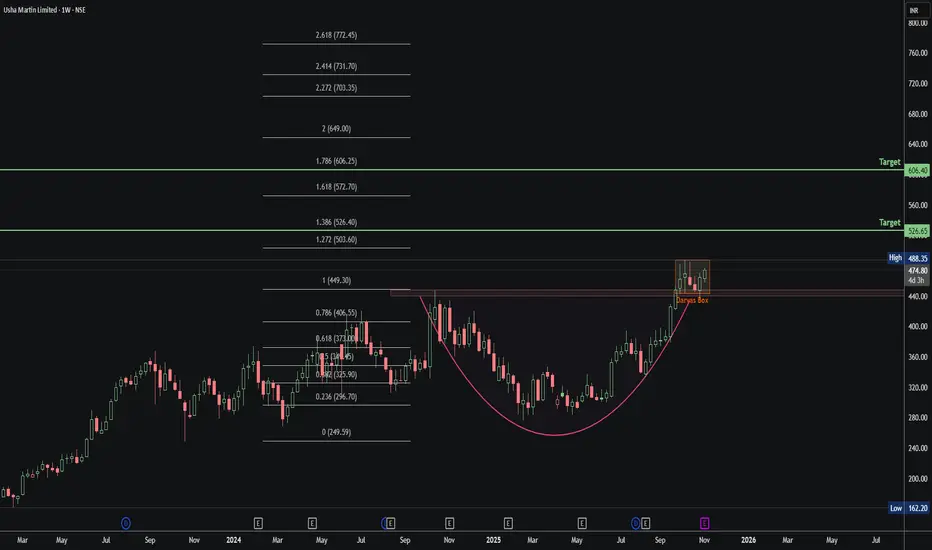
Usha Martin: Cup & Handle Breakout Loading!🧩 1. Cup & Handle Setup
Smooth U-shaped Cup with a tight Darvas Box Handle on top.
Classic bullish continuation structure — breakout confirmation above ₹488.
📈 2. Fibonacci Outlook
0.786 (₹406) → Neckline retest
1.0 (₹449) → Cup breakout
1.272 (₹503) / 1.386 (₹526) → 🎯 Short-term targets
1.618 (₹572) / 1.786 (₹606) → 🎯 Mid-term targets
🧱 3. Darvas Box
Tight consolidation between ₹471–₹488.
Low-volume zone = accumulation before breakout.
Break above ₹488 → continuation toward fib targets.
🔍 4. Key Levels
Support: ₹440 / ₹406
Resistance: ₹488
Targets: 🎯 ₹526 → ₹606 → ₹649
Invalidation: Close below ₹380
⚙️ 5. Psychology
Cup = Accumulation phase
Handle (Darvas Box) = Rest before breakout
Breakout = Momentum expansion with volume.
✅ Quick Summary
Pattern: Cup & Handle + Darvas Box
Trend Bias: Bullish continuation
Breakout Zone: ₹488+
Targets: ₹526 / ₹606 / ₹649
Stop Zone: Below ₹380
Harmonic Patterns
Part 1 Intraday Tradiing Master ClassTypes of Options
There are two basic types of options:
a. Call Option
A Call Option gives the buyer the right to buy an underlying asset at the strike price before the expiry date.
The buyer of a call expects the price of the asset to rise.
The seller (writer) of a call expects the price to fall or remain stable.
b. Put Option
A Put Option gives the buyer the right to sell an underlying asset at the strike price before expiry.
The buyer of a put expects the asset’s price to fall.
The seller (writer) of a put expects the price to rise or remain stable.

Part 3 Institutional Trading Options as Hedging Tools
One of the main reasons institutions and traders use options is for hedging. For instance:
A portfolio manager can buy put options to protect against a fall in market prices.
A trader can sell covered calls to earn additional income while holding long-term positions.
This risk management function makes options a vital component of modern financial markets.

PNB 1 Month Time Frame 📊 Key price data
Latest close: ₹116.94 (approx)
52-week high: ~ ₹120.20
1-month range: roughly ₹112-₹124
🧭 Support & Resistance Levels
Support zone: ~ ₹112-₹114 — recent monthly lows around ₹112.02.
Resistance zone: ~ ₹123-₹124 — recent highs in that band.
Resistance zone: ~ ₹123-₹124 — recent highs in that band.

$LTC to $500–$1000? Could Explode in the Next Alt SeasonCRYPTOCAP:LTC to $500–$1000? Could Explode in the Next Alt Season
CRYPTOCAP:LTC has been slow-growing, but I see strong potential here. I’m holding tight.
Imo, CRYPTOCAP:LTC could easily hit $500 during the next alt season. If it drops below or near $90, that’s a solid opportunity to accumulate for long-term gains.
A 10x from here isn’t impossible: $500–$1000 is within reach, but it will require patience.
Worth noting: CRYPTOCAP:LTC didn’t hit a new ATH after the 3rd halving, unlike the first two, which reached new highs within about 1000 days. This suggests there’s still a real chance for CRYPTOCAP:LTC to hit a new ATH within the next one Year.
Stay patient, plan your entries, and don’t get caught up in FOMO.
⚠️ Disclaimer: NFA. Crypto is risky. DYOR and only invest what you can afford to lose.

“Nifty 50 Intraday Key Levels | Buy & Sell Zones 4th Nov 2025”Want to learn more? Like this post and follow me!”
26070🔴 Above 10m closing Shot Cover Level
Strong resistance — short covering likely above this.
25938🟠 Below 10m hold PE By level /
Above 10m hold CE by level
25838🟣 Above 10M hold positive trade view
Below 10M hold negative trade view
Sentiment deciding level — crucial for trend direction.
25722⚫ Above Opening S1 10m Hold CE By level
Bullish entry level — CE hold area.
25633🟠 Below Opening R1 10m Hold PE By level
Below 10m hold PE By Risky Zone Weak zone — PE may strengthen below this.
25530🟢 Above 10M hold CE By Safe Zone level
Safe bullish zone — CE can be held confidently above.
25490🔵 BELOW 10M hold UNWINDING level
Breakdown zone — unwinding or heavy selling possible below.

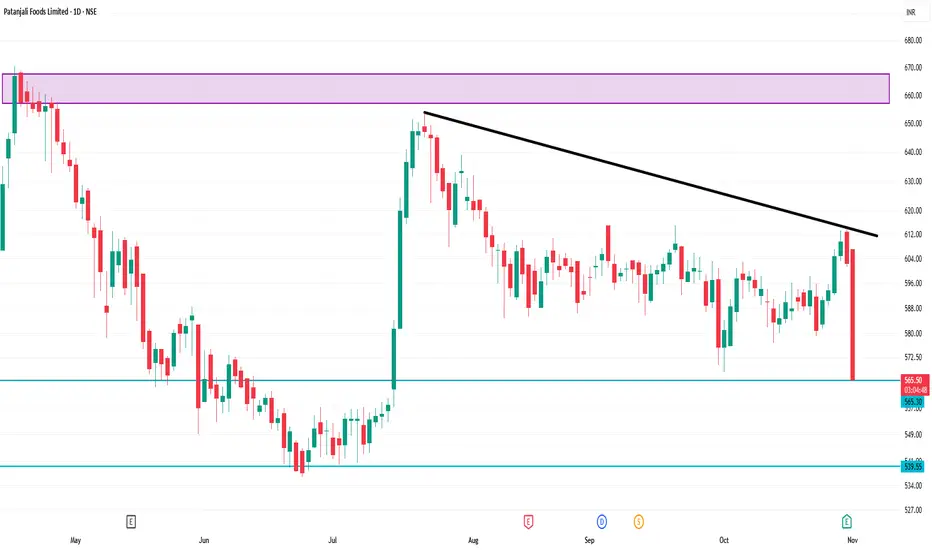
PATANJALI 1 Day Time Frame📊 Key levels to watch
From the “pivot point” data available:
Pivot (approx): ₹ 571.62
First support level: ~ ₹ 562.84
Second support level: ~ ₹ 565.72
First resistance above pivot: ~ ₹ 574.64
Further resistance: ~ ₹ 577.52
So for the day, one might watch roughly ₹ 562-570 as support range and ₹ 574-578 as near-term resistance.
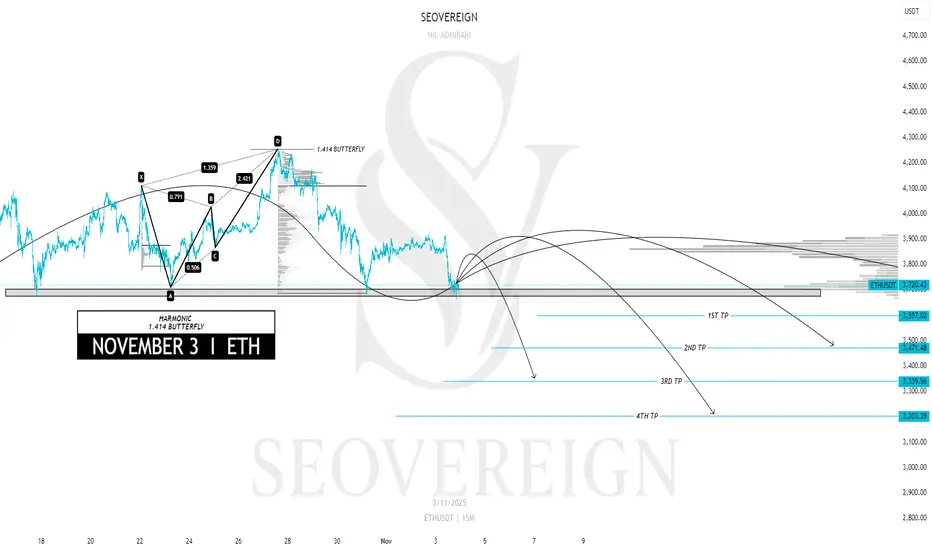
[SeoVereign] ETHEREUM BEARISH Outlook – November 03, 2025I would like to share my Ethereum idea as of November 3.
This idea is an extension of the one from October 27. The short positions entered on the 27th will be closed in profit in connection with this idea, and I plan to add some additional positions at the same time.
Basis — Harmonic 1.414 Butterfly Pattern
Currently, Ethereum is approaching the completion zone of the 1.414 Harmonic Butterfly pattern that I personally designed.
This zone is structurally an overextension area,
where a strong technical reversal possibility exists.
Accordingly, I set the average target price around 3,400 USDT.
Further position management and updates will be provided depending on market conditions.
Thank you for reading.
Part 1 Ride The Big Moves Option Expiry and Settlement
Every option has an expiry date. In India:
Index options (like Nifty and Bank Nifty) are cash-settled.
Stock options are physically settled, meaning actual delivery of shares can occur if positions are held until expiry.
As the expiry date approaches, time decay (Theta) reduces the option’s value if the underlying doesn’t move in the trader’s favor.

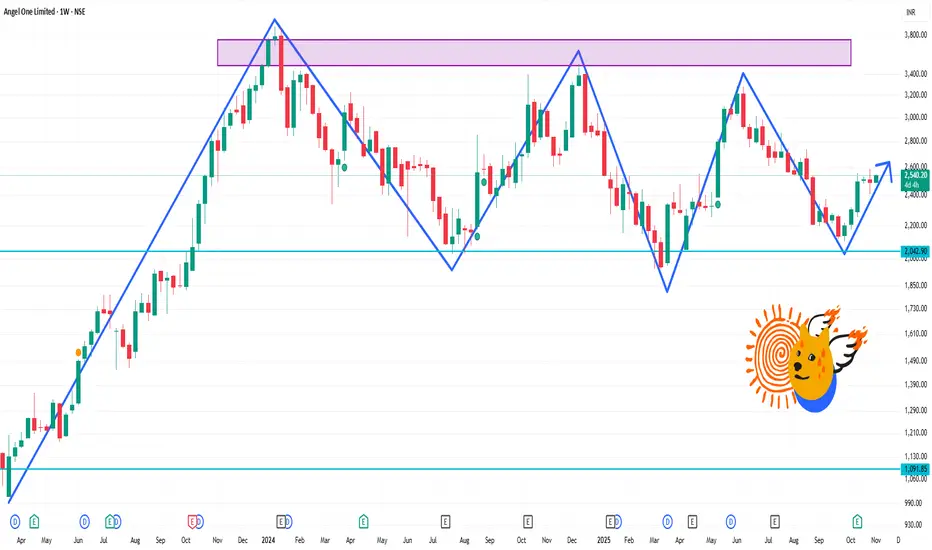
ANGELONE 1 Week Time FrameCurrent price ≈ ₹2,514.50.
Support zone: ~ ₹2,450-2,480
Resistance / near term ceiling: ~ ₹2,560-2,600
If momentum builds: breakout above ~ ₹2,600 could target ~ ₹2,650-2,700
On weakness: below ~ ₹2,450, watch for a move toward ~ ₹2,400
[SeoVereign] BITCOIN BEARISH Outlook – November 03, 2025I would like to share my Bitcoin idea as of November 3.
This idea is an extension of the one from October 27. The short positions entered on the 27th will be closed in profit in connection with this idea, and I plan to add some additional positions at the same time.
This idea is based on a bearish (short) perspective,
and I see a high possibility of a downward correction based on technical grounds.
First Basis — FIBONACCI 1.272 Retracement
Currently, Bitcoin is located in the 1.272 retracement zone relative to the previous downward movement.
This is generally recognized as the completion zone of a rebound,
where buying pressure tends to weaken and selling pressure begins to appear.
Second Basis — Trendline Breakdown
Bitcoin has clearly broken below the short-term ascending trendline.
This indicates the end of the short-term upward movement
and suggests the potential for a new downward trend reversal.
Accordingly, I set the average target price around 100,600 USDT.
Further position management and updates will be provided depending on market developments.
Thank you for reading.

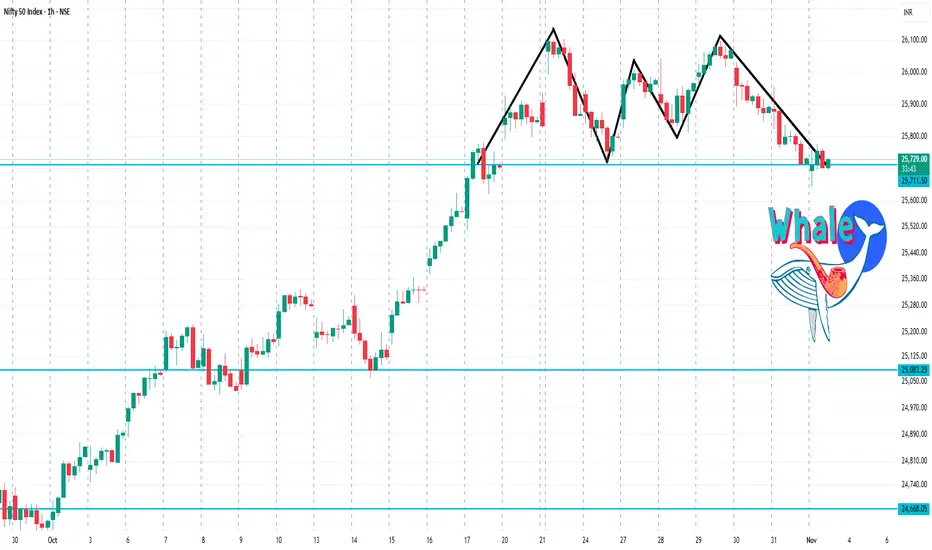
Nifty 1 Hour Time Frame ✅ Key Supports
Around 25,600-25,700: Short-term pullbacks may find support in this zone.
Deeper support near 25,300: If the above fails, this next level may become relevant.
🚧 Key Resistances
Roughly 26,000-26,250: This zone appears to be a meaningful resistance band.
If price clears above that, next resistance could emerge near 26,300-26,500 (though less clearly defined in current data).
Derivatives and Hedging RisksIntroduction
In modern financial markets, derivatives play a crucial role in managing uncertainty and volatility. A derivative is a financial instrument whose value is derived from an underlying asset such as stocks, commodities, interest rates, currencies, or indices. These instruments are widely used by investors, corporations, and financial institutions to hedge risks, speculate on price movements, and enhance portfolio performance.
Hedging, on the other hand, refers to the practice of reducing or offsetting potential losses from adverse price movements in an asset. Derivatives are the most efficient tools for hedging because they allow traders to take positions that move inversely to their underlying exposures. Together, derivatives and hedging form the backbone of risk management strategies in global financial systems.
Understanding Derivatives
Derivatives are contracts between two or more parties whose value is based on agreed-upon financial variables. These instruments do not necessarily involve the actual buying or selling of the underlying asset. Instead, they function as financial agreements to exchange cash flows or values based on the performance of the underlying asset.
Main Types of Derivatives
Futures Contracts
Futures are standardized agreements traded on exchanges to buy or sell an asset at a predetermined price and date in the future. Futures are used extensively for hedging commodities, currencies, and indices.
Example: A farmer might sell wheat futures to lock in prices before harvest to protect against falling wheat prices.
Forwards Contracts
Forwards are similar to futures but are traded over-the-counter (OTC) and customized to suit the needs of the buyer and seller. Since they are not standardized, they carry higher counterparty risk.
Example: An importer may enter a forward contract to purchase U.S. dollars at a fixed rate three months ahead to guard against currency depreciation.
Options Contracts
Options give the holder the right, but not the obligation, to buy (call option) or sell (put option) an asset at a predetermined price before or on a specific date. Options are flexible instruments for both hedging and speculation.
Example: An investor may buy a put option on a stock to protect against a potential price decline.
Swaps
Swaps involve the exchange of cash flows between parties, often related to interest rates or currencies. The most common types are interest rate swaps and currency swaps.
Example: A company paying variable interest might enter an interest rate swap to exchange its variable payments for fixed ones, reducing exposure to interest rate fluctuations.
Purpose and Importance of Derivatives
Derivatives serve several essential functions in financial markets:
Risk Management (Hedging) – The most important function of derivatives is to mitigate risk. Investors use derivatives to protect against price changes in commodities, currencies, or securities.
Price Discovery – Futures and options markets provide valuable information about future price expectations, helping businesses plan production and investment.
Market Efficiency – Derivatives improve liquidity, allowing for more efficient capital allocation and portfolio diversification.
Leverage and Speculation – They allow investors to take large positions with smaller capital outlays, though this can increase potential losses.
Understanding Hedging
Hedging is a defensive strategy used to offset potential losses in one position by taking another position in a related derivative instrument. The goal is not to generate profit but to minimize uncertainty and protect against adverse movements.
How Hedging Works
The process of hedging typically involves identifying a risk exposure and then selecting an appropriate derivative instrument to counterbalance that risk.
For example:
An airline company concerned about rising fuel costs might use crude oil futures to lock in fuel prices.
A multinational firm expecting payment in euros might use currency forwards to secure the current exchange rate.
By doing so, these entities ensure that fluctuations in market prices do not drastically affect their financial outcomes.
Common Hedging Instruments
Futures and Forwards for Price Risk
Companies use these contracts to fix the buying or selling price of an asset. This reduces uncertainty in cash flows and budgeting.
Options for Downside Protection
Options allow investors to protect against losses while still participating in potential gains. This is often referred to as an “insurance strategy.”
Swaps for Interest Rate and Currency Risk
Swaps are commonly used by corporations to stabilize cash flows and reduce borrowing costs when dealing with fluctuating interest rates or foreign currencies.
Hedging Strategies in Practice
Commodity Hedging
Producers and consumers of commodities such as oil, gold, or wheat use futures and options to stabilize prices and manage inventory risk.
Currency Hedging
Exporters and importers use forward or futures contracts to protect against adverse exchange rate movements. This ensures predictable revenue and cost structures.
Interest Rate Hedging
Financial institutions use interest rate swaps and futures to manage exposure to changing interest rates. For instance, banks with variable-rate assets and liabilities often hedge to maintain stable margins.
Equity Hedging
Investors use options and index futures to protect portfolios from market downturns. A common approach is buying put options on indices to limit losses during a market correction.
Advantages of Using Derivatives for Hedging
Risk Reduction – The primary advantage is minimizing exposure to market volatility.
Cost Efficiency – Derivatives require smaller initial investments than directly buying or selling the underlying asset.
Flexibility – With multiple contract types and structures, hedgers can customize their risk management approach.
Liquidity and Accessibility – Exchange-traded derivatives are liquid and transparent, offering ease of entry and exit.
Risks and Limitations of Derivatives and Hedging
While derivatives are powerful tools, they also carry certain risks that must be carefully managed.
Market Risk – Prices may move unpredictably, resulting in losses even in hedged positions.
Credit (Counterparty) Risk – In OTC contracts like forwards and swaps, there is a risk that one party may default.
Liquidity Risk – Some derivatives may lack buyers or sellers, making it hard to exit positions.
Operational Risk – Errors in execution, settlement, or valuation can lead to losses.
Basis Risk – The hedge and the underlying exposure may not move perfectly in correlation, resulting in imperfect hedges.
Speculative Misuse – Derivatives can be misused for speculative purposes, amplifying losses due to high leverage.
Regulatory Framework and Risk Management
Post the 2008 financial crisis, global regulators emphasized transparency, reporting, and clearing mechanisms for derivatives. Institutions are now required to:
Use central clearinghouses for standardized contracts.
Maintain adequate collateral (margin) to cover exposures.
Conduct regular stress testing and valuation reviews.
These measures aim to reduce systemic risk and ensure that derivatives serve their intended purpose—effective risk mitigation.
Conclusion
Derivatives and hedging together represent the foundation of modern financial risk management. Derivatives provide powerful mechanisms to transfer and manage risk efficiently, while hedging strategies enable investors and corporations to protect themselves from adverse market movements. When used responsibly, derivatives help stabilize earnings, control costs, and improve financial predictability.
However, their complexity demands a deep understanding and disciplined application. Poorly designed or speculative use can lead to severe financial losses, as history has shown. The key to success lies in prudent strategy, robust regulation, and transparent practices. In essence, derivatives and hedging transform uncertainty into opportunity—offering stability in an unpredictable financial world.
$Q ALERT | TECHNICAL SETUP (500% Potential Setup)$Q ALERT | TECHNICAL SETUP (500% Potential Setup)
Q/USDT is sitting on a strong demand zone at $0.014–$0.016. If it holds & sustains above, we could see a potential rally toward $0.10 (~500% from this zone).
✅ Bullish structure: Price above demand = trend intact
❌ Invalidation: Price closes below demand = setup fails
Keep an eye on this key level. NFA & DYOR

The Relationship Between Risk and Position Size1. Understanding Risk in Trading
Risk in trading refers to the potential for financial loss on a given trade or investment. Every time you enter a trade, you expose yourself to uncertainty — the market may move in your favor, but it can also move against you.
Traders quantify risk in several ways:
Monetary Risk: The amount of money that could be lost on a trade.
Percentage Risk: The portion of total account capital that could be lost if the trade fails.
Market Risk: The possibility of price movement against your position due to volatility, news, or macroeconomic factors.
For instance, if you have a ₹100,000 trading account and you risk ₹2,000 on a single trade, your risk per trade is 2% of your capital. Managing this risk percentage is fundamental to long-term survival in the markets.
2. What Is Position Size?
Position size determines how much of your total trading capital you allocate to a specific trade. It’s not just about how many shares or contracts you buy; it’s about how much money you’re willing to risk on that position.
For example, suppose you buy 100 shares of a stock at ₹500 with a stop-loss at ₹490. Your risk per share is ₹10, and the total risk on the trade is ₹1,000 (100 shares × ₹10). If your maximum risk per trade is ₹1,000, then your position size (100 shares) aligns perfectly with your risk tolerance.
Thus, position size acts as a bridge between your risk limit and market volatility.
3. The Risk-Position Size Equation
The core relationship between risk and position size can be summarized in one simple formula:
Position Size = Account Risk Amount / Trade Risk per Unit
Where:
Account Risk Amount = (Total account balance × Percentage of risk per trade)
Trade Risk per Unit = (Entry price − Stop-loss price)
Example:
Let’s say:
Account size = ₹200,000
Risk per trade = 2% (₹4,000)
Entry = ₹1,000, Stop-loss = ₹980 (₹20 risk per share)
Then:
Position Size = ₹4,000/ ₹20 = 200 shares
This means you can safely buy 200 shares of that stock while keeping risk under 2% of your capital.
4. Why Position Sizing Is Critical
Position sizing is one of the most effective tools for controlling risk and ensuring longevity in trading. Even if you have an excellent strategy, poor sizing can wipe out your account after just a few losing trades.
Here’s why it matters:
Capital Preservation: Proper position sizing ensures you never lose too much on a single trade.
Emotional Stability: Knowing your risk in advance helps reduce emotional stress during volatile market movements.
Consistency: By maintaining a fixed risk percentage per trade, your results become more predictable and controlled.
Compounding Growth: Smaller, consistent losses allow capital to compound over time rather than being eroded by large drawdowns.
5. The Role of Stop-Loss in Position Sizing
Stop-loss orders are essential in defining how much you risk per trade. Without a stop-loss, you can’t calculate your position size accurately because you don’t know where the trade is invalidated.
When traders set their stop-loss, they define:
The maximum loss per share/unit, and
The total amount they’re willing to lose on that trade.
For instance, a wider stop-loss (say ₹50 per share) means you must take a smaller position to maintain the same total risk. Conversely, a tighter stop-loss (₹10 per share) allows for a larger position. Thus, stop-loss distance directly affects position size.
6. Fixed Fractional Position Sizing
One of the most common risk management methods is Fixed Fractional Position Sizing, where you risk a fixed percentage (usually 1–2%) of your total account on every trade.
If your account grows, your risk amount grows proportionally; if your account shrinks, the amount you risk decreases automatically. This approach ensures you adapt to both profits and drawdowns dynamically.
Example:
Account Size 2% Risk per Trade ₹ Risk Amount Stop Loss (₹10) Position Size
₹100,000 2% ₹2,000 ₹10 200 shares
₹120,000 2% ₹2,400 ₹10 240 shares
₹80,000 2% ₹1,600 ₹10 160 shares
This method helps traders scale their positions safely as they grow their capital.
7. Risk-to-Reward Ratio and Position Size
While position size controls risk, the risk-to-reward ratio (R:R) determines whether a trade is worth taking. Traders typically look for trades where the potential reward outweighs the risk — often at least 1:2 or 1:3.
For instance, if your stop-loss is ₹10 below entry and your target is ₹30 above, your R:R is 1:3. Even with a 40% win rate, you can still be profitable because your winning trades yield more than your losses.
Position sizing ensures that even if you lose multiple trades in a row, your average loss remains small, while profitable trades make up for the setbacks.
8. The Psychological Connection
Traders often underestimate the psychological comfort that comes from correct position sizing. Over-leveraging — taking oversized positions relative to account size — leads to stress, fear, and impulsive decisions. On the other hand, trading too small may limit returns and confidence.
A well-calibrated position size:
Reduces fear of loss
Prevents emotional overreaction
Builds trading discipline
Psychologically, traders who respect their risk limits are more consistent because they are not emotionally attached to single trades — they think in terms of probabilities rather than outcomes.
9. Advanced Approaches to Position Sizing
Professional traders often use adaptive or dynamic position sizing models, which adjust based on volatility, performance, or confidence level.
Volatility-Based Position Sizing: Uses tools like Average True Range (ATR) to adjust position size. If volatility increases, position size decreases to maintain consistent risk.
Kelly Criterion: A mathematical model used to maximize long-term growth by balancing risk and return.
Equity Curve-Based Adjustments: Increasing risk slightly after winning streaks or reducing it during drawdowns to manage performance-based emotions.
These methods fine-tune the balance between aggression and safety.
10. The Balance Between Risk and Opportunity
The relationship between risk and position size is about finding equilibrium — taking enough risk to grow your capital but not so much that you blow up after a few losses.
Trading is not about avoiding risk entirely; it’s about controlling and pricing it intelligently. When position sizing is aligned with your risk tolerance, trading edge, and emotional stability, you achieve consistency — the key to long-term profitability.
Conclusion
The relationship between risk and position size defines the foundation of successful trading. Without proper position sizing, even the best strategies can fail due to uncontrolled losses. By managing risk per trade, setting disciplined stop-losses, and aligning position size with account capital, traders can survive drawdowns and thrive during profitable phases.
Ultimately, trading is not about predicting every move — it’s about managing uncertainty. Position sizing transforms that uncertainty into a controlled and measurable risk, giving traders the confidence and consistency needed to succeed in any market environment.
In short: Position sizing is not just a number — it’s your safety net, your strategy, and your survival plan.
Bitcoin From $49k to $126k Target Achieved 📢 Hope you didn’t miss this…
On April 7, 2024, I posted my CRYPTOCAP:BTC chart calling for buys below $50K.
Bids filled perfectly at $49K, and price exploded to a new ATH at $126K.
That’s a +157% move, level-to-level, exactly as projected.
No hype: Just pure technical precision and liquidity flow mastery.

Bitcoin from $49k to $126k Target Achieved 📢 Hope you didn’t miss this…
On April 7, 2024, I posted my CRYPTOCAP:BTC chart calling for buys below $50K.
Bids filled perfectly at $49K, and price exploded to a new ATH at $126K.
That’s a +157% move, level-to-level, exactly as projected.
No hype: Just pure technical precision and liquidity flow mastery.

Part 9 Trading Master Class With ExpertsTypes of Options
Options can be classified in different ways:
Based on Style:
European Options – can only be exercised on the expiry date.
American Options – can be exercised any time before expiry.
Based on Underlying Asset:
Stock Options – based on shares of companies.
Index Options – based on market indices like Nifty or Bank Nifty.
Commodity Options – based on commodities like gold or crude oil.
Currency Options – based on currency pairs like USD/INR.

Part 6 Learn Institutional Trading Key Terminology in Option Trading
Before trading options, understanding the terminology is crucial:
Underlying Asset: The financial asset (e.g., Nifty 50 index, stock, commodity) on which the option is based.
Strike Price: The fixed price at which the option holder can buy or sell the underlying asset.
Premium: The price paid by the buyer to the seller for obtaining the rights of the option.
Expiration Date: The date on which the option contract expires.
In-the-Money (ITM): When exercising the option would be profitable.
Out-of-the-Money (OTM): When exercising the option would not be profitable.
At-the-Money (ATM): When the market price equals the strike price.

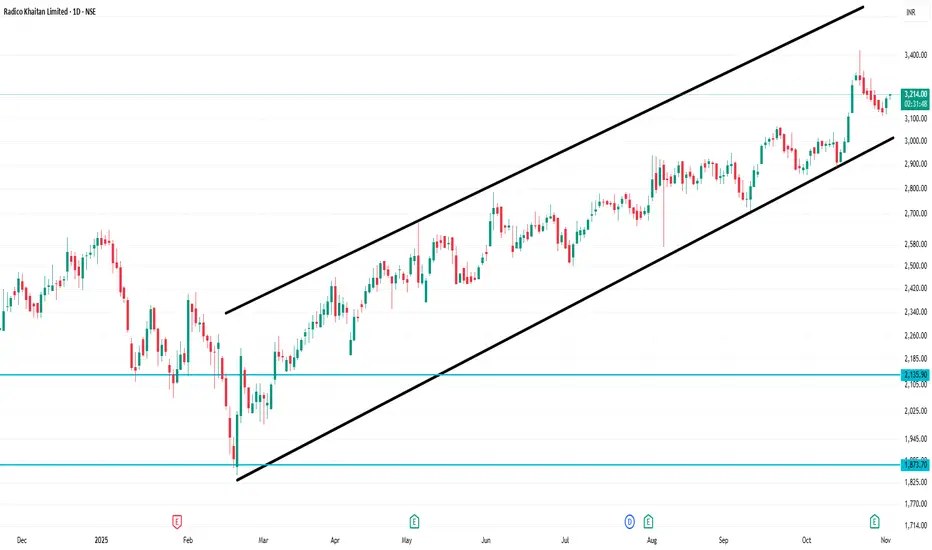
RADICO 1 Day Time Frame 🔍 Current price snapshot
Recent price: ~ ₹3,220 on the NSE.
The stock has its 52-week high around ~ ₹3,423 and 52-week low around ~ ₹1,845.
📈 Key technical levels (1-day frame)
Based on available pivot / support/resistance data:
Pivot (daily): ~ ₹2,831.17.
Immediate supports: ~ ₹2,777.77 (S2) and ~ ₹2,800.93 (S1).
Immediate resistances: ~ ₹2,884.57 (R2) and ~ ₹2,907.73 (R3).
Using another source: Support ~ ₹3,143.31 and ~ ₹3,125.26; Resistance ~ ~₹3,219.81 & ~₹3,249.03.
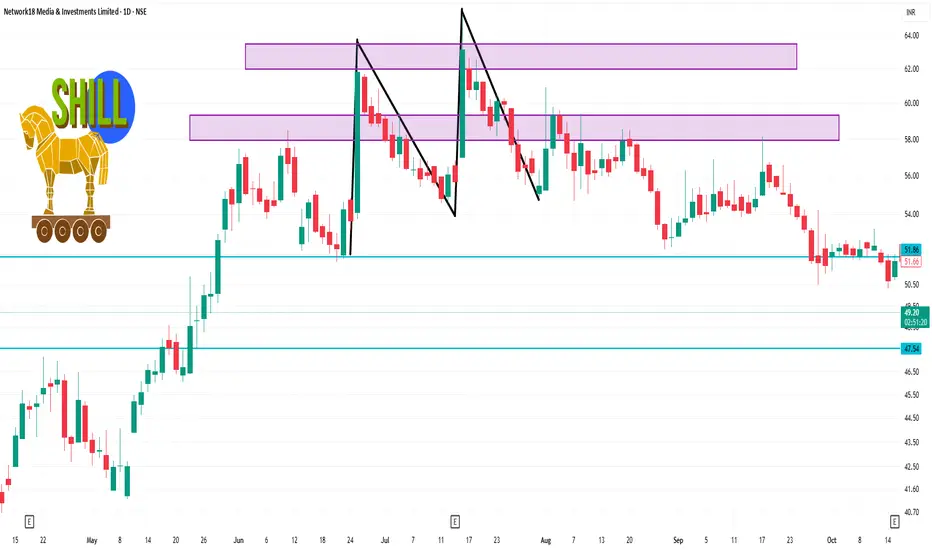
NETWORK18 1 Day Time Frame 📊 Key daily levels to watch
Here are approximate levels based on recent data:
Support: around ₹47.50-₹48.00 region (the near lower band)
Resistance: around ₹50.00-₹52.00 region — a near barrier if the stock tries to bounce.
Pivot/central reference: ~ ₹48.15 (classic pivot) for the day.
📌 Interpretation for a Day Trader
a) If price remains above ~₹48.00 and holds, that level may act as a short-term base.
b) A decisive break above ~₹49.50-₹50.10 with good volume could open a short relief move towards the next resistance zone.
Conversely, a break below ~₹47.50 would signal risk of deeper downside and may invalidate the c) short-term support.
d) Because the trend/indicator setup is weak (daily technicals show “Strong Sell” for daily timeframe), any long trade should be cautious and risk-managed.
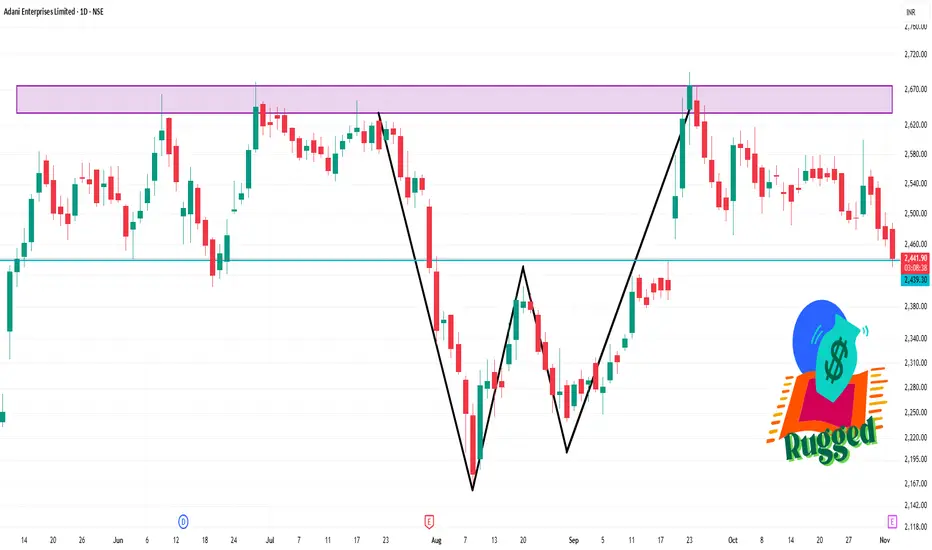
ADANIENT 1 Day Time Frame ✅ Important Levels
From the pivot-point and support/resistance calculations:
Pivot (Classic) ≈ ₹ 2,448.43
Resistance levels: ≈ ₹ 2,466.16 (R1) / ₹ 2,493.93 (R2)
Support levels: ≈ ₹ 2,420.66 (S1) / ₹ 2,402.93 (S2)
🧭 What to watch in the near term
a) If price breaks above ₹2,466-2,493 and holds above, that could shift bias upward and open a test of higher resistance levels.
b) If price slips below ₹2,420-2,402, further downside risk is likely, and next support zones would become relevant.
c) Given the bearish MA structure and weak momentum, the path of least resistance right now appears downward (unless strong buying emerges).
Fundamental Analysis for Long-Term Investors1. Understanding the Concept of Fundamental Analysis
At its core, fundamental analysis (FA) seeks to answer one key question: What is the true value of this company?
By comparing the intrinsic value (calculated through analysis) with the current market price, investors can decide whether to buy, hold, or sell a stock.
If Intrinsic Value > Market Price, the stock is undervalued — a potential buying opportunity.
If Intrinsic Value < Market Price, the stock is overvalued — a signal to avoid or sell.
This method assumes that, in the long run, the market will correct any mispricing and reflect the company’s actual worth.
2. Components of Fundamental Analysis
Fundamental analysis can be divided into two main parts:
a) Qualitative Analysis
This part deals with the non-numerical aspects of a company, such as:
Business Model – How the company earns revenue and its sustainability.
Management Quality – Leadership capability and corporate governance.
Competitive Advantage (Moat) – Unique strengths like brand value, patents, or cost advantages.
Industry Outlook – Growth potential, regulatory environment, and barriers to entry.
Economic Factors – Interest rates, inflation, fiscal policy, and global market trends.
b) Quantitative Analysis
This involves examining measurable data like financial statements, ratios, and cash flows to determine a company’s financial health.
3. Key Financial Statements in Fundamental Analysis
A company’s financial statements form the backbone of fundamental analysis. Long-term investors should focus on three primary statements:
a) Income Statement
It shows the company’s profitability over a period, detailing revenue, expenses, and net income.
Key metrics:
Revenue Growth – Indicates whether the company’s sales are increasing consistently.
Operating Margin – Reflects operational efficiency.
Net Profit Margin – Shows how much profit remains after all expenses.
b) Balance Sheet
This statement provides a snapshot of the company’s financial position — assets, liabilities, and shareholders’ equity.
Important metrics include:
Debt-to-Equity Ratio (D/E) – Measures financial leverage; lower ratios imply less risk.
Current Ratio – Indicates liquidity; a ratio above 1 shows good short-term financial health.
Book Value per Share – Helps assess whether the stock is trading above or below its book value.
c) Cash Flow Statement
This shows the actual cash generated or used by the company.
Focus areas:
Operating Cash Flow (OCF) – Cash generated from core business operations.
Free Cash Flow (FCF) – Cash left after capital expenditures; indicates ability to reinvest or reward shareholders.
4. Key Financial Ratios for Long-Term Investors
Ratios simplify the evaluation of a company’s performance. Some of the most important ones are:
a) Valuation Ratios
Price-to-Earnings (P/E) Ratio – Indicates how much investors are willing to pay for each rupee of earnings. A lower P/E could suggest undervaluation.
Price-to-Book (P/B) Ratio – Compares market value to book value; useful for asset-heavy industries.
Price-to-Sales (P/S) Ratio – Ideal for companies with negative earnings but growing sales.
b) Profitability Ratios
Return on Equity (ROE) – Measures how efficiently equity is used to generate profit.
Return on Assets (ROA) – Shows how effectively the company uses its assets.
Gross and Net Margins – Indicate profitability at different stages of the income statement.
c) Liquidity and Solvency Ratios
Current Ratio & Quick Ratio – Assess short-term liquidity.
Interest Coverage Ratio – Measures ability to pay interest on debt.
d) Growth Ratios
Earnings Per Share (EPS) Growth – Consistent EPS growth indicates strong performance.
Revenue Growth Rate – Reflects expansion potential and demand.
5. Intrinsic Value and Valuation Methods
The goal of fundamental analysis is to determine intrinsic value — an estimate of what a company is truly worth. Some popular valuation methods include:
a) Discounted Cash Flow (DCF) Model
This method projects the company’s future cash flows and discounts them to present value using a required rate of return.
It’s one of the most reliable methods for estimating intrinsic value, though it requires accurate assumptions.
b) Dividend Discount Model (DDM)
Used for dividend-paying companies; it values a stock based on future dividend payments discounted to the present.
c) Relative Valuation
Compares the company’s valuation ratios (like P/E or EV/EBITDA) with peers or industry averages to assess whether it’s under or overvalued.
6. Economic and Industry Analysis
Fundamental analysis is not limited to company-level study. A top-down approach starts with understanding the broader economy and narrows down to sectors and companies.
a) Economic Analysis
Factors like GDP growth, interest rates, inflation, and fiscal policy impact company earnings and valuations. For example:
Rising interest rates can hurt highly leveraged firms.
Inflation affects input costs and consumer demand.
b) Industry Analysis
Identifying industries with favorable long-term prospects (such as renewable energy, technology, or healthcare) can improve investment success. Tools like Porter’s Five Forces help analyze industry competitiveness and profitability.
7. Qualitative Factors and Management Assessment
A company’s management team plays a vital role in long-term success. Investors should assess:
Leadership Track Record – Vision, integrity, and experience of the management team.
Corporate Governance – Transparency, accountability, and alignment with shareholder interests.
Innovation Capability – Ability to adapt to changing technology or consumer behavior.
Brand Reputation – Strength of brand loyalty and market position.
8. The Margin of Safety Principle
Coined by Benjamin Graham, the margin of safety is the difference between a stock’s intrinsic value and its market price.
For example, if a stock’s intrinsic value is ₹500 and it’s trading at ₹350, the 30% gap is the margin of safety — a cushion against analytical errors or unforeseen events.
This principle ensures that even if some assumptions go wrong, the investment remains relatively safe for the long term.
9. Long-Term Perspective and Patience
Fundamental analysis rewards patience. Stock prices can remain undervalued or overvalued for extended periods due to market sentiment or short-term volatility. However, over time, prices tend to align with intrinsic value.
Long-term investors must focus on business fundamentals, not market noise.
Compounding works best when investments are held for years in fundamentally strong companies with consistent growth, low debt, and sustainable advantages.
10. Limitations of Fundamental Analysis
While powerful, FA has its challenges:
Time-Consuming – Requires deep research and analysis.
Subjectivity – Valuation depends on assumptions that may not always be accurate.
Market Irrationality – Prices can deviate from fundamentals for long periods.
Changing Macroeconomics – Economic shocks can alter intrinsic value projections.
Thus, blending FA with periodic reviews and awareness of market cycles enhances decision-making.
Conclusion
Fundamental analysis is the foundation of successful long-term investing. It equips investors with the knowledge to differentiate between temporary market noise and genuine value. By analyzing a company’s financial health, competitive position, management quality, and future prospects, investors can make informed decisions that compound wealth over time.