XAUUSD/GOLD WEEKLY BUY PROJECTION 11.01.2026🎯 Targets
✅ Target 1: 4,550 (Previous ATH + Double Top zone)
✅ Target 2: 4,625 (Resistance R2 zone)Bullish Momentum Candle
Bullish Pin Bar
Support RetestAscending Triangle Pattern
Higher lows (keezha trend line up poguthu)
Same resistance zone (double top + previous ATH zone)
I bullish continuation pattern.
Harmonic Patterns

Part 9 Trading Master Class with Experts Risk and Reward in Options
Options trading can be profitable, but risk management is crucial:
Maximum Loss for Buyers: Limited to the premium paid.
Maximum Gain for Buyers: Unlimited for calls, limited for puts.
Maximum Loss for Sellers: Unlimited for uncovered (naked) calls, substantial for puts.
Maximum Gain for Sellers: Limited to the premium received.
Key Considerations:
Time decay (theta) erodes the value of options as expiration approaches.
Volatility changes (vega) affect pricing and profits.
Market direction (delta) determines sensitivity to underlying price changes.

Part 7 Trading Master Class With Experts Why Trade Options?
Options are popular due to their flexibility and strategic advantages:
Leverage: Options allow traders to control large amounts of the underlying asset with a smaller investment. This amplifies potential gains.
Hedging: Investors can use options to protect their portfolios against adverse price movements.
Speculation: Traders can bet on market direction, volatility, or time decay, potentially earning significant profits.
Income Generation: Selling options, particularly covered calls or cash-secured puts, can provide regular income streams.
Risk Management: Limiting losses is easier with options because the maximum loss for a buyer is the premium paid.

Part 6 Learn Institutional Trading Key Terminologies in Options Trading
Before diving into strategies and mechanics, it’s crucial to understand some foundational terms:
Underlying Asset: The security on which the option is based (e.g., stocks, indices, commodities, currencies).
Strike Price (Exercise Price): The price at which the option holder can buy or sell the underlying asset.
Expiration Date (Maturity): The date on which the option contract expires.
Premium: The cost of purchasing the option, influenced by intrinsic and extrinsic factors.
Intrinsic Value: The real, immediate value of the option if exercised now.
Time Value: The portion of the premium representing the potential for the option to gain value before expiration.
In-the-Money (ITM): A call option is ITM if the underlying price is above the strike price; a put is ITM if the underlying is below the strike price.
Out-of-the-Money (OTM): A call is OTM if the underlying price is below the strike price; a put is OTM if above.
At-the-Money (ATM): When the strike price is roughly equal to the current price of the underlying asset.

FORCEMOT 1 Day Time Frame 📊 Important Daily Levels
1. Key Support Levels
₹18,500–₹18,700 — current intraday lower range area (near recent day’s low).
~₹18,414 — Daily 50‑EMA zone (dynamic support).
~₹17,555 — Daily 100‑EMA support if price weakens further.
~₹15,478 — 200‑EMA long‑term support (major trend level).
2. Key Resistance Levels
~₹19,980–₹20,000+ — recent intraday high daily resistance.
~₹19,579–₹19,876 — shorter daily EMAs (15/5 EMA cluster).
Above ₹20,000 — break above this zone could turn trend bullish short‑term.
📈 Daily Trend & Indicators
RSI ~47 — neutral zone, not showing clear overbought/oversold bias.
MACD bearish on daily, but price still above medium & long EMAs, indicating mixed signals with possible deeper correction.
Above 50 & 100 EMA is still technically bullish overall, but short‑term momentum has weakened.
Practical Levels for Traders (Daily)
✅ Bullish above:
₹19,980–₹20,000 — daily breakout zone
Run‑up potential if sustained: ₹20,500+
⚠ Neutral / consolidation:
₹18,800–₹19,800 — range‑bound daily
⚡ Bearish below:
₹18,500 — first key support
₹17,550 — medium support line
₹15,400–₹15,500 — strong downside support zone

Choose the Strategy That Matches Your Market MindsetIntraday vs. Swing Trading:
In today’s fast-moving financial markets, traders are constantly searching for strategies that align with their goals, risk appetite, time availability, and psychological comfort. Among the most popular trading approaches, Intraday Trading and Swing Trading stand out as two powerful yet distinctly different styles. This ad explores both strategies in depth, helping traders—beginners and professionals alike—understand their core differences and decide which path best suits their trading journey.
Understanding Intraday Trading
Intraday trading, also known as day trading, involves buying and selling financial instruments within the same trading session. No positions are carried overnight. The objective is to capture small price movements using high volumes, precision timing, and strict discipline.
Key Characteristics of Intraday Trading
Trades are opened and closed on the same day
Focuses on short-term price fluctuations
Requires constant market monitoring
Heavily dependent on technical analysis
Leverages volatility and liquidity
Intraday traders thrive on speed. They react to news, global cues, volume spikes, and technical breakouts. This style is ideal for traders who can dedicate full market hours and make quick decisions under pressure.
Advantages of Intraday Trading
No overnight risk from global events
Faster capital rotation
Multiple trading opportunities in a single day
Immediate feedback on performance
Suitable for volatile market conditions
Challenges of Intraday Trading
Requires intense focus and screen time
Higher transaction costs due to frequent trades
Emotional pressure and stress
Lower margin for error
Demands strict risk management
Intraday trading rewards discipline and punishes impulsiveness. Success depends not on prediction, but on execution and consistency.
Understanding Swing Trading
Swing trading is a short- to medium-term strategy, where traders hold positions for several days to a few weeks. The aim is to capture a “swing” in price within a broader trend.
Key Characteristics of Swing Trading
Positions held overnight or longer
Focuses on trend continuation or reversal
Less screen time compared to intraday
Combines technical and fundamental analysis
Works well in trending markets
Swing traders rely on market structure, support-resistance zones, chart patterns, and macro or sector-based developments. This strategy is suitable for traders who cannot monitor markets continuously but still want active participation.
Advantages of Swing Trading
Reduced screen dependency
Lower transaction costs
More time for analysis and planning
Better risk–reward ratios
Ideal for part-time traders
Challenges of Swing Trading
Exposure to overnight and gap risk
Requires patience and emotional control
Slower capital turnover
Needs broader market understanding
Impact from global news and events
Swing trading emphasizes planning over speed and rewards traders who can stay calm during temporary price fluctuations.
Intraday vs. Swing Trading: The Core Differences
Aspect Intraday Trading Swing Trading
Time Horizon Same day Days to weeks
Capital Usage High turnover Moderate turnover
Risk Exposure No overnight risk Overnight & weekend risk
Screen Time Very high Moderate to low
Decision Speed Instant Calculated
Stress Level High Moderate
Suitable For Full-time traders Part-time traders
Both strategies can be profitable, but not for the same personality.
Which Strategy Is Right for You?
Choose Intraday Trading if you:
Can dedicate full market hours
Enjoy fast decision-making
Are comfortable with high pressure
Prefer quick results
Thrive in volatile environments
Choose Swing Trading if you:
Have limited daily time
Prefer structured planning
Can tolerate overnight risk
Aim for higher reward per trade
Want a balanced trading lifestyle
There is no “better” strategy—only the right fit.
Risk Management: The Common Foundation
Whether intraday or swing trading, risk management is non-negotiable. Both styles require:
Defined stop-loss levels
Pre-calculated position sizing
Risk–reward planning
Emotional discipline
Consistency over aggression
Professional traders focus less on how much they can make and more on how much they can protect.
The Smart Trader’s Perspective
Many successful market participants start with intraday trading to understand price behavior, then transition into swing trading for sustainability. Others blend both—using intraday setups within a broader swing view.
The real edge lies not in the strategy, but in:
Clear rules
Repeatable processes
Continuous learning
Adaptability to market conditions
Conclusion: Trade Smart, Not Fast
Intraday and swing trading are two sides of the same coin—one driven by speed and precision, the other by patience and structure. Understanding their differences empowers traders to align their strategy with their lifestyle, psychology, and financial goals.
Markets reward clarity. When you choose the strategy that fits who you are, not just what looks profitable, trading transforms from stress to skill.
Intraday or Swing—make your move with confidence, discipline, and a strategy built for you.

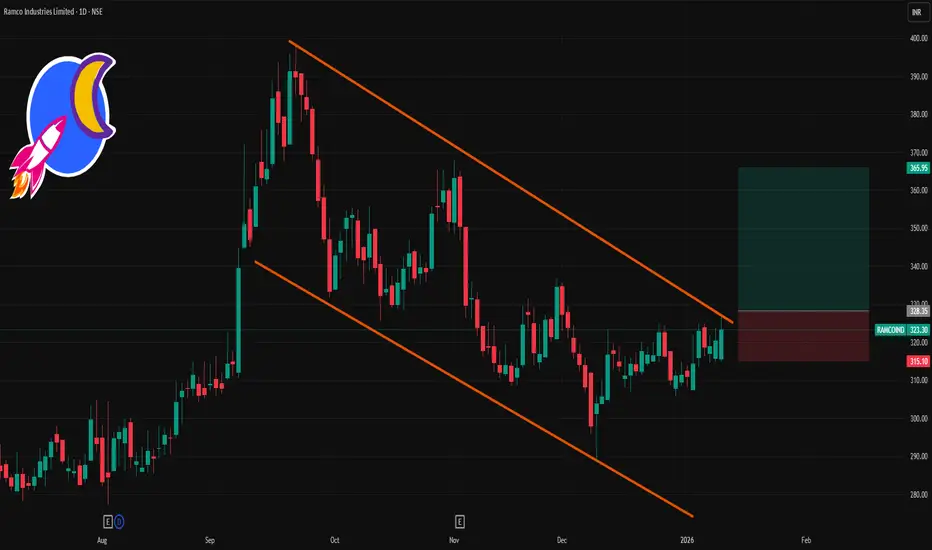
RAMCOIND 1 Day Time Frame 📈 Current Price (Approx Latest Close)
📌 Last Traded / Closing Price: ~₹323.30 on NSE (as of Jan 9, 2026)
📊 Daily Pivot & Support/Resistance Levels
Classic Pivot Levels (Daily)
These are useful for intraday and short‑term directional bias:
Level Price (Approx)
R3 ~₹336.23
R2 ~₹329.12
R1 ~₹321.78
Pivot ~₹314.67
S1 ~₹307.33
S2 ~₹300.22
S3 ~₹292.88
Interpretation:
Above Pivot (~314–315): bullish bias.
Above R1 (~321–322): stronger upside view.
Break above R2 (~329): could shift momentum higher intraday.
Below Pivot: more bears in control.
📌 Alternate Daily Pivot (Standard)
Another reliable pivot view from recent technical data:
Level Price
R3 ~₹324.02
R2 ~₹321.03
R1 ~₹316.62
Pivot ~₹313.63
S1 ~₹309.22
S2 ~₹306.23
S3 ~₹301.82
This set is slightly tighter but confirms similar zones near ₹310–₹322.
📌 How to Use These Levels Today
Bullish below/above strategy:
Bullish view: Price staying above Pivot (~₹314–315) and ideally R1 (~₹321–322) — targets R2 (~₹329) then R3 (~₹336).
Bearish risk: If price fails below Pivot (~₹314), next stops are S1 (~₹307) → S2 (~₹300).
🧾 Summary — 1D Levels Snapshot
Zone Level
Resistance 3 ~₹336
Resistance 2 ~₹329
Resistance 1 ~₹322
Pivot ~₹315
Support 1 ~₹307
Support 2 ~₹300
Support 3 ~₹293
Carbon Trading & ESG Investing: Smart, Profitable GrowthIn today’s rapidly evolving global economy, sustainability is no longer just a moral choice—it is a strategic and financial imperative. Carbon Trading and ESG (Environmental, Social, and Governance) Investing stand at the center of this transformation, reshaping how businesses operate, how investors allocate capital, and how economies prepare for a low-carbon future. This powerful combination allows investors and organizations to align profitability with responsibility, creating long-term value while addressing climate change and social impact.
The Rise of Carbon Trading: Pricing Carbon, Protecting the Planet
Carbon trading is a market-based mechanism designed to reduce greenhouse gas emissions by assigning a price to carbon. Governments and regulatory bodies set emission limits, and companies that reduce emissions below their allowed levels can sell surplus carbon credits to those that exceed their limits. This creates a financial incentive for innovation, efficiency, and cleaner technologies.
Carbon markets are expanding rapidly across the world. Compliance markets, such as cap-and-trade systems, are supported by governments, while voluntary carbon markets allow corporations and investors to offset emissions proactively. As climate regulations tighten, carbon credits are increasingly viewed not just as compliance tools but as valuable financial assets. Investors who understand carbon pricing dynamics can tap into a fast-growing market driven by global climate commitments, net-zero targets, and corporate sustainability goals.
ESG Investing: Beyond Profits, Toward Purpose
ESG investing evaluates companies based on three critical pillars:
Environmental impact (carbon footprint, energy efficiency, resource use)
Social responsibility (labor practices, community engagement, diversity)
Governance standards (board structure, transparency, ethical conduct)
Rather than focusing solely on short-term financial returns, ESG investing emphasizes long-term resilience and sustainable growth. Companies with strong ESG practices tend to manage risks better, adapt faster to regulatory changes, and maintain stronger brand trust. For investors, this translates into potentially lower volatility, improved risk-adjusted returns, and alignment with global sustainability trends.
Institutional investors, sovereign funds, and retail investors are increasingly integrating ESG criteria into their decision-making. ESG is no longer a niche concept—it is becoming a core framework for evaluating corporate performance and future potential.
The Powerful Intersection of Carbon Trading and ESG Investing
Carbon trading and ESG investing are deeply interconnected. Carbon emissions are a key environmental metric within ESG analysis, and participation in carbon markets reflects a company’s commitment to climate responsibility. Firms that actively reduce emissions or invest in carbon offsets often score higher on ESG ratings, making them more attractive to sustainability-focused investors.
For investors, carbon markets provide measurable, transparent data on emissions performance. This data enhances ESG analysis, allowing for more informed investment decisions. At the same time, ESG-focused capital flows increase demand for carbon-efficient companies and low-carbon technologies, reinforcing the value of carbon trading mechanisms.
Financial Opportunities in a Low-Carbon Economy
The transition to a low-carbon economy is unlocking vast financial opportunities. Carbon credits, renewable energy projects, clean technology, and sustainability-linked financial instruments are emerging as high-growth areas. Early adopters of carbon trading strategies and ESG portfolios can benefit from structural shifts in global capital allocation.
As governments introduce carbon taxes, stricter disclosure norms, and climate-related financial regulations, companies with weak ESG profiles may face higher costs and reduced access to capital. Conversely, ESG leaders and carbon-efficient businesses are better positioned to attract investment, secure funding, and achieve sustainable profitability.
Risk Management and Long-Term Stability
One of the strongest advantages of combining carbon trading with ESG investing is enhanced risk management. Climate risks, regulatory risks, reputational risks, and social risks can significantly impact financial performance. ESG frameworks help identify and mitigate these risks early.
Carbon pricing adds transparency to climate risk by quantifying emissions exposure. Investors who account for carbon costs are better prepared for policy changes, energy transitions, and market volatility. This proactive approach strengthens portfolio resilience and supports long-term wealth creation.
Corporate Transformation and Competitive Advantage
For businesses, engaging in carbon trading and improving ESG performance is not just about compliance—it is about competitiveness. Companies that invest in clean technologies, improve governance, and adopt responsible social practices often experience operational efficiencies, stronger stakeholder relationships, and enhanced market positioning.
ESG leadership attracts global investors, improves access to capital, and boosts brand credibility. Carbon trading revenues can be reinvested into innovation and sustainability initiatives, creating a virtuous cycle of growth and responsibility.
A Future Driven by Responsible Capital
The future of investing is being shaped by sustainability. Carbon trading and ESG investing are no longer optional trends; they are foundational elements of modern financial strategy. As climate challenges intensify and stakeholder expectations rise, capital will increasingly flow toward businesses and assets that demonstrate environmental stewardship, social responsibility, and strong governance.
For investors, this represents a unique opportunity to participate in global transformation while pursuing competitive returns. For organizations, it is a call to innovate, adapt, and lead.
Conclusion: Invest with Impact, Grow with Purpose
Carbon Trading and ESG Investing together create a powerful pathway where financial growth meets global responsibility. By integrating sustainability into investment strategies, investors can protect portfolios, unlock new opportunities, and contribute meaningfully to a greener, fairer world. This is not just about investing in markets—it is about investing in the future.

Unlock Stock Market GainsYour Strategic Path to Consistent, Smarter, and Sustainable Wealth Creation
Below is a detailed 1000-word advertisement description written clearly in points, designed to attract, educate, and convert investors and traders across experience levels.
1. Discover the Power of Strategic Stock Market Investing
Unlocking stock market gains is not about luck or speculation—it is about applying the right strategy, discipline, and market understanding. This approach empowers investors to make informed decisions based on data, trends, and market structure rather than emotions or rumors.
2. Built for Every Market Participant
Whether you are a beginner, retail investor, active trader, HNI, or institutional participant, this strategy adapts to your goals. It focuses on scalable techniques that work across different capital sizes, risk appetites, and market cycles.
3. Data-Driven Decision Making
Modern stock market gains are unlocked by analyzing price action, volume, technical indicators, and macroeconomic signals. This framework removes guesswork and replaces it with structured, rule-based execution.
4. Master the Art of Market Timing
Correct entry and exit timing plays a crucial role in maximizing profits. This strategy helps identify high-probability zones, trend reversals, breakout levels, and momentum phases to optimize trade timing.
5. Identify High-Growth Opportunities Early
Unlock stock market gains by spotting emerging sectors, strong stocks, and institutional accumulation early. Early identification allows investors to ride trends instead of chasing prices at the top.
6. Understand Market Cycles and Trends
Markets move in cycles—accumulation, expansion, distribution, and correction. Recognizing these phases helps investors stay aligned with the dominant trend and avoid unnecessary losses.
7. Smart Risk Management for Capital Protection
True gains come from protecting capital first. This approach emphasizes position sizing, stop-loss discipline, and risk-to-reward optimization to ensure long-term sustainability.
8. Emotion-Free Trading and Investing
Fear and greed are the biggest enemies of profitability. By following a structured system, investors can eliminate emotional decision-making and remain consistent during volatile market conditions.
9. Technical Analysis Made Practical
Learn to use support and resistance, trendlines, chart patterns, moving averages, RSI, MACD, and volume analysis in a simple, actionable way. These tools help decode market behavior with clarity.
10. Macro and News-Based Market Insights
Economic indicators, interest rates, inflation data, and global events influence market direction. This strategy integrates macro signals to stay ahead of major market moves.
11. Sector Rotation Advantage
Capital flows shift from one sector to another. Identifying sector rotation early allows investors to deploy capital into outperforming sectors and exit weakening ones efficiently.
12. Short-Term and Long-Term Gain Opportunities
Unlock stock market gains across multiple timeframes—intraday, swing, positional, and long-term investing—ensuring flexibility and diversified income opportunities.
13. Consistency Over One-Time Profits
This approach focuses on repeatable processes rather than one-time wins. The goal is consistent performance, steady portfolio growth, and compounding over time.
14. Institutional-Level Market Understanding
Gain insights into how smart money operates. Learn to track volume spikes, delivery data, and price behavior that reflects institutional participation.
15. Adaptability in All Market Conditions
Whether markets are bullish, bearish, or range-bound, this system provides tools and strategies to stay profitable or defensive when needed.
16. Portfolio Diversification for Stability
Unlock gains while minimizing risk by diversifying across sectors, market capitalizations, and asset classes. Balanced portfolios outperform over the long term.
17. Discipline-Driven Execution
Success in the stock market depends on discipline. This strategy enforces predefined rules, trade plans, and execution discipline to reduce errors.
18. Learn from Market Corrections
Corrections are opportunities, not threats. This approach teaches how to buy quality stocks at discounted valuations during market pullbacks.
19. Compounding: The Real Wealth Builder
Small, consistent gains compounded over time create extraordinary wealth. This strategy prioritizes sustainable returns rather than aggressive speculation.
20. Transparent and Logical Investment Framework
Every trade and investment is backed by logic, probability, and confirmation—making decision-making clear and transparent.
21. Avoid Common Investor Mistakes
This system helps investors avoid overtrading, chasing tips, holding losing positions too long, and exiting winners too early.
22. Confidence Through Knowledge
When you understand why you enter and exit a trade, confidence naturally increases. Knowledge-driven investing removes uncertainty and hesitation.
23. Goal-Oriented Wealth Creation
Whether your goal is income generation, capital appreciation, retirement planning, or financial independence, this strategy aligns market participation with personal financial goals.
24. Long-Term Financial Freedom Vision
Unlocking stock market gains is not just about profits—it’s about achieving financial independence, stability, and control over your financial future.
25. Start Your Journey to Smarter Market Gains
With the right guidance, tools, and mindset, the stock market becomes an opportunity engine rather than a risk zone. Unlock stock market gains by investing with clarity, discipline, and confidence.
Conclusion
Unlock Stock Market Gains is a complete, practical, and disciplined approach to navigating financial markets. It empowers investors to grow wealth steadily, manage risk effectively, and stay aligned with market realities. By focusing on strategy, psychology, and execution, this system transforms market participation into a structured path toward long-term success.

Smart Choice of Mutual Funds – Build Wealth with Confidence 1. Understanding the Power of Mutual Funds
Mutual funds pool money from multiple investors to invest in diversified assets such as equities, debt, or hybrid instruments.
They offer professional fund management, making them ideal for both beginners and experienced investors.
A smart choice of mutual funds helps reduce risk while aiming for consistent long-term returns.
Investors can start with small amounts through SIPs (Systematic Investment Plans), making wealth creation accessible to everyone.
2. Why Smart Selection Matters
Not all mutual funds perform the same across market cycles.
Choosing the right fund aligns your investments with financial goals, time horizon, and risk appetite.
A smart selection avoids impulsive decisions driven by market noise or short-term performance.
Proper fund selection enhances compounding benefits over the long run.
3. Define Your Financial Goals Clearly
Identify whether your goal is wealth creation, retirement planning, child education, or short-term liquidity.
Match goals with suitable fund categories such as equity for long-term growth or debt funds for stability.
Goal-based investing brings discipline and clarity to your investment journey.
Clear goals help measure performance meaningfully, not emotionally.
4. Assess Your Risk Appetite
Risk appetite varies from conservative to aggressive investors.
Equity funds suit high-risk, long-term investors, while debt funds suit low-risk investors.
Hybrid funds balance risk and return for moderate investors.
A smart mutual fund choice respects your comfort with volatility.
5. Choose the Right Mutual Fund Category
Equity Funds: Ideal for long-term wealth creation and inflation beating returns.
Debt Funds: Suitable for capital preservation and stable income.
Hybrid Funds: Combine equity and debt for balanced growth.
Index Funds: Low-cost funds tracking market indices for passive investors.
Selecting the right category is the foundation of smart investing.
6. Analyze Fund Performance Across Market Cycles
Look beyond short-term returns; evaluate 3-year, 5-year, and 10-year performance.
Consistency matters more than one-time high returns.
Compare fund performance with benchmarks and peer funds.
Smart investors focus on risk-adjusted returns rather than absolute numbers.
7. Understand the Fund Manager’s Expertise
Fund managers play a crucial role in investment decisions.
Experience, investment philosophy, and track record matter.
A stable fund management team ensures continuity in strategy.
Smart investors trust funds with proven leadership and disciplined processes.
8. Evaluate Expense Ratio and Costs
Expense ratio directly impacts net returns over time.
Lower costs lead to higher compounding benefits in the long run.
Index funds and direct plans usually have lower expense ratios.
Smart choices balance cost efficiency with quality fund management.
9. Importance of Asset Allocation
Asset allocation spreads investments across equity, debt, and other assets.
It reduces overall portfolio risk during market volatility.
Rebalancing ensures alignment with changing market conditions and goals.
Smart mutual fund investors follow asset allocation, not market emotions.
10. SIP – The Smart Way to Invest
SIPs encourage disciplined and regular investing.
They average out market volatility through rupee cost averaging.
SIPs remove the stress of timing the market.
Smart investors use SIPs to build wealth steadily over time.
11. Tax Efficiency of Mutual Funds
Equity mutual funds enjoy favorable long-term capital gains taxation.
ELSS funds offer tax benefits under Section 80C.
Debt funds provide indexation benefits for long-term investors.
Smart fund selection also considers post-tax returns, not just gross returns.
12. Avoid Common Investor Mistakes
Chasing past performance without understanding risks.
Frequent switching of funds due to market fluctuations.
Over-diversification leading to diluted returns.
Smart investors stay patient, informed, and disciplined.
13. Review and Monitor Regularly
Periodic review ensures funds are aligned with goals.
Monitor performance, but avoid overreacting to short-term volatility.
Replace underperforming funds only with valid reasons.
Smart investing is proactive, not reactive.
14. Role of Professional Guidance
Financial advisors help match funds with personal goals.
They provide unbiased advice during volatile market phases.
Professional guidance prevents emotional investment decisions.
Smart investors value expert insights for long-term success.
15. Long-Term Vision is the Key
Mutual funds reward patience and consistency.
Compounding works best when investments are left untouched for longer periods.
Market ups and downs are temporary; discipline is permanent.
A smart choice of mutual funds transforms small savings into significant wealth.
16. Conclusion – Invest Smart, Grow Strong
Smart mutual fund investing is about clarity, discipline, and informed decisions.
The right fund, aligned with goals and risk profile, ensures financial confidence.
With proper planning, mutual funds become powerful wealth-building tools.
Make a smart choice today and secure a financially stronger tomorrow.
Smart Choice of Mutual Funds – Because Intelligent Investing Builds Lasting Wealth.

Stock Market LearningA Complete Guide for Retail Investors, HNIs, FIIs, DIIs & Institutional Participants
The stock market is a dynamic ecosystem where different types of investors participate with distinct objectives, capital sizes, risk appetites, and strategies. For anyone serious about stock market learning—whether a beginner retail investor or an aspiring professional—understanding how Retail Investors, High Net-Worth Individuals (HNIs), Foreign Institutional Investors (FIIs), Domestic Institutional Investors (DIIs), and large Institutions operate is essential. This knowledge not only builds confidence but also helps investors align their decisions with market realities rather than emotions or rumors.
1. Understanding the Stock Market Learning Process
Stock market learning is not just about buying and selling shares. It involves:
Understanding market structure
Studying price action and volume
Learning fundamental and technical analysis
Observing institutional behavior
Managing risk, psychology, and discipline
Every participant leaves a footprint in the market. Learning to identify and interpret these footprints is what separates informed investors from speculative traders.
2. Retail Investors: The Foundation of the Market
Retail investors are individual participants who invest relatively smaller amounts. They form the largest group in terms of numbers and play a crucial role in market liquidity.
Key Characteristics:
Limited capital compared to institutions
Often influenced by news, social media, and tips
Usually focus on short- to medium-term gains
Increasingly active due to easy access via online platforms
Learning Focus for Retail Investors:
Basics of equity, derivatives, and mutual funds
Technical indicators like support, resistance, RSI, and moving averages
Fundamental analysis of company balance sheets, earnings, and growth potential
Risk management techniques such as stop-loss and position sizing
Retail investors must understand that markets are not always rational in the short term. Education helps them avoid panic selling, overtrading, and emotional decisions.
3. High Net-Worth Individuals (HNIs): Strategic Market Movers
HNIs bridge the gap between retail and institutional investors. They invest large sums and often have access to professional advisory services.
Key Characteristics:
Significant capital deployment
Ability to influence mid-cap and small-cap stocks
Longer investment horizon than retail investors
Use of structured products, PMS, and alternative investments
Learning Focus for HNIs:
Portfolio diversification across asset classes
Sector rotation strategies
Advanced derivatives and hedging techniques
Understanding liquidity risks in smaller stocks
HNIs focus more on capital preservation along with growth. Learning helps them reduce concentration risk and avoid becoming trapped in illiquid investments.
4. Foreign Institutional Investors (FIIs): Global Capital Drivers
FIIs are large overseas funds, hedge funds, pension funds, and asset managers investing in domestic markets. Their flows can significantly impact market trends.
Key Characteristics:
Massive capital inflows and outflows
Sensitive to global interest rates, currency movements, and geopolitics
Often drive large-cap index movements
Highly data-driven and research-oriented
Learning Focus for Tracking FIIs:
Understanding FII flow data and its impact on indices
Correlation between global markets and domestic equities
Role of currency exchange rates
Impact of global monetary policy
For retail and HNI investors, learning to track FII behavior provides valuable insights into broader market direction.
5. Domestic Institutional Investors (DIIs): Market Stabilizers
DIIs include mutual funds, insurance companies, pension funds, and domestic financial institutions. They often act as counterbalances to FIIs.
Key Characteristics:
Long-term investment outlook
Consistent inflows through SIPs and insurance premiums
Strong influence during market corrections
Preference for fundamentally strong companies
Learning Focus for Understanding DIIs:
Mutual fund portfolio disclosures
SIP flow trends
Sector allocation strategies
Long-term compounding principles
DIIs play a crucial role in stabilizing markets during periods of heavy FII selling, making them important players to monitor.
6. Institutional Investors: The Smart Money
Institutional investors include large asset management firms, hedge funds, sovereign wealth funds, and proprietary trading desks.
Key Characteristics:
Access to advanced analytics and research
Large block trades and algorithmic execution
Focus on risk-adjusted returns
Strong emphasis on compliance and governance
Learning Focus for Institutional-Level Thinking:
Market microstructure and liquidity
Volume profile and order flow analysis
Risk modeling and drawdown control
Macro-economic and sectoral analysis
Retail investors can significantly improve results by learning how institutions think, rather than trying to compete with them.
7. How Market Learning Helps Align with Big Players
One of the biggest mistakes retail participants make is trading against institutional trends. Stock market learning teaches:
How accumulation and distribution phases work
Why breakouts with volume matter
How institutions enter positions gradually
Why patience often outperforms aggressive trading
By aligning with institutional behavior, investors improve probability and consistency.
8. Importance of Risk Management Across All Categories
Regardless of investor type, risk management remains central:
Retail investors focus on capital protection
HNIs manage portfolio-level risk
FIIs hedge currency and macro risks
DIIs balance long-term commitments
Institutions use quantitative risk models
Learning proper risk management prevents catastrophic losses and ensures longevity in the market.
9. Psychology and Discipline: The Hidden Curriculum
Stock market learning is incomplete without mastering psychology:
Controlling fear during corrections
Avoiding greed during rallies
Sticking to predefined strategies
Accepting losses as part of the process
Professional investors survive because of discipline, not prediction.
10. Conclusion: Stock Market Learning as a Lifelong Journey
The stock market is a shared platform where retail investors, HNIs, FIIs, DIIs, and institutions interact daily. Each group brings unique strengths and influences price discovery in its own way. True stock market learning lies in understanding these roles, respecting market structure, and continuously upgrading knowledge.
For retail investors, learning builds confidence. For HNIs, it ensures strategic growth. For institutions, it maintains efficiency and discipline. Those who commit to continuous learning are the ones who not only survive but thrive across market cycles.

Sensex 1 Month Time Frame 📌 Current Index Level (Latest Close)
S&P BSE Sensex: ≈ 83,576 points (as of January 9, 2026 closing) — showing a recent downturn in the market.
📈 Recent Daily Range
Trading range on the latest session: roughly 83,402 – 84,406.
📊 1-Month Range (Approximate)
Using recent historical data from late December to early January:
Highest in last month (near Dec ’25): ~85,880 – 86,159.
Lowest in last month: ~83,400 – 83,600.
Current (most recent close): ~83,576.
📊 Summary — 1-Month Sentiment
Metric Approx. Level
Current Close ~83,576
1-Month High ~85,880 – 86,159
1-Month Low ~83,400
Monthly Change Slight downtrend over past month (from mid-85k to ~83.5k)
📌 Market Context
The index has been falling recently, with significant drops in early January, reflecting broader selling pressure.

BTCUSD 1H Trend Shift Highlights Key Support and Recovery ZoneBitcoin on the 1H timeframe shows a complete cycle of trend development and correction based on clean price action. The market initially respected a bullish structure, forming higher highs and higher lows along an ascending trendline. Strong buying pressure pushed price above previous resistance, confirming bullish continuation and a clear Break of Structure . This impulsive move created a Fair Value Gap in the 91,200–91,700 area, which acted as a demand zone and supported further upside.
As price approached the 94,000–94,500 region, bullish momentum weakened and selling pressure increased. A lower high formed, followed by a decisive break below the rising trendline, signaling a short-term trend reversal. Price then respected a descending trendline, confirming a bearish intraday structure with lower highs and lower lows.
Current price is reacting near the 90,000–89,800 zone, which acts as key support. This area also represents a potential demand zone where buyers may attempt a recovery. A sustained hold above this level can lead to a corrective rebound toward 91,200 and 92,000. Resistance remains at 92,800–93,200, followed by major resistance near 94,000.
Overall, the market is in a corrective bearish phase after a strong rally. Bullish continuation is possible only if support holds and structure shifts again. This analysis is educational and based solely on technical price behavior.

Part 3 Learn Institutional Trading Common Mistakes to Avoid
❌ Buying OTM options blindly
❌ Ignoring time decay
❌ Overtrading
❌ Selling options without hedges
❌ Trading against market trend
❌ Poor risk management
Option trading demands discipline and strategy.

Part 2 Ride The Big Moves How Beginners Should Start Option Trading
A. Start With Buying Options
Risk is limited to premium.
B. Practice with Paper Trading
Learn Greeks, price action, OI analysis.
C. Avoid Selling Naked Options
Very risky without proper experience and capital.
D. Stick to Liquid Instruments
Nifty, Bank Nifty, major stocks with high liquidity.
E. Trade With Proper Stop-Loss
Even though options fluctuate quickly, stop-loss is crucial.

Part 1 Ride The Big Moves A. ITM (In the Money)
Call: Market price > Strike price
Put: Market price < Strike price
ITM options have intrinsic value.
B. ATM (At the Money)
Strike price ≈ Market price
These options have the highest liquidity and highest time value.
C. OTM (Out of the Money)
Call: Market price < Strike price
Put: Market price > Strike price
OTM options have no intrinsic value, only time value.
OTM options are cheaper but riskier.

PCR Trading Strategies A. Premium
The price you pay to buy an option.
Premium depends on:
Underlying price
Strike price
Time to expiry
Volatility
Interest rates
Premium is the cost of buying the right (call or put).
B. Strike Price
The predetermined price at which you can buy (call) or sell (put) the asset.
Example:
Reliance is trading at ₹2700
You buy 2750 CE → strike = 2750
C. Expiry
Options lose value with time.
Weekly and monthly expiries are actively traded in Indian markets.
As expiry approaches, time value decays faster, affecting premium.

Part 2 Introduction to Candlestick PatternsA. Call Options
A call option gives you the right to buy an underlying asset at a predetermined price within a specified time.
You buy a call option when you expect:
➡ The price of the asset will go up.
Example:
Nifty is at 22,000.
You buy a 22,000 CE (Call European) at a premium of ₹100.
If Nifty rises to 22,400, your call becomes more valuable, and you profit.
B. Put Options
A put option gives you the right to sell an underlying asset at a predetermined price within a specified time.
You buy a put option when you expect:
➡ The price of the asset will go down.
Example:
Bank Nifty is at 47,000.
You buy a 47,000 PE (Put European) at ₹120.
If Bank Nifty falls to 46,500, the put becomes more valuable.

Part 1 Introduction to Candlestick PatternsWhat Are Options?
Options are financial contracts that give you the right, but not the obligation, to buy or sell an underlying asset (like a stock, index, commodity, or currency) at a specific price, called the strike price, before a fixed date known as expiry.
There are two types of options:
1. Call Options – Right to buy
2. Put Options – Right to sell
Options derive their value from the underlying asset; that’s why they are called derivatives.
Unlike stocks, options have a limited lifespan. They expire weekly, monthly, or quarterly depending on the market.

Best Knowledge of Chart Patterns CHART PATTERNS
Chart patterns are visual formations that appear on price charts. These patterns are formed when price creates recognizable shapes due to repeated market behavior. Chart patterns reveal market psychology, liquidity placement, stop-loss positions, and future direction of price.
1. Reversal Patterns
These patterns signal that the ongoing trend is likely coming to an end. A reversal pattern at the top of an uptrend signals bearish move; at the bottom of a downtrend, it signals bullish move.
Examples:
Head and Shoulders
Inverse Head and Shoulders
Double Top
Double Bottom
Rounding Top
Rounding Bottom
Falling Wedge
Rising Wedge
2. Continuation Patterns
These patterns show that the trend is taking a pause before continuing in the same direction.
Examples:
Bullish Flag
Bearish Flag
Bullish Pennant
Bearish Pennant
Ascending Triangle
Descending Triangle
Symmetrical Triangle
Cup and Handle
3. Bilateral Patterns
These patterns signal indecision — price can break either up or down.
Examples:
Symmetrical Triangle
Diamond Pattern

KRISHNADEF 1 Week Time Frame 📌 Current Price Snapshot (as of 9 Jan 2026)
NSE Live Price: ~₹937 – ₹947 area (closed ~₹947)
Day Range: ₹850 – ₹1,019
RSI: ~68 → near bullish strength but not extreme overbought yet
📊 1‑Week Timeframe Key Levels (Estimated Technicals)
🟢 Resistance (Upside Targets)
R1: ~₹1,000 – ₹1,020 zone — near recent intra‑week high and psychological round number
R2: ~₹1,030 – ₹1,040 — close to 52‑week high resistance area
R3: ~₹1,060 + — stretch target if momentum continues strong
🔵 Pivot / Decision Zone
Pivot: ~₹930 – ₹940 — central decision point this week
• Above this → near‑term bullish
• Below this → potential sideways/pullback action
🔴 Support (Downside Defense)
S1: ~₹880 – ₹900 — first meaningful support (near recent opening/low area)
S2: ~₹840 – ₹860 — secondary support zone
S3: ~₹800 – ₹820 — stronger support if deeper pullback occurs
⏱ How to Use These Levels This Week
Bullish bias
Keep price trading above ₹930 pivot
Targets: ₹1,000 → ₹1,020 → ₹1,040+
Pullback / Correction Alert
Break below ₹900 and then ₹880 may signal deeper retracement
Strong support for bounce: ₹840 → ₹800

BEL 1 Day Tie Frame 📍 Current Quote & Daily Price Range (approx)
Current Price: ~ ₹418.65 (latest close / last traded price)
Day’s Low / High: ~ ₹415.85 – ₹424.55
📊 Daily Pivot & Levels (Standard / Fibonacci)
(Calculated from most current data available)
🔥 Pivot Points (Fibonacci Basis):
Pivot (Central): ₹417.55
Resistance 1 (R1): ₹420.95
Resistance 2 (R2): ₹423.05
Resistance 3 (R3): ₹426.45
🛡️ Support Levels:
Support 1 (S1): ₹414.15
Support 2 (S2): ₹412.05
Support 3 (S3): ₹408.65
📌 Alternative Broker‑Derived Levels (Correlation)
These are close to the pivot model above and help confirm zones:
From another live technical feed:
Pivot: ~ ₹417.55
First Support: ₹412.15
First Resistance: ₹421.05
Second Support: ₹408.65
Second Resistance: ₹426.45
Third Support: ₹403.25
Third Resistance: ₹429.95
This confirms the support zone ~₹408–412 and resistance zone ~₹421–427+.
📈 How to Interpret (Today’s Daily Chart)
✔️ Bullish continuation if price holds above:
Pivot: ₹417.55
Support zone: ₹412–₹408
✔️ Upside breakout triggers stronger moves above:
R1 / R2: ₹420.95 → ₹423+
Above ₹426+ opens room toward fresh highs.
❌ Bearish risk if price drops below:
S1‑S2 zone: ₹414 → ₹412
Break below ₹408 — downside pressure toward lower supports.

BTC/USD 1 Month Time Frame 📊 Current Price Snapshot (Latest Available)
$90,478.00
📊 1‑Month Key Levels — BTC / USD
🛑 Resistance Levels (Upside)
These are areas where price has struggled to break above recently:
1. Major Resistance: ~$108,000–$112,000
• Multiple tests and sellers here — strong supply zone.
2. Intermediate Resistance: ~$100,000
• Psychological barrier and past pivot point.
💡 A successful break above these could signal bullish continuation and a shift in momentum.
🟩 Support Levels (Downside)
These are floors where price tends to stabilize or bounce:
1. Immediate Support: ~$84,000–$87,000
• Critical support zone on monthly chart — losing this could strengthen bearish momentum.
2. Secondary Support Zone: ~$80,000
• Structural support from past price action.
3. Lower Support: ~$75,000
• Major defense area if broader sell‑offs continue.
📉 If these support levels break decisively with volume, risk increases for deeper pullbacks.
📌 How to Use These Levels
🕐 1‑Month Time Frame Interpretation
Bullish bias if BTC holds above ~$90k–$100k, especially with higher highs.
Neutral / Range‑bound if price oscillates between ~$84k–$108k.
Bearish bias if BTC breaks below ~$84k with conviction (higher volume and clear close below).
These levels reflect recent technical structure and psychological zones, commonly used by traders to set entries, exits, and risk management.
