HINDCOPPER 1 Week Time Frame 📍 Current Price (Indicative)
The stock is trading around ₹400–₹430 levels recently — near 52‑week highs due to strong momentum.
📊 Weekly Timeframe Levels (1‑Week Outlook)
🔹 Key Weekly Resistances
1. Primary Resistance: ~₹415 – ₹422
— Immediate upside facing selling pressure.
2. Higher Resistance: ~₹428 – ₹432
— Near recent short‑term top and swing highs.
Bullish scenario: Sustained closes above ₹415 – ₹422 may prompt further gains toward ₹430+.
🔸 Key Weekly Supports
1. Immediate Support: ₹382 – ₹381
— Near recent pullback region / pivot area.
2. Intermediate Support: ₹375 – ₹376
— Short‑term demand zone if price cools off.
3. Stronger Support: ₹370 – ₹371
— Important weekly base — breakdown below this may weaken trend.
📌 1‑Week Scenarios to Watch
🟢 Bullish
Close above ~₹415–₹422 → Next upside target ~₹428–₹432+
🔄 Range / Consolidation
Range ~₹382–₹415 → Price may chop sideways before a definitive break
🔴 Bearish
Weekly close below ~₹375–₹370 → Risk of deeper pullback toward ₹360–₹350
Harmonic Patterns

360ONE 1 Day Time Frame 📊 Daily Price Range
Typical intraday range: ~₹1,124–₹1,150 (varies per session) — recent daily highs/lows seen in this band.
📈 Important Daily Support Levels
Support 1: ~₹1,134–₹1,135 — near recent intraday lows.
Support 2: ~₹1,102 — secondary downside support.
Support 3: ~₹1,084 — deeper support level if broader sell‑off unfolds.
👉 These are key levels where the stock has found buying interest on the daily chart. Breach below them may indicate more downside pressure.
📉 Important Daily Resistance Levels
Resistance 1: ~₹1,184 — immediate upside barrier.
Resistance 2: ~₹1,202 — next layer of sellers.
Resistance 3: ~₹1,234 — stronger upside pivot.
👉 These are areas where the stock may struggle to move higher on the daily timeframe.
🔧 Technical Bias on Daily Timeframe
Daily indicators (RSI, MACD, moving averages) are currently showing buy/strong‑buy signals, meaning short‑term trend is tilted bullish.
📌 Daily Pivot Reference (Approximate)
Pivot ~₹1,152–₹1,155 — central daily pivot based on recent session price action.

MANAPPURAM 1 Day Time Frame 📌 Live Reference Price (approx)
• Current trading price on NSE is around ₹292–₹295 (varies slightly by data source and market timing).
📊 Daily Pivot & Intra‑Day Levels (1‑Day Time Frame)
Daily Pivot Zone (key zone for daily bias):
• Pivot Point: ~₹284–₹287 (central pivot zone where buyers/sellers balance)
🔼 Resistance Levels
• R1: ~₹289–₹290 (first resistance — break above signals strength)
• R2: ~₹292–₹293 (secondary resistance — near current price zone)
• R3: ~₹296–₹298 (major resistance from higher pivot calculations)
🔽 Support Levels
• S1: ~₹281–₹283 (first support — good short‑term buy zone)
• S2: ~₹276–₹278 (deeper support if S1 breaks)
• S3: ~₹273–₹275 (strong buffer support)
📈 Interpretation for Intraday / Daily Trading
Bullish scenario
Above pivot (~₹285–₹287) → positive bias today.
Above R1 (~₹289–₹290) → look for moves toward R2 & R3 (~₹293–₹298).
Bearish scenario
Below pivot (~₹284–₹287) → weakness coming in.
Break below S1 (~₹281) → next stop S2 (~₹276–₹278).
📍 Quick Intraday Ranges (Observed Today)
• Intraday high range today ~₹292–₹294 and low near ₹281–₹284 in recent sessions.

DIXONDIXON
Bullish trend is Showing on the chart.
Buy signals in technical indicators and chart pattern.
1) Falling Wedge Chart Pattern.
1) Bullish BAT Harmonic Chart Pattern.
BUYING RANGE 13200/13250
Watch for a breakout above 13200/13250 to sustain the bullish trend. If the resistance holds, there could be a retest towards 12700/12800 and an uptrend from here.

ASIANTILES 1 Day Time Frame 📊 Current Price Context
Asian Granito India is trading around ₹72–73 on the NSE in today’s session.
📈 1‑Day Key Levels (based on recent pivot/technical data)
🔹 Pivot Point (daily reference): ~ ₹73 (central level)
📌 Resistance Levels:
R1: ~ ₹75 – Immediate upside hurdle (recent 52‑week high area)
R2: ~ ₹77 – Secondary resistance if price breaks above R1
R3: ~ ₹79 – Extended resistance zone
📉 Support Levels:
S1: ~ ₹72 – Nearest support below the pivot
S2: ~ ₹70 – Short‑term support zone
S3: ~ ₹68 – Deeper support if market weakens
🛠️ How to Use These Levels
Bullish entry: Above the daily pivot (~₹73) with volume confirmation.
Stop loss: Below ₹70–₹68 if long.
Profit targets: ₹75 → ₹77 → ₹79 on sustained upside.

Candle Patterns Candlestick charts represent price movement in a visually intuitive way. Each candle shows:
Open
High
Low
Close
The color (green or red) indicates bullish or bearish sentiment. Patterns form when candles combine to express a strong market bias.
Why Candle Patterns Matter
They show real-time market sentiment
Provide early entry signals
Indicate trend continuation or reversal
Help identify trap candles and false breakouts
Crucial for Volume Profile & Market Structure traders to read participant behaviour
Candlestick patterns are classified into:
A. Bullish Reversal Patterns
B. Bearish Reversal Patterns
C. Continuation Patterns
D. Indecision / Neutral Patterns

NMDC 1 Week Time Frame 📊 Current Price Context
NMDC is trading around ₹81–₹82 on NSE currently.
📉 Weekly Support Levels
1. Primary Support: ~₹79–₹77 zone
Weekly pivot region and short‑term support clustered here.
2. Next Support: ~₹76–₹74 region
A key technical support band on weekly charts and potential “re‑entry” level if near‑term support breaks.
3. Lower Support Floor: ~₹69–₹68 (longer weekly support)
If the ₹74 region fails decisively, the next significant weekly demand zone is here.
📈 Weekly Resistance Levels
1. Immediate Resistance: ~₹82–₹83
Near the current trading range high and recent pivot resistance.
2. Higher Resistance: ~₹84–₹86
Represents a zone where weekly price has previously stalled.
3. Major Breakout Level: Above ₹88‑₹90
Crossing and closing above this weekly zone can signal stronger bullish continuation.
📌 Trading Tip:
Bullish view: Weekly close above ₹82–₹83 strengthens upside potential.
Bearish risk: Weekly break below ₹76–₹74 weakens structure and could target lower supports.

KAYNES 1 Week Time Frame 📌 Current Price Snapshot (Latest Available)
NSE price around ₹4,140–₹4,185 recently.
📊 Key Levels (1‑Week Short‑Term)
Pivot (Weekly Reference)
Pivot Point: ~₹4,184–₹4,186
Resistance (Upside Targets)
R1: ~₹4,243–₹4,252
R2: ~₹4,299–₹4,320
R3: ~₹4,440–₹4,450
Support (Downside Floors)
S1: ~₹4,128–₹4,130
S2: ~₹4,070–₹4,064
S3: ~₹4,014–₹3,876
Quick Note: These are pivot‑based intraday/weekly support‑resistance estimates used by traders to gauge short‑term boundaries.
📈 1‑Week Trading Guide (Contextual)
Bullish if:
Price decisively closes above ₹4,250–₹4,300 with buying volume → next objective is near ₹4,440.
Bearish if:
Price breaks and sustains below ₹4,070–₹4,014 → deeper support near ₹3,876 zone.
Sideways/Choppy if:
Price holds between ₹4,070 ↔ ₹4,250 — suggests range trading this week.

Chart Patterns CHART PATTERNS
Chart patterns represent big-picture market structures formed over dozens or hundreds of candles. They reveal accumulation, distribution, reversal, and continuation phases.
Patterns are grouped into:
A. Reversal Chart Patterns
B. Continuation Chart Patterns
C. Bilateral / Indecisive Patterns
Chart Patterns
Larger structures for strong trades
Indicate trend continuation or reversal
Higher reliability when combined with candles
Help set clear targets & stop-loss levels

Swing Trading in India: Profiting from Medium-Term Market MovesSwing trading has emerged as one of the most popular trading styles in India, especially among retail traders who want to participate actively in the stock market without the intense pressure of intraday trading. Positioned between day trading and long-term investing, swing trading focuses on capturing price movements that unfold over several days to a few weeks. In the Indian context—where markets are influenced by global cues, domestic economic data, corporate earnings, and policy decisions—swing trading offers a balanced and flexible approach to wealth creation.
Understanding Swing Trading
Swing trading is a strategy that aims to profit from short- to medium-term price “swings” within a broader trend. Instead of holding positions for years like investors, or closing all positions within the same day like intraday traders, swing traders typically hold trades for anywhere from two or three days to several weeks. The core idea is simple: identify a trend, enter at a favorable point during a pullback or breakout, and exit when the expected price move is achieved.
In India, swing trading is widely used in equities, index derivatives (NIFTY and BANK NIFTY), stock futures, commodities, and even currency markets. The strategy is particularly attractive because it does not require constant screen monitoring throughout the trading day.
Why Swing Trading Works Well in India
Indian markets are structurally well-suited for swing trading due to their strong trend characteristics. Stocks often move in sustained directional phases driven by earnings cycles, government policies, sectoral rotation, and foreign institutional investor (FII) flows. Events such as RBI policy announcements, Union Budget, global interest rate decisions, and geopolitical developments frequently create multi-day price movements—ideal conditions for swing traders.
Additionally, India’s growing participation of retail traders, increased liquidity in large-cap and mid-cap stocks, and the availability of derivatives provide ample opportunities to express swing trading views with leverage or hedging.
Instruments Used for Swing Trading
Most swing traders in India focus on:
Equity Cash Segment: Popular among beginners due to lower risk compared to derivatives. Delivery-based swing trading avoids time decay and margin pressure.
Stock Futures: Suitable for experienced traders who want leverage, but they come with higher risk and margin requirements.
Index Futures and Options: NIFTY and BANK NIFTY are highly liquid and responsive to macro cues, making them ideal for swing setups.
Commodities and Currencies: Gold, crude oil, USD/INR, and other instruments offer strong trending opportunities aligned with global markets.
Role of Technical Analysis
Technical analysis forms the backbone of swing trading. Indian swing traders rely heavily on charts, indicators, and price action to identify high-probability setups. Commonly used tools include:
Trend Indicators: Moving averages (20, 50, 100 EMA/SMA) to identify trend direction.
Momentum Indicators: RSI, MACD, and Stochastic to assess strength and potential reversals.
Support and Resistance: Key price levels derived from previous highs, lows, and consolidation zones.
Chart Patterns: Flags, triangles, head and shoulders, and double tops/bottoms.
The goal is not to predict the market, but to react to price behavior and align trades with the prevailing trend.
Fundamental Triggers and News Flow
While swing trading is largely technical, fundamentals still play an important supporting role in India. Earnings announcements, management commentary, sectoral news, and macroeconomic data often act as catalysts for swing moves. For example, strong quarterly results can trigger a multi-week rally in a stock, while regulatory changes can cause sustained declines.
Smart swing traders track corporate calendars, economic events, and policy announcements to avoid unnecessary risk or to position themselves ahead of potential breakouts.
Risk Management: The Core of Success
Risk management is what separates successful swing traders from consistent losers. Indian markets can be volatile, especially during global uncertainty or unexpected news. Effective swing traders strictly define their risk before entering any trade.
Key principles include:
Stop-Loss Discipline: Every trade must have a predefined stop-loss to limit downside.
Position Sizing: Risking only a small percentage of total capital on each trade (often 1–2%).
Risk–Reward Ratio: Ensuring potential reward is at least two to three times the risk taken.
Avoid Overtrading: Focusing only on high-quality setups rather than trading every market move.
Psychology and Patience
Swing trading demands emotional control and patience. Trades may take days to play out, and short-term fluctuations can test a trader’s confidence. In India, where social media tips and market noise are abundant, the ability to stick to a well-defined plan is critical.
Fear of missing out (FOMO), revenge trading after losses, and premature profit booking are common psychological pitfalls. Successful swing traders cultivate discipline, maintain trading journals, and continuously review their performance.
Swing Trading vs Intraday Trading in India
Compared to intraday trading, swing trading is less stressful and more forgiving. Intraday traders must deal with noise, high transaction costs, and constant monitoring, whereas swing traders can plan trades calmly using end-of-day charts. Brokerage costs are also lower relative to potential profits, especially in delivery-based swing trades.
However, swing trading involves overnight risk—news released outside market hours can lead to gap-ups or gap-downs. This makes proper position sizing and diversification essential.
Regulatory and Practical Considerations
In India, swing traders must also be aware of SEBI regulations, margin rules, and taxation. Delivery-based equity trades enjoy favorable tax treatment compared to frequent intraday or derivative trading. Understanding settlement cycles, margin obligations, and corporate actions is crucial to avoid operational surprises.
Conclusion
Swing trading in India is a powerful strategy for traders who want consistent opportunities without the intensity of full-time day trading. By combining technical analysis, awareness of fundamentals, disciplined risk management, and strong trading psychology, swing traders can capitalize on the natural rhythm of Indian markets. While it is not a shortcut to quick riches, swing trading—when practiced with patience and structure—offers a sustainable path to long-term trading success in India’s dynamic financial landscape.

Physiology-Driven Trading SuccessHow Your Body Shapes Profitable Decisions
Trading success is often discussed in terms of strategy, charts, indicators, and market knowledge. While these elements are important, they represent only one side of the equation. The other, often ignored side, is physiology—the way your body, nervous system, hormones, and energy levels influence your decisions. In reality, markets do not just test your analytical skills; they test your biology. Understanding and mastering your physiology can be a decisive edge that separates consistent traders from those who struggle despite strong technical or fundamental knowledge.
The Mind–Body Connection in Trading
Trading is a high-pressure performance activity, similar to professional sports or competitive chess. Every trading decision is processed through the brain, which is directly influenced by physiological signals such as heart rate, blood sugar levels, sleep quality, hydration, and stress hormones. When your body is calm and balanced, your brain operates in a rational, disciplined state. When your body is stressed or fatigued, your brain shifts into survival mode, leading to impulsive and emotional decisions.
This explains why traders often break rules during volatile markets or after a string of losses. It is not always a lack of discipline—it is the body reacting to perceived threat.
Stress Hormones and Market Decisions
Two hormones play a major role in trading behavior: cortisol and adrenaline. When markets move sharply or positions go against you, cortisol levels rise. Cortisol is useful in short bursts, as it sharpens focus and reaction speed. However, prolonged exposure impairs memory, reduces logical thinking, and increases fear-based behavior.
Adrenaline, on the other hand, fuels excitement and risk-taking. During winning streaks, adrenaline can create overconfidence, leading traders to increase position sizes irrationally. This is why many traders give back profits after a strong run—physiology pushes them to seek the emotional high rather than follow the plan.
Successful traders learn to recognize these physiological states and regulate them before placing the next trade.
Heart Rate Variability and Emotional Control
Heart rate variability (HRV) is a powerful indicator of how well your nervous system adapts to stress. High HRV reflects calm focus and emotional flexibility, while low HRV signals fatigue, anxiety, or over-arousal. Traders with higher HRV tend to recover faster from losses and avoid emotional spirals.
Simple breathing techniques—such as slow nasal breathing or box breathing—can rapidly improve HRV. Just a few minutes before market open can shift the nervous system from reactive to responsive, improving decision quality significantly.
Sleep: The Hidden Trading Indicator
Sleep deprivation is one of the most underestimated causes of trading failure. Lack of sleep impairs risk assessment, increases impulsivity, and weakens memory recall. A sleep-deprived trader may technically “know” their strategy but fail to execute it consistently.
Quality sleep restores prefrontal cortex function, which is responsible for planning, discipline, and logical thinking. Traders who prioritize sleep often report fewer revenge trades, better patience, and improved ability to sit through drawdowns without panic.
In many cases, improving sleep can deliver better results than changing indicators or timeframes.
Nutrition and Energy Stability
Blood sugar fluctuations directly affect emotional stability. Skipping meals or relying on high-sugar foods can lead to sudden energy crashes, irritability, and poor concentration. During these states, traders are more likely to overtrade or exit positions prematurely.
A physiology-driven trader focuses on steady energy—balanced meals, adequate protein, hydration, and minimal stimulants during trading hours. The goal is not peak excitement but sustained clarity.
The Nervous System and Risk Tolerance
Each trader has a unique nervous system sensitivity. Some can tolerate large drawdowns without emotional disturbance, while others feel intense stress even on small losses. This is not a weakness—it is a biological reality.
Successful traders design position sizing and strategies that align with their nervous system capacity. A strategy that looks profitable on paper but overwhelms your physiology will fail in real execution. Trading success improves dramatically when risk is adjusted not just to capital, but to emotional and physiological tolerance.
Recovery and Reset Between Trades
Professional traders understand the importance of recovery. After a loss or a volatile session, the nervous system needs time to reset. Jumping immediately into another trade while emotionally charged often leads to compounding mistakes.
Short breaks, movement, stretching, or even stepping away from screens can reset physiology. This allows the trader to return to the market with objectivity rather than emotional residue.
Physiology Over Willpower
Many traders rely on willpower to control emotions. However, willpower is limited and easily depleted under stress. Physiology-driven trading focuses on creating conditions where discipline becomes natural rather than forced.
When your body is calm, rested, and regulated, following rules feels effortless. When your body is stressed, no amount of motivation can maintain consistency for long.
Building a Physiology-Driven Trading Routine
Successful traders build daily routines that support their nervous system. This may include morning breathing exercises, light physical activity, structured breaks, hydration schedules, and strict sleep routines. These practices are not optional extras—they are performance tools.
Over time, this approach creates emotional resilience. Losses are processed quickly, wins do not create overconfidence, and decision-making remains stable across different market conditions.
Conclusion
Physiology-driven trading success is about recognizing that every trade is filtered through your body. Charts do not make mistakes—humans do, often because their physiology is out of balance. By managing stress, sleep, nutrition, breathing, and recovery, traders can dramatically improve consistency and performance.
In the long run, the market rewards not just the smartest traders, but the most regulated ones. When your body is aligned, your mind follows—and profitable decisions become a natural outcome rather than a constant struggle.

INR vs USD / EUR / JPY: Dynamics of the Indian Trading MarketImportance of INR in the Indian Trading Market
India is a rapidly growing economy with strong links to global trade, energy imports, capital flows, and services exports. The INR is a partially convertible currency, meaning it is closely monitored and managed by the Reserve Bank of India (RBI). Unlike fully free-floating currencies, INR movements are influenced not just by market forces but also by central bank intervention. For Indian traders, movements in INR against USD, EUR, and JPY directly impact import costs, export competitiveness, inflation, interest rates, and stock market sentiment.
USD/INR: The Most Influential Currency Pair
Among all currency pairs, USD/INR dominates the Indian forex landscape. The US Dollar is the world’s primary reserve currency, and most of India’s trade—especially crude oil imports, technology services exports, and foreign institutional investments—is denominated in USD.
When USD strengthens against INR, imports become costlier, particularly crude oil, which increases India’s trade deficit and fuels inflation. On the other hand, exporters such as IT services, pharmaceuticals, and textiles benefit from a weaker rupee as their dollar-denominated revenues translate into higher rupee earnings.
From a trading perspective, USD/INR is relatively stable compared to emerging market currencies, largely due to RBI intervention. However, it still responds sharply to global factors such as US Federal Reserve interest rate decisions, inflation data, bond yields, geopolitical tensions, and risk-on/risk-off sentiment. Domestic factors like India’s current account deficit, GDP growth, foreign exchange reserves, and capital inflows also play a decisive role.
EUR/INR: Reflecting Europe–India Trade Relations
The EUR/INR pair represents the relationship between the Indian economy and the Eurozone. Europe is one of India’s largest trading partners, particularly in sectors like engineering goods, chemicals, automobiles, and luxury products. Movements in EUR/INR are influenced by both USD/INR dynamics and EUR/USD trends.
If the euro strengthens globally due to improving European economic data or tighter European Central Bank (ECB) policy, EUR/INR tends to rise even if INR remains stable against the dollar. Conversely, economic slowdowns in Europe, debt concerns, or dovish ECB policies can weaken the euro, impacting EUR/INR.
For Indian traders, EUR/INR is often more volatile than USD/INR due to layered influences from two major economies. Exporters to Europe and companies with euro-denominated receivables actively hedge this pair. From a speculative trading standpoint, EUR/INR offers wider ranges and better opportunities but carries higher risk due to sudden global macro shifts.
JPY/INR: The Safe-Haven Influence
The Japanese Yen holds a unique position in global finance as a traditional safe-haven currency. The JPY/INR pair is influenced less by direct trade volumes and more by global risk sentiment, interest rate differentials, and Japan’s ultra-loose monetary policy.
Japan is a major investor in India, particularly in infrastructure, automobiles, and manufacturing. When global markets face uncertainty—such as financial crises, geopolitical conflicts, or sharp equity corrections—the yen tends to strengthen as investors seek safety. This causes JPY/INR to rise even if INR fundamentals remain unchanged.
However, Japan’s long-standing low-interest-rate environment often weakens the yen during risk-on phases, making JPY/INR less volatile compared to EUR/INR but more sentiment-driven than USD/INR. For Indian traders, JPY/INR is often used as a diversification tool rather than a primary trading pair.
Role of RBI in Currency Management
A defining feature of the Indian trading market is the active role played by the RBI. The central bank intervenes in forex markets to reduce excessive volatility rather than targeting specific exchange rate levels. By using its vast foreign exchange reserves, the RBI smoothens sharp moves in USD/INR, indirectly influencing EUR/INR and JPY/INR as well.
Interest rate policy, liquidity management, and forward market operations are tools frequently employed by the RBI. For traders, this means INR pairs may not trend as aggressively as fully free-floating currencies, but they also offer relatively predictable behavior during stable macro conditions.
Impact on Stock Markets and Commodities
Currency movements significantly affect Indian equity markets. A weakening INR often benefits export-oriented sectors such as IT and pharmaceuticals, while hurting import-dependent industries like aviation and oil marketing companies. Conversely, a strengthening INR attracts foreign portfolio investments, supporting equity indices like NIFTY and SENSEX.
Commodities, especially crude oil and gold, are closely tied to USD/INR. Rising USD/INR typically leads to higher domestic commodity prices, impacting inflation and consumer demand. This interconnection makes currency analysis essential for traders across asset classes.
Trading and Hedging Opportunities in India
In India, currency trading is primarily conducted through exchange-traded currency derivatives on NSE, BSE, and MCX-SX, as well as through the interbank forex market. Retail traders mainly focus on USD/INR, EUR/INR, and JPY/INR futures and options.
Corporates use these instruments for hedging foreign exchange exposure, while traders use technical analysis, macroeconomic data, and global cues for speculation. Due to regulated trading hours and margin requirements, Indian currency markets are relatively disciplined compared to offshore forex markets.
Conclusion
The INR’s relationship with USD, EUR, and JPY forms the backbone of India’s interaction with the global financial system. USD/INR reflects capital flows and macro stability, EUR/INR captures Europe-related trade dynamics, and JPY/INR mirrors global risk sentiment. Together, these pairs provide deep insight into India’s economic health, policy direction, and global integration.
For Indian traders and investors, understanding these currency pairs is not just about forex profits—it is about anticipating broader market trends, managing risk, and aligning strategies with both domestic fundamentals and global developments. In an increasingly interconnected world, INR vs USD/EUR/JPY remains a critical lens through which the Indian trading market can be analyzed and navigated effectively.

Xagusd SilverXagusd chart Analysis .........24/12/2025
The XAGUSD XABCD harmonic target is at the 73.4 level. You can book your profits here, and if a reversal candle forms, you can also consider taking a short position with a stop-loss above the high of that candle.
ENJOY !
Note: This is my analysis for educational purposes only. If you incur any profit or loss, you are solely responsible for it.

ASTER Seeing early signs of a bullish reversal - ASTER is compressing into a make or break zone after a steep selloff and this is where reversals usually start forming.If this wedge resolves upward, the next leg could quickly reclaim major levels.
1. Pattern Overview
We’re trading inside a falling wedge (tightening lower highs + lower lows).
That structure often signals seller exhaustion: bears keep pushing, but each push gets weaker as liquidity dries up. When price breaks the wedge, it’s usually because buyers finally absorb the remaining supply, triggering a squeeze back into prior resistance.
2. Key Levels
Support
- 0.6800 (current pivot) — price is trying to base here; holding this keeps the “reversal attempt” alive
- 0.6540 (invalidation / sweep zone) — lose this and the market is telling you demand failed at the lows
Resistance
- 0.7269 (first decision level) — this is the near-term ceiling; a close above shifts momentum bullish
- 1.0014 (major reclaim level) — prior structure level; if reclaimed, it often flips into support and accelerates continuation
3. Market Outlook
Bias leans cautiously bullish while price holds above 0.6540 and keeps compressing inside the wedge.
Momentum shifts cleanly bullish on a daily close above 0.7269 + successful retest. That’s typically where institutions get involved not on the first spike, but on the confirmation + pullback, when risk is defined.
4. Trade Scenarios
🟢 Bullish Scenario
Entry trigger: Daily close above 0.7269 (or wedge breakout) + retest holding
First target: 1.0014
Second target: 1.3985
Why: Breakout from compression often leads to a fast move back into prior supply zones as shorts unwind and buyers step in.
🔻 Bearish Scenario
Breakdown trigger: Daily close below 0.6540
Target: 0.55 → 0.50 demand zone
Why: Losing the sweep/invalidation level usually means the “base” failed and liquidity below gets targeted next.
- Final Note
Don’t chase the first breakout candle wait for the daily close + retest to keep risk tight.
If you want more clean, level-based breakdowns like this, follow me for daily chart setups.

ADA longBullish shark pattern. Should see a bounce towards the 0.382-0.5-0.618 if price turns to the upside.

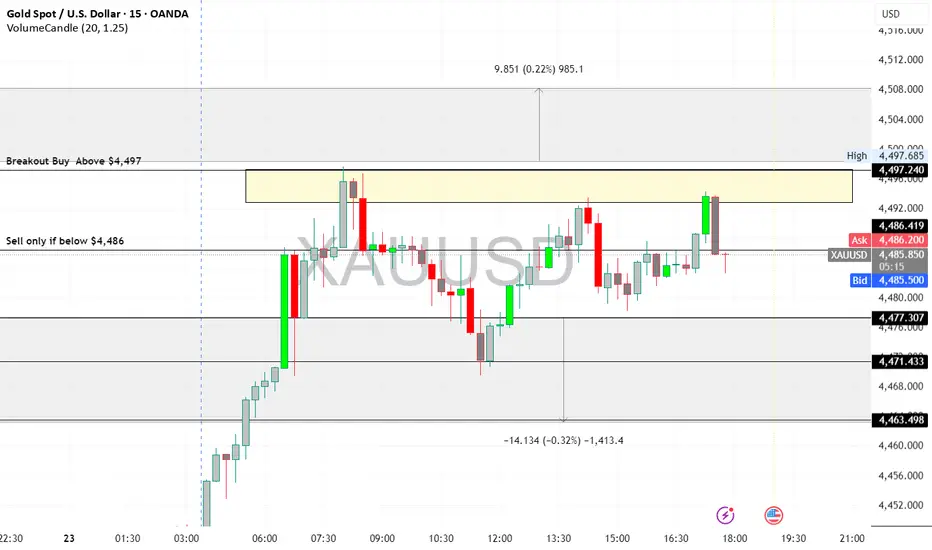
XAUUSD (Gold) Intraday Outlook - 23/12/2025XAU/USD Trend: Strong Bullish
Current Price: $4,491.99
Key Levels:
Support: $4,486 / $4,479
Resistance: $4,497 / $4,501 / $4,508
Pivot: $4,490
Strategy:
Buy on dips: $4,486–$4,479 → Target $4,497–$4,501
Breakout buy: Above $4,497 → Target $4,501–$4,508
Sell only if below $4,486
Gold remains bullish; prefer buying on dips or breakouts, keep stops tight near support.
Disclaimer: Trading involves risk. This analysis is for educational purposes only and is not financial advice. Trade responsibly.
$VELO IS ONE OF THE MOST MISPRICED TOKENS IN CRYPTONASDAQ:VELO IS ONE OF THE MOST MISPRICED TOKENS IN CRYPTO
$120M mcap.
BlackRock-backed stablecoin.
1M+ real users.
Backed by CP Group (7-Eleven Thailand) + Stellar.
Down 99.7% from ATH while building real PayFi rails in SE Asia’s $396B Cross-Border Market.
IEO: $0.05 → ATH: $2.07 (40x)
Now at $0.0067 🤯
High inflation? Yes.
High risk? Absolutely.
If RWA + PayFi runs and a Binance Main Listing Lands… This Won’t Stay at $120M.
⚠️ Disclaimer: Not financial advice. Do your own research. Crypto is volatile & You Can Lose Everything.

KFIN Technologies: Consolidation Breakout SetupKFIN Technologies is forming a constructive base after a strong prior move, with price compressing between well-defined demand and supply zones. The structure suggests accumulation, with momentum likely to expand once the range resolves.
The 1020–1030 zone continues to act as a strong demand area, repeatedly absorbing selling pressure and preventing deeper pullbacks.
The 1109–1110 zone is the key supply barrier where earlier rallies stalled due to profit booking and liquidity absorption.
The recent pullbacks should be read as consolidation, not trend weakness, since price has respected the demand base.
BUY TRADE
Buy Above: 1110
Stop Loss: 1022
Target 1: 1215
Target 2: 1380
Positional Target: 1630
Logic: Breakout above supply confirms end of consolidation and trend continuation.
SELL / EXIT TRADE
Sell Below: 1022
Stop Loss: 1110
Downside Target: 950
Extended Support: 780
Logic: Breakdown below demand invalidates bullish structure and leads to deeper consolidation.
As long as price stays between these two levels, the stock remains in a range-building phase. A decisive move outside this band will define the next directional trend.
Disclaimer: aliceblueonline.com

Part 2 Intraday Trading Master ClassKey Terminologies Before Trading Options
Premium
Price paid to buy an option.
Strike Price
The predetermined price at which the option can be exercised.
Expiry
The date on which the option contract becomes invalid.
In India, options expire weekly (indices) or monthly (stocks).
Lot Size
Options are traded in fixed quantities (e.g., Nifty lot = 50 units).
In the Money (ITM)
When the option has intrinsic value.
Call ITM → Market price > Strike price
Put ITM → Market price < Strike price
Out of the Money (OTM)
When the option has no intrinsic value.
At the Money (ATM)
When market price ≈ strike price.

Part 1 Intraday Trading Master Class Why Trade Options?
Options are used for:
1. Speculation
Traders speculate on price movement with small capital.
2. Hedging
Investors use options to protect their portfolio from losses.
3. Income Generation
Selling options regularly can provide consistent premium income.
4. Risk Management
Options allow defined-risk strategies where the maximum loss is known in advance.

Divergence Secrets What Are Options?
Options are financial contracts that give the buyer the right, but not the obligation, to buy or sell an asset (usually a stock or index) at a fixed price (called the strike price) before or on a specific date (the expiry).
There are two types of options:
Call Option – Right to buy
Put Option – Right to sell
The seller (writer) of the option has the obligation to honor the contract.
Real-life Example
If you think a stock will go up, you buy a Call Option.
If you think it will go down, you buy a Put Option.

BSE LTD Intraday| 23 Dec 2025| +45 Points Clean Short Setup23 Dec 2025 | Simple & Easy BTR Indicator Setup
Consistency comes from simplicity — and today BTR proved it again.
Another smooth intraday short trade executed perfectly in BSE LTD, with clear entry, logical stop-loss, and disciplined exit.
🔍 Trade Overview
• Stock: BSE LTD
• Date: 23/12/2025
• Timeframe: 15-Minute
• Indicator Used: BTR Indicator ONLY
🔴 Entry Logic (Short)
✔ BTR generated a clear BEARISH signal
✔ Breakdown after rejection from higher levels
✔ Momentum shifted completely in sellers’ favor
🔻 SHORT ENTRY: 2755
🛑 Stop-Loss (Risk First)
📌 SL placed above recent Swing High
📌 Clean structure-based stop
📌 No guesswork, no emotional SL movement
🎯 Exit Execution
✔ Follow the system, follow the exit
✔ Price continued lower smoothly
🟢 EXIT BOOKED: 2715
📉 TOTAL PROFIT: +45 POINTS
🧠 Why This Trade Was Easy
✔ Clear BTR signal
✔ Strong bearish follow-through
✔ Proper SL placement
✔ No over-trading, no indicator clutter
📌 Strategy Rule
❌ No prediction
❌ No noise
❌ No multiple indicators
✅ Only BTR Indicator
✅ Follow entry & exit rules
✅ Trade becomes effortless
🔥 Final Thought
Trading is not about being right every time —
it’s about executing the same edge repeatedly.
BTR continues to deliver high-probability intraday setups in both directions.
📊 Follow for daily BSE intraday trades
💬 Comment / DM if you want to trade using BTR Indicator
Simple Rules. Clean Charts. Consistent Profits. 📉📈 NSE:BSE
📌 You can find the BTR Indicator in my TradingView profile → Scripts section
👉 Open my profile
👉 Go to Scripts / Indicators
👉 Add BTR Indicator to your chart
👉 Trade with zero noise & clear signals
Follow BTR. Follow Discipline. Trade Simple. ✅
If you want, I can also give you:
• A pinned profile bio line
• A comment reply template for followers
• A step-by-step “How to use BTR” post
Just tell me 👍

BTC Technical Outlook – Cycle High WatchBitcoin is potentially entering the final push of the current cycle, with price action forming a Head & Shoulders (H&S) structure near the newly formed ATH. While this pattern is not confirmed yet, it does raise caution for a possible local top.
📈 Upside Scenario:
Our immediate focus remains on the $111,000 zone, which aligns with a potential liquidity grab area. A push into this region followed by strong rejection would strengthen the bearish case.
📉 Risk Zone to Monitor:
If rejection occurs near $111K, attention will shift to the neckline area, which will be crucial in confirming the H&S breakdown.
⚠️ Key Takeaway:
Bullish continuation remains valid until rejection is confirmed
$111K = key upside target & decision zone
Neckline break would confirm trend exhaustion
_Wait for confirmation. Trade the reaction, not the prediction._
