Thematic and Sectoral Rotation TradingRiding Market Cycles with Strategic Precision
The financial markets do not move in a straight line. They evolve through cycles driven by economic growth, interest rates, inflation, government policies, technological innovation, and investor psychology. Within these cycles, leadership constantly shifts from one sector to another and from one powerful theme to the next. Thematic and sectoral rotation trading is a strategy that seeks to identify these shifts early and allocate capital to the areas of the market most likely to outperform at a given phase of the cycle. Instead of focusing on individual stock stories alone, this approach looks at the bigger picture, aligning trades with macroeconomic trends and structural changes in the economy.
Understanding Sectoral Rotation Trading
Sectoral rotation trading is based on the idea that different sectors perform better at different stages of the economic cycle. The economy typically moves through phases such as recovery, expansion, peak, slowdown, and recession. Each phase creates a favorable environment for specific industries.
For example, during an economic recovery, sectors like banking, real estate, automobiles, and capital goods often lead because credit growth picks up and consumer demand improves. In the expansion phase, IT services, consumer discretionary, and industrials may outperform as corporate profits grow. During periods of high inflation or uncertainty, defensive sectors such as FMCG, pharmaceuticals, and utilities tend to attract investor interest because of stable earnings. Sectoral rotation traders study these patterns and shift capital accordingly, aiming to stay invested in market leaders rather than laggards.
This approach reduces the risk of being stuck in underperforming sectors during unfavorable cycles. Instead of predicting which single stock will do well, traders focus on which sector has the wind at its back.
What is Thematic Trading?
Thematic trading goes a step beyond sectoral rotation. While sectors are broad classifications like banking, IT, or energy, themes are cross-sectoral narratives driven by long-term structural changes. A single theme can impact multiple industries simultaneously.
Examples of themes include digital transformation, renewable energy, electric vehicles, infrastructure development, defense manufacturing, China-plus-one supply chain shift, financial inclusion, and consumption growth in emerging markets. These themes often play out over several years rather than months. Thematic traders aim to identify these powerful narratives early and invest in companies that are direct or indirect beneficiaries.
Unlike sectoral rotation, which is more closely linked to economic cycles, thematic trading is driven by structural shifts that may continue even during economic slowdowns. For instance, digitization and automation can continue regardless of short-term GDP fluctuations.
The Role of Macroeconomics and Policy
Both thematic and sectoral rotation trading rely heavily on macroeconomic analysis. Interest rates, inflation, fiscal spending, monetary policy, and global economic trends act as triggers for rotation. In the Indian market, government policies play a particularly important role. Budget allocations, production-linked incentive (PLI) schemes, infrastructure spending, and reforms in banking or energy can create strong sectoral and thematic tailwinds.
For example, a rising interest rate environment may hurt rate-sensitive sectors like real estate but benefit banks through improved net interest margins. Similarly, a government push toward renewable energy can create a multi-year theme benefiting solar, wind, power equipment, and green financing companies. Traders who understand these macro-policy linkages gain a significant edge.
Time Horizon and Trading Style
Sectoral rotation trading is usually medium-term in nature, ranging from a few weeks to several months. Traders actively rebalance portfolios as leadership changes. Thematic trading, on the other hand, often suits positional or long-term investors who are willing to stay invested for years while tolerating short-term volatility.
However, both strategies can be adapted for trading if supported by technical analysis. Many traders combine top-down analysis (macro and sector/theme identification) with bottom-up analysis (stock selection and technical timing). This hybrid approach helps in entering themes and sectors at optimal points rather than chasing momentum blindly.
Tools Used in Rotation Trading
Successful thematic and sectoral rotation traders use a combination of tools:
Relative strength analysis to compare sector performance against benchmark indices
Sector indices and ETFs to track broad sector movements
Economic indicators such as PMI, inflation data, interest rates, and GDP growth
Technical indicators like moving averages, trendlines, and momentum oscillators
Earnings trends and valuations to avoid overpaying for popular themes
Relative strength is especially critical. A sector may be fundamentally strong, but if it is underperforming the broader market, capital is likely flowing elsewhere. Rotation trading is ultimately about capital flow analysis.
Advantages of Thematic and Sectoral Rotation Trading
One of the biggest advantages of this approach is alignment with market leadership. Markets reward sectors and themes where institutional money flows. By positioning in these areas, traders increase the probability of outperforming the benchmark.
Another advantage is diversification with direction. Instead of spreading capital randomly across stocks, traders diversify across high-conviction sectors or themes, reducing unsystematic risk while maintaining focus. This strategy also helps traders avoid emotional attachment to stocks and encourages a dynamic, adaptive mindset.
Risks and Challenges
Despite its advantages, thematic and sectoral rotation trading is not without risks. Themes can become overcrowded, leading to sharp corrections once expectations peak. Sectoral leadership can also change abruptly due to unexpected macro events such as geopolitical tensions, policy reversals, or global financial shocks.
Timing is another major challenge. Entering a theme too early can lead to long periods of underperformance, while entering too late can expose traders to sharp drawdowns. This is why discipline, risk management, and continuous review are essential.
The Indian Market Perspective
In India, thematic and sectoral rotation trading has gained popularity due to strong retail participation and clear policy-driven narratives. Sectors like PSU banks, infrastructure, defense, renewables, and manufacturing have shown how powerful rotations can be when aligned with economic and political trends. Indian markets are particularly sensitive to liquidity conditions and foreign institutional investor flows, making rotation strategies highly relevant.
Conclusion
Thematic and sectoral rotation trading is a sophisticated yet practical approach that bridges macroeconomic understanding with market execution. It encourages traders and investors to think beyond individual stocks and focus on where growth, capital, and narratives are converging. When executed with proper research, timing, and risk management, this strategy can help market participants stay ahead of cycles, capture leadership trends, and build sustainable performance over time. In a world of ever-changing markets, the ability to rotate intelligently is not just a skill—it is a necessity.
Harmonic Patterns
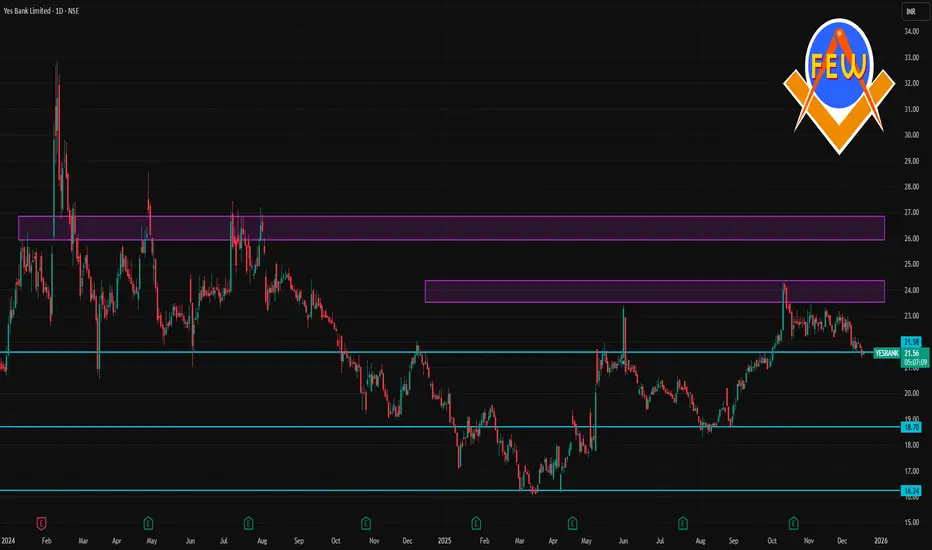
YESBANK 1 Day Time Frame 📊 Daily Time Frame Levels (1 D)
Current approximate price: ~₹21.7–₹22.7 (varies by source)
🔹 Pivot & Daily Reference Level
Daily pivot (Classic): ~ ₹22.58–₹22.60
🧱 Resistance Levels
Immediate resistance: ~ ₹24.00–₹24.03 (1st major upside barrier)
Above that, psychologically significant levels are near recent 52-week highs around ₹24.30
📉 Support Levels
Short-term support: ~ ₹22.22
Medium/stronger support: ~ ₹20.97
Lower support zones (broader view): ~ ₹19.17–₹18.50 (from broader multi-period analysis)
📈 Technical Indicator Snapshot (Daily)
RSI appears mid-range (neutral/slightly weak) on some chart summaries (~40–46), indicating no strong overbought/oversold condition on the daily chart.
Some aggregators still show a general sell bias based on moving averages and oscillator signals (especially if price < longer-term MAs).
🧠 How Traders Often Use These Levels
Bullish scenario: A sustained break above ₹24.00–₹24.30 with volume could target higher levels.
Bearish scenario: Failure below ₹20.97/₹20 may open the way toward ₹19–₹18 region.
Pivot plays: Near daily pivot (~₹22.58), intraday traders often watch for bounces or breaks for direction.
Trading with AssetsBuilding Wealth Through Smart Market Participation
Trading with assets is one of the most powerful ways individuals, institutions, and nations participate in the global financial system. At its core, asset trading involves buying and selling financial instruments with the objective of generating profits, preserving capital, or achieving strategic financial goals. Assets can range from traditional instruments such as stocks, bonds, commodities, and currencies to modern alternatives like cryptocurrencies, real estate investment trusts (REITs), and derivatives. Understanding how to trade these assets effectively requires knowledge, discipline, risk management, and a clear strategy.
Understanding What Assets Are
An asset is anything that holds economic value and can generate future benefits. In trading, assets are categorized into various classes, each with unique characteristics, risk profiles, and return potentials. Equity assets represent ownership in companies, debt assets like bonds represent loans to governments or corporations, commodities represent physical goods such as gold or oil, while currencies reflect the relative value of one economy against another. Modern financial markets have expanded asset definitions to include digital assets, carbon credits, and structured products.
Trading with assets allows market participants to allocate capital where they expect the best risk-adjusted returns. Unlike simple saving, asset trading actively puts money to work by taking advantage of price movements, economic cycles, and market inefficiencies.
Why Asset Trading Matters
Asset trading plays a crucial role in the economy. It provides liquidity to markets, helps in price discovery, and enables businesses and governments to raise capital. For traders and investors, it offers opportunities to grow wealth, hedge risks, and diversify income sources. In inflationary environments, certain assets like commodities or equities may outperform cash, making trading an essential tool for protecting purchasing power.
For individuals, asset trading can be a pathway to financial independence when approached responsibly. However, without proper understanding, it can also lead to significant losses. Hence, education and planning are vital.
Types of Asset Trading
Asset trading can broadly be divided into several approaches:
Equity Trading: Buying and selling shares of companies to profit from price appreciation or dividends. Traders may focus on blue-chip stocks, growth stocks, or sector-specific opportunities.
Fixed Income Trading: Trading bonds based on interest rate movements, credit quality, and macroeconomic factors.
Commodity Trading: Involves physical or derivative-based trading of resources like metals, energy, and agricultural products, often influenced by global supply-demand dynamics.
Forex Trading: Trading currency pairs based on economic data, central bank policies, and geopolitical developments.
Derivative Trading: Using futures, options, and swaps to speculate or hedge against price movements in underlying assets.
Alternative Asset Trading: Includes real estate, private equity, hedge funds, and digital assets such as cryptocurrencies and NFTs.
Each asset class responds differently to economic conditions, which is why diversification across assets is a cornerstone of successful trading.
Strategies for Trading with Assets
Successful asset trading is strategy-driven, not emotion-driven. Traders typically choose strategies based on time horizon, risk appetite, and market knowledge.
Short-term Trading: Includes intraday and swing trading, focusing on technical analysis, chart patterns, and momentum.
Long-term Trading or Investing: Focuses on fundamentals such as earnings growth, economic trends, and valuation metrics.
Trend Following: Traders identify and ride established market trends across asset classes.
Value-Based Trading: Buying undervalued assets and waiting for the market to recognize their true worth.
Hedging Strategies: Using derivatives or negatively correlated assets to protect portfolios from adverse market movements.
A clear strategy helps traders remain consistent and avoid impulsive decisions.
Risk Management in Asset Trading
Risk management is the backbone of asset trading. No strategy can succeed without controlling downside risk. Key risk management principles include position sizing, stop-loss placement, diversification, and maintaining proper risk-reward ratios. Traders must accept that losses are part of the process and focus on long-term consistency rather than short-term gains.
Overleveraging, lack of discipline, and emotional trading are common reasons traders fail. Successful traders prioritize capital preservation first and profits second.
Role of Technology and Data
Modern asset trading is heavily influenced by technology. Trading platforms, real-time data, algorithmic trading, and artificial intelligence have transformed how assets are traded. Retail traders now have access to tools that were once exclusive to institutions, such as advanced charting, economic calendars, and automated strategies.
However, technology is a tool, not a substitute for judgment. Understanding market behavior and economic context remains essential.
Psychology of Asset Trading
The psychological aspect of trading is often underestimated. Fear, greed, overconfidence, and regret can severely impact decision-making. Successful asset traders develop emotional control, patience, and the ability to follow their plan even during volatile market conditions. Journaling trades, reviewing performance, and continuous learning help in improving psychological discipline.
Asset Trading in a Global Context
Globalization has interconnected asset markets like never before. Events in one part of the world can instantly impact assets elsewhere. Interest rate decisions by central banks, geopolitical tensions, trade policies, and technological breakthroughs influence asset prices across borders. Traders who understand these interconnections gain a strategic advantage.
Conclusion
Trading with assets is both an opportunity and a responsibility. It offers immense potential for wealth creation, risk management, and financial growth, but it demands knowledge, discipline, and patience. By understanding different asset classes, applying well-defined strategies, managing risk effectively, and maintaining emotional control, traders can navigate complex markets successfully. Asset trading is not about chasing quick profits—it is about building a sustainable approach to participate intelligently in the ever-evolving financial markets.
XAUUSD – 15M | SMC-Based Trade PlanGold is currently in a corrective phase after a strong impulsive move to the upside. Price has delivered a clear displacement, followed by a pullback into a refined demand zone, highlighted on the chart. This area aligns with prior bullish order flow and acts as a discount zone within the higher-timeframe range.
The current sell-off appears corrective, not impulsive. Expectation is for price to mitigate demand, sweep weak lows if needed, and then resume the primary bullish structure.
Execution Plan (Important):
➡ No blind entries.
➡ Entry will be taken only if LTF confirms bullish intent (CHoCH, BOS, displacement from demand).

sensex on 17 december 2025 Finding resistance at trendline sloping downward PRZ level is 84131 if it breaks down 84500 level tomorrow

NIFTY- Intraday Levels - 17th December 2025If NIFTY sustain above 25874 above this bullish however actual bullish movement may come if sustains above 25944/48
If NIFTY sustain below 25856 below this bearish then 25839/29/14 below this more bearish then 25799/92 then last hope 25716/48/16/05 below this wait more levels marked on chart
My view :-
"My viewpoint, offered purely for analytical consideration, The trading thesis is: Nifty (bearish tactical approach: sell on rise)
As mentioned in my 15th dec analysis if day closing below 25863 will be considered bearish, todays closing is just below this level.
**Critical labor market and consumer spending data were released today (Tuesday, Dec 16, 2025) by which are not looking promising,
Retail Sales: Advance monthly figures were also released today; however, the more comprehensive retail sales report is due tomorrow, Wednesday, Dec 17, this sales will be the "tie-breaker"—if consumer spending remains strong (forecasted at +4.5% year-over-year), it may offset the negative jobs data**
This analysis is highly speculative and is not guaranteed to be accurate; therefore, the implementation of stringent risk controls is non-negotiable for mitigating trade risk."
Consider some buffer points in above levels.
Please do your due diligence before trading or investment.
**Disclaimer -
I am not a SEBI registered analyst or advisor. I does not represent or endorse the accuracy or reliability of any information, conversation, or content. Stock trading is inherently risky and the users agree to assume complete and full responsibility for the outcomes of all trading decisions that they make, including but not limited to loss of capital. None of these communications should be construed as an offer to buy or sell securities, nor advice to do so. The users understands and acknowledges that there is a very high risk involved in trading securities. By using this information, the user agrees that use of this information is entirely at their own risk.
Thank you.

Candle Patterns The Power of Context: Where Patterns Truly Work
Patterns are not standalone signals. Their effectiveness depends on context:
Trend Direction: Patterns aligned with the higher-timeframe trend have higher probability.
Support and Resistance: Patterns near key levels carry more weight.
Volume: Breakouts with volume confirm participation.
Market Structure: Higher highs and higher lows validate bullish patterns; lower highs and lower lows validate bearish ones.
A bullish engulfing in the middle of nowhere is noise. The same pattern at a weekly support level is opportunity.

Chart Patterns Financial markets speak a language of price. Every movement on a chart represents the collective psychology of millions of participants—institutions, traders, investors, algorithms, and speculators. Chart patterns and candlestick patterns are the visual translation of this psychology. They do not predict the future with certainty, but they provide probabilistic insights into market behavior, trend continuation, reversals, and momentum shifts. Mastering them allows traders to read price action with clarity, discipline, and confidence.

EARLY REVERSAL TRADE IDEA : DALBHARATLatest Corporate & Market News
Quarterly Results – Profit Surge
-Dalmia Bharat reported strong Q4 FY25 financials, with profit rising ~37% to ₹439 crore compared to last year.
-Achieved installed cement capacity milestone of 49.5 MTPA and announced 6 MTPA capacity expansion mainly for West India markets.
Cement firms including Dalmia are seeing moderate volume growth in Q2 FY26, supported by housing and infrastructure demand.
Fundamental Insight
Long-term fundamentals show mixed performance with modest sales growth and lower return on equity, though dividend payout remains relatively steady.
Quick Market Snapshot
Share price: ~₹2090–₹2100 (Dec 2025)
52-week range: ~₹1601 – ₹2496
Market cap: ~₹38,000–₹39,000 Cr
Analyst price targets: Mixed, generally positive bias in medium term
Implication for Traders/Investors
-Bullish catalysts:
Strong recent earnings beat
Capacity expansion
Dividend payouts & analyst target upgrades
Primary Entry: Buy in 2060–2000
Stop Loss: 1894
Targets: 2315 then 2491
KEY LEVELS
Demand Zone
1964 to 2000
Retest / FVG Zone
2060 to 1989
Invalidation (Stop Loss)
Below 1894 (daily close)
Upside Targets
Initial Target – 2315
Full Target – 2491
Disclaimer: aliceblueonline.com

XAU/USD Quick Analysis (Gold) 16/12/2025Gold is trading near the 4280–4285 zone, which is the key decision level for today. On lower timeframes, price is weak and range-bound, while higher timeframes remain bullish, indicating a short-term pullback within a larger uptrend.
As long as gold stays below 4285, intraday bias remains bearish, with selling pressure likely near 4290–4310. Downside targets and buy-on-dip zones are 4275, 4260–4255, and 4245–4240. A strong hold above 4290 can flip intraday bias back to bullish, targeting 4305–4320.
For swing trades, the trend stays bullish above 4205–4210. Only a break below 4200 would weaken the bigger picture.
⚠️ Disclaimer: This is for educational purposes only, not financial advice. Trade with proper risk management.

Part 2 Intraday Trading Master ClassNon-Directional (Range-Bound) Strategies
These strategies profit when the market does not move much.
Short Straddle Strategy
Concept: Sell Call + Sell Put at same strike.
Profit: Premium received
Risk: Unlimited
Best Market Condition: Low volatility, sideways market
Use Case:
When expecting very low movement, typically before event expiry.
Warning:
High-risk strategy, requires strict risk management.

Part 1 Intraday Trading Master Class Covered Call Strategy (Moderately Bullish)
Concept: Hold shares and sell a call option.
Profit: Limited
Risk: Stock downside risk remains
Best Market Condition: Mild uptrend or sideways
Use Case:
Ideal for long-term investors to earn regular income.

XAUUSD | 15M | SMC PerspectivePrice has delivered a strong bearish displacement, confirming short-term market structure shift to the downside. The recent impulse left behind a clean bearish order block / supply zone, which is now acting as premium territory.
Current price is reacting from discount and may attempt a pullback into the marked supply zone for mitigation. That zone is the key decision area.
Plan:
Expect a retracement into supply
Look for LTF confirmation only inside the zone
Rejection from supply should open the path toward the liquidity pool near 4257, which aligns with prior lows and equal lows resting liquidity
Bias: Bearish
Execution rule: Entry will be taken only if LTF aligns with HTF bearish expectation

Short-Term Trading vs. Long-Term Trading1. Time Horizon
Short-Term Trading:
Focuses on quick market moves. Trades last from a few minutes to a few days or weeks. The goal is to profit from immediate price fluctuations.
Long-Term Trading:
Built on patience. Positions are held for months, years, or even decades to benefit from long-term growth and compounding.
2. Core Objective
Short-Term Trading:
Capture small but frequent profits by exploiting volatility, momentum, and short-lived opportunities.
Long-Term Trading:
Build wealth steadily by participating in the long-term growth of businesses, sectors, or economies.
3. Analysis Style
Short-Term Trading:
Heavily dependent on technical analysis
Uses charts, patterns, indicators, volume, and price action
News and sentiment play a major role
Long-Term Trading:
Primarily driven by fundamental analysis
Focuses on earnings, growth potential, balance sheets, management quality, and industry trends
4. Market Noise vs. Market Value
Short-Term Trading:
Thrives on market noise. Small price movements and emotional reactions create trading opportunities.
Long-Term Trading:
Ignores daily noise. Concentrates on intrinsic value and long-term business strength.
5. Risk and Reward Profile
Short-Term Trading:
Higher risk per trade due to volatility
Risk is actively controlled through stop-losses
Frequent wins and losses
Long-Term Trading:
Lower day-to-day risk perception
Exposed to economic cycles and structural changes
Fewer decisions, but higher conviction required
6. Capital and Leverage
Short-Term Trading:
Often uses leverage to amplify small moves
Requires strict money management to avoid large drawdowns
Long-Term Trading:
Generally unleveraged
Capital grows through appreciation, dividends, and compounding
7. Emotional and Psychological Demand
Short-Term Trading:
Mentally intense and emotionally challenging
Requires fast decision-making and strong emotional control
Fear and greed must be managed daily
Long-Term Trading:
Emotionally calmer but tests patience
Requires discipline during market crashes and rallies
Conviction matters more than speed
8. Time Commitment
Short-Term Trading:
High time involvement
Needs constant monitoring during market hours
Can feel like a full-time profession
Long-Term Trading:
Low time involvement
Periodic review and rebalancing
Suitable for people with limited daily time
9. Cost and Tax Impact
Short-Term Trading:
Higher brokerage, transaction costs, and taxes
Profits can be reduced if costs are not controlled
Long-Term Trading:
Lower transaction frequency
Often more tax-efficient
Better net returns over time
10. Learning Curve
Short-Term Trading:
Steep learning curve
Requires backtesting, journaling, and continuous improvement
Long-Term Trading:
Gradual learning process
Emphasis on understanding businesses and macro trends
11. Lifestyle Compatibility
Short-Term Trading:
Best suited for active individuals who enjoy fast-paced environments
Requires focus, routine, and discipline
Long-Term Trading:
Ideal for those seeking financial growth alongside career or business
Less stress, more freedom
12. Wealth Creation Potential
Short-Term Trading:
Income-oriented approach
Success depends on consistency and risk control
Long-Term Trading:
Wealth-oriented approach
Compounding is the biggest advantage
13. Who Should Choose What?
Choose Short-Term Trading if you:
Enjoy active market participation
Can manage stress and emotions
Have time to monitor markets daily
Choose Long-Term Trading if you:
Believe in patience and compounding
Prefer stability over excitement
Want to grow wealth with minimal daily involvement
Final Takeaway
Short-term trading is about skill, speed, and discipline.
Long-term trading is about patience, conviction, and compounding.

Positional Trading vs. Swing Trading in the Indian MarketUnderstanding Positional Trading
Positional trading is a medium- to long-term trading style where traders hold positions for several weeks to a few months. The goal is to benefit from a larger directional move driven by strong trends, fundamental changes, or long-term technical breakouts.
In the Indian market, positional traders often focus on:
Strong sectoral themes (banking, IT, pharma, PSU, metals)
Macroeconomic trends (interest rates, inflation, GDP growth)
Company fundamentals (earnings growth, balance sheet strength)
Long-term technical structures on weekly or monthly charts
For example, a positional trader may buy a banking stock when interest rate cuts are expected and hold it for three to six months as the sector re-rates.
Key Characteristics of Positional Trading:
Holding period: Weeks to months
Charts used: Daily, weekly, monthly
Trade frequency: Low
Stop loss: Wider
Target size: Large
Stress level: Comparatively low
Positional traders are less affected by daily market noise. Short-term volatility caused by global cues or intraday news does not usually force them out of trades unless the broader trend changes.
Understanding Swing Trading
Swing trading is a short- to medium-term strategy where traders aim to capture price swings within a trend. Positions are usually held from a few days to a few weeks. Swing traders actively trade market fluctuations and are more sensitive to technical signals.
In the Indian market, swing trading is extremely popular because:
Volatility is high, especially in mid-cap and small-cap stocks
Weekly option expiry cycles create frequent momentum
Retail participation leads to sharp price swings
Technical patterns work well on short time frames
Swing traders typically rely on:
Support and resistance levels
Chart patterns (flags, triangles, double tops/bottoms)
Indicators like RSI, MACD, moving averages
Volume and price action
For instance, a swing trader may buy a stock near a strong support level after a pullback and exit within 5–10 days once resistance is reached.
Key Characteristics of Swing Trading:
Holding period: 2 days to 2–3 weeks
Charts used: Hourly, 4-hour, daily
Trade frequency: Moderate to high
Stop loss: Tight
Target size: Moderate
Stress level: Higher than positional trading
Swing trading requires regular monitoring of positions and quick decision-making.
Time Commitment and Lifestyle Differences
One of the biggest differences between positional and swing trading in India is time involvement.
Positional trading is suitable for working professionals, business owners, or investors who cannot watch markets daily. Once a trade is planned, only periodic review is required.
Swing trading demands more screen time. Traders must track price movements, adjust stop losses, and respond to market changes, especially around events like RBI policy announcements or global market moves.
If you can spend only limited time on markets, positional trading is often more practical.
Risk Management and Capital Requirements
Risk management plays a crucial role in both styles, but it is applied differently.
Positional Trading Risk Profile:
Wider stop losses due to long-term volatility
Lower position size per trade
Fewer trades reduce transaction costs
Overnight and weekend gap risk exists
Swing Trading Risk Profile:
Tighter stop losses
Higher position turnover
More brokerage and taxes due to frequent trading
Lower gap risk due to shorter holding period
In the Indian context, where sudden news (budget announcements, election results, global market shocks) can cause gaps, positional traders must be mentally prepared for drawdowns.
Role of Fundamentals vs. Technicals
Positional traders give higher importance to fundamentals combined with technicals. They often enter trades only when both align.
Swing traders rely primarily on technical analysis. Fundamentals are secondary and mainly used to avoid weak stocks.
For example, a swing trader may trade a technically strong stock even if long-term fundamentals are average, whereas a positional trader may avoid it.
Impact of Indian Market Structure
The Indian market has some unique features that influence both styles:
Weekly and monthly F&O expiry increases short-term volatility (benefits swing traders)
High retail participation leads to emotional price swings
Sector rotation is frequent, creating positional opportunities
Global dependency (US markets, crude oil, dollar index) affects both styles differently
Swing traders often benefit from expiry-related momentum, while positional traders benefit from broader economic and sectoral trends.
Psychology and Discipline
Psychology is where many traders fail.
Positional trading psychology requires patience, conviction, and the ability to sit through temporary drawdowns.
Swing trading psychology demands quick execution, emotional control, and acceptance of frequent small losses.
In India, where social media tips and news-driven trading are common, swing traders are more prone to overtrading, while positional traders risk holding losing positions for too long.
Which Is Better for Indian Traders?
There is no universally “better” approach. The choice depends on:
Your time availability
Risk tolerance
Capital size
Personality and patience level
Market experience
Positional trading is better if you:
Prefer low-frequency trades
Have limited screen time
Believe in macro and sectoral trends
Can handle longer drawdowns
Swing trading is better if you:
Can actively monitor markets
Enjoy technical analysis
Prefer faster results
Are comfortable with frequent decision-making
Many successful Indian traders use a hybrid approach, combining positional trades in strong sectors with swing trades for short-term opportunities.
Conclusion
In the Indian market, both positional trading and swing trading offer excellent opportunities when applied correctly. Positional trading focuses on capturing big trends with patience and discipline, while swing trading aims to profit from short-term price movements with active involvement. Understanding your personality, market conditions, and risk management skills is more important than choosing one style over the other. Ultimately, consistency, discipline, and continuous learning determine success—regardless of whether you are a positional trader or a swing trader.
Divergence Secrets Long Put Strategy (Bearish)
Concept: Buy a put option expecting the price to fall.
Maximum Loss: Premium paid
Maximum Profit: Large (limited by zero price)
Best Market Condition: Strong downtrend
Use Case:
Used during market crashes, breakdowns, or negative news events.

XAUUSD GOLD Analysis on (16 Dec 2025)#XAUUSD UPDATEDE
Current price - 4287
Buy Limited - 4252-4236(Strong buy zone)
If price stay above 4218 then next target ,4300,4350 and 4380 and below that 4198
Plan;If price break 4252-4236 area,and stay above 4255,we will place buy order in gold with target of 4300,4350 and 4380 & stop loss should be placed at 4218

Option Trading Strategies Directional Option Trading Strategies
Directional strategies are used when the trader has a clear bullish or bearish view on the underlying asset.
Long Call Strategy (Bullish)
Concept: Buy a call option expecting the price to rise.
Maximum Loss: Premium paid
Maximum Profit: Unlimited
Best Market Condition: Strong uptrend
Use Case:
When you expect sharp upside movement with high momentum.
Risk:
If price does not move fast enough, time decay erodes option value.

ICICIBANK 1 Day Time Frame 📊 Current Live Price (approx): ₹1,364–1,365 on NSE as of this session.
🟢 Daily Pivot & Intraday Levels
(from pivot analysis)
Pivot Points (Standard / Daily):
Pivot: ~1363.8
Resistance 1 (R1): ~1371
Resistance 2 (R2): ~1377
Resistance 3 (R3): ~1385
Support Levels:
Support 1 (S1): ~1357
Support 2 (S2): ~1350
Support 3 (S3): ~1343
👉 Price staying above pivot ~1364 suggests slight short‑term strength; a break above R1 ~1371 could see extension toward ~1378–1385. Sustained breaks below S1/S2 may trigger momentum toward ~1350 or lower.

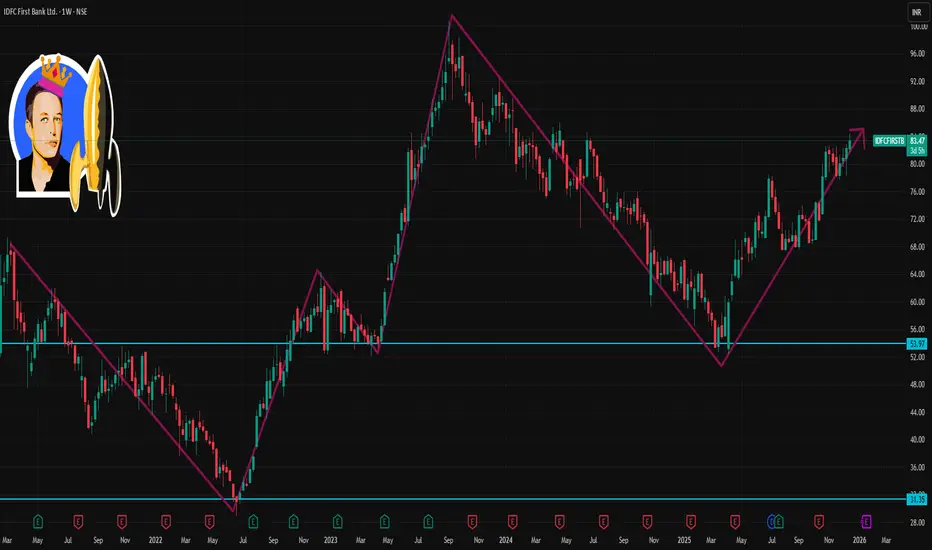
IDFCFIRSTB 1 Week Time Frame 📊 Weekly Support & Resistance Levels
Weekly Resistance Levels
R1: ~₹83.96 — immediate weekly resistance (key breakout level)
R2: ~₹85.63 — next major resistance
R3: ~₹88.44 — extended upside if trend is strong
Weekly Support Levels
S1: ~₹79.48 — first strong weekly support
S2: ~₹76.67 — secondary support zone
S3: ~₹75.00 — deeper support if weakness accelerates
Weekly Pivot (approx central point)
Around ₹81.15–₹81.72 based on weekly pivot analysis
📌 Key Reference Price Context
The stock is currently trading around ₹83‑₹84 on the NSE (Dec 16, 2025).
52‑week range is roughly ₹52.46 low to ~₹84.4 high; price is near its yearly peak.
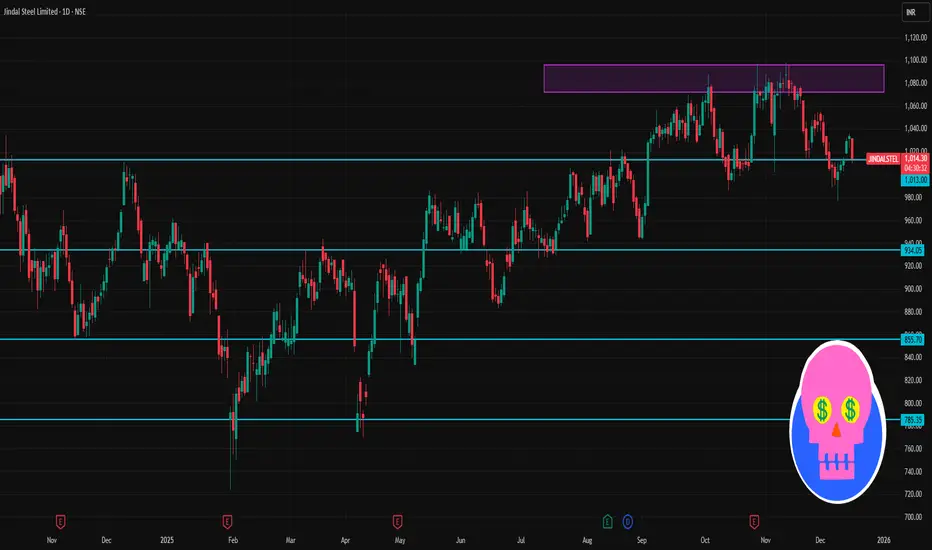
JINDALSTEL 1 Day Time Frame 📊 Daily Pivot & Key Levels
Pivot Point (Reference): ~₹1,010–₹1,010.27
(This is the central level where direction bias flips intraday.)
🔼 Resistance Levels
R1: ~₹1,017.9 – ₹1,018 📈
R2: ~₹1,022.9 – ₹1,041 📈
R3: ~₹1,030.6 – ₹1,049.9 📈
(Breaking and holding above these can signal bullish strength.)
🔽 Support Levels
S1: ~₹1,005.2 – ₹1,006.2 📉
S2: ~₹997.5 – ₹1,012 📉
S3: ~₹992.5 – ₹1,006 📉
(These act as downside cushions — watch for bounces or breakdowns.)
📈 Short‑Term Bias & Indicators
Moving Averages: Near current price, shorter and medium SMAs/EMAs are tight — indicating potential range trading unless breakout occurs.
RSI: Around neutral (~49), not strongly overbought/oversold.
📊 How Traders Use These
Bullish Scenario: Price sustaining above Pivot → target R1 ➜ R2 ➜ R3.
Bearish Scenario: Price breaking below Pivot → test S1 ➜ S2 ➜ S3.
Range Trades: Buy near supports with stop just below; sell near resistance with stop just above.
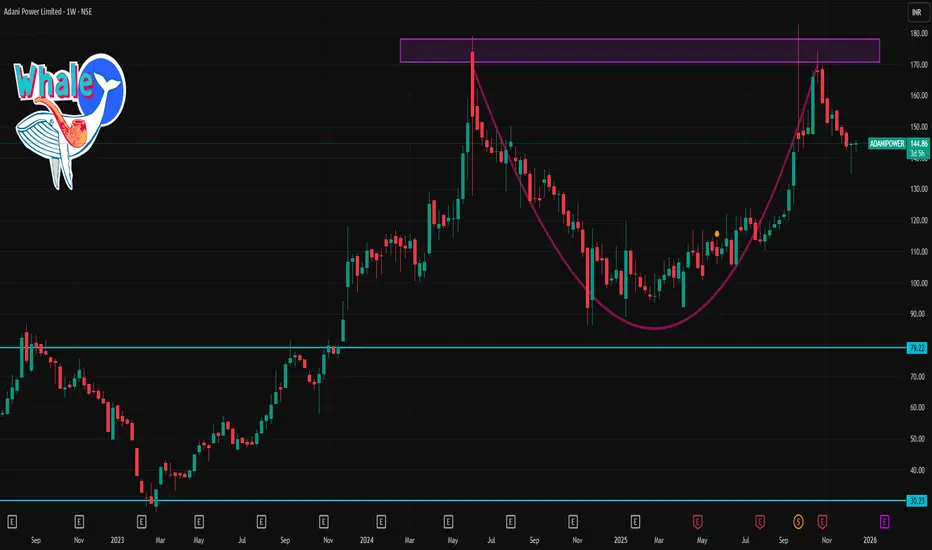
ADANIPOWER 1 Week Time Frame 📊 Current price context
• Share price is around ₹144–₹146 per share (as of latest session).
📈 Resistance Levels (Upside)
These are prices where the stock may face selling pressure or pause before further upmove:
1. ~₹147–₹149 — near short-term resistance cluster.
2. ~₹150–₹153 — pivot/fib resistance from short-term charts.
3. ~₹160–₹165/₹170 — higher target zone if bullish momentum strengthens.
➡️ If the price breaks above ₹150–₹153 with good volume, next upside could test ₹160+ over the week.
📉 Support Levels (Downside)
These are price zones that might act as demand zones if declines occur:
1. ~₹142–₹143 — immediate support from recent pivot levels.
2. ~₹140–₹139 — deeper support if weakness persists.
3. ₹135–₹134 (Lower) — secondary support seen in broader fib/pivot analysis.
➡️ A close below ₹142–₹140 could open the path toward ₹135+ on short-term weakness.
ASIANPAINT 1 Day Time Frame 📊 Current Trading Context (latest session data)
The stock today has traded between ₹2,746 and ₹2,797.
Latest price around ₹2,780–₹2,788 (price fluctuating intraday).
📈 Intraday Technical Levels (Daily Pivot-Style)
Resistance Levels (Upside):
R1: ₹2,792 – ₹2,793
R2: ₹2,820 – ₹2,821
R3: ₹2,844 – ₹2,846
(These are key zones where upside can stall)
Support Levels (Downside):
S1: ₹2,741 – ₹2,742
S2: ₹2,718 – ₹2,720
S3: ₹2,690 – ₹2,692
(These are key zones where price might find a floor)
📌 How to Use These Levels Today
Bullish scenario:
✔ Sustained move above ₹2,792–₹2,793 may target ₹2,820 and then ₹2,844.
Bearish scenario:
✔ Failure below ₹2,742 may push towards ₹2,720 and then ₹2,690.
Neutral / range:
✔ Between ₹2,742 and ₹2,792, expect sideways chop unless volume breaks out.
