ASIANPAINT 1 Day Time Frame 📊 Current Price (approx): ₹2,402 – ₹2,410 (NSE intraday/daily) as of latest market data.
🔁 Daily Pivot Levels
Pivot (central reference): ~₹2,379–₹2,380
Resistance Levels:
• R1: ~₹2,416–₹2,417
• R2: ~₹2,475–₹2,476
• R3: ~₹2,512–₹2,513
Support Levels:
• S1: ~₹2,320–₹2,321
• S2: ~₹2,283–₹2,284
• S3: ~₹2,224–₹2,225
(from classic daily pivot structure)
📈 How to Use These Levels (Daily Basis)
Bullish scenario (if buyers strong):
Sustained break above R1 (~₹2,416) targets R2 (~₹2,475) & then R3 (~₹2,512).
Neutral / sideways zone:
Price hovering between Pivot (~₹2,380) and R1 (~₹2,416) suggests range‑bound moves.
Bearish scenario (if selling pressure):
Break below S1 (~₹2,320) can open path towards S2 (~₹2,283) and then S3 (~₹2,224).
📌 Short‑Term Technical Snapshot
Asian Paints price action has been under pressure recently as technical indicators show muted momentum and the stock trading below several moving averages (20‑day/50‑day) reflecting short‑term neutral to weak bias.
Always combine pivot levels with volume and price action signals (e.g., breakouts with confirmation) for better trade decisions.
Harmonic Patterns

BSE 1 Day Time Frame 📌 Current Price & Daily Range (Live Context)
Estimated current market price: ~₹2,850–₹2,880 (indicative from multiple sources citing latest live price movement).
Today’s daily high/low range: Approx ₹2,793–₹2,929 (observed current session variation).
⚠️ Exact live price can differ by minutes — check your trading platform for exact tick.
📈 1‑Day Pivot & Levels (Daily timeframe)
Classic Pivot Zone:
Pivot Point: ~₹2,647–₹2,663 (key balance level)
Immediate Resistance (Upside Targets):
R1: ~₹2,765–₹2,775
R2: ~₹2,828–₹2,830
R3: ~₹2,940 or higher (extended resistance)
Key Support (Downside Levels):
S1: ~₹2,584–₹2,625
S2: ~₹2,466–₹2,575
S3: ~₹2,403–₹2,537 — major downside pivot safety zone.
👉 Price above pivot generally signals bullish intraday bias; below pivot suggests weakness.
📊 Trend & Momentum (Daily)
Indicators & moving averages:
Price is trading above 20/50/100/200‑day EMAs, indicating a bullish trend on the daily chart.
RSI near neutral‑to‑positive zone (~50), showing room for further continuation before overbought.
This suggests bullish bias on daily timeframe, but resistance zones near ₹2,828–₹2,940 are key to break for sustained upside.
🧠 How to interpret the daily levels today
Bullish scenarios (1‑Day):
✔ Above ₹2,828–₹2,830 — expands move toward ₹2,940+.
✔ Sustained above pivot ~₹2,650+ — retains short‑term bullish structure.
Neutral / consolidative:
➡ Between ₹2,650 – ₹2,828 — range balance, sideways action likely.
Bearish scenarios (1‑Day):
✘ Break below ₹2,584 — could pull toward ₹2,466 / ₹2,403 supports.

SIEMENS 1 Day Time Frame 📌 Current Price (Live/Latest data)
Siemens Ltd trading around ₹3,220 – ₹3,230 in today’s session.
(Note: prices fluctuate continuously during trading hours — these are live approximate levels today.)
📊 Daily Pivot & Key Levels (1‑Day Timeframe)
These are calculated based on the previous trading day’s price range — useful for intraday bias:
✔️ Pivot & Main Levels
Pivot (Central level): ~ ₹3,002 – ₹3,053
Resistance 1 (R1): ~ ₹3,114 – ₹3,134
Resistance 2 (R2): ~ ₹3,178 – ₹3,246
Resistance 3 (R3): ~ ₹3,258 – ₹3,358
Support 1 (S1): ~ ₹2,870 – ₹3,009
Support 2 (S2): ~ ₹2,759 – ₹2,928
Support 3 (S3): ~ ₹2,626 – ₹2,883
📈 How to Interpret Today’s Levels
✅ Bullish scenario:
Price holding above Pivot (~₹3,000–₹3,050) suggests bullish bias.
Sustained move above R1 (~₹3,114) targets higher zones near R2 (~₹3,178) and R3 (~₹3,250+).
❗ Bearish scenario:
Breakdown below Pivot (~₹3,000) can weaken bias.
Drop below S1/S2 (~₹2,870–₹2,928) signals deeper decline nearer S3 (~₹2,626).
📌 Intraday Price Action Today
Intraday range seen ~₹3,160 low to ~₹3,246 high in the ongoing session.
🧠 Market Context
The stock recently traded within a broader range but remains above major pivot and moving average zones, which supports short-term strength.

DAILY FOREX SCAN Session – 23 03 02 26Scanning multiple forex pairs to filter high-quality trade setups. No trades are forced—only structure-based opportunities.
Note: There may be a delay in this video due to upload processing time.
Disclaimer: FX trading involves high leverage and substantial risk, and losses can exceed your initial investment. This content is for educational purposes only and should not be considered financial advice. Trade at your own risk.

Cryptocurrency & Digital Asset MarketsIntroduction
The rise of cryptocurrencies and digital assets represents one of the most significant innovations in financial markets over the last decade. Originating with Bitcoin in 2009, cryptocurrencies have evolved from a niche technology experiment into a multi-trillion-dollar ecosystem encompassing thousands of digital assets, decentralized finance (DeFi) protocols, non-fungible tokens (NFTs), stablecoins, and blockchain-based applications. These markets challenge traditional financial structures by providing decentralized, borderless, and programmable forms of money and value transfer. Understanding the structure, dynamics, and risks of cryptocurrency markets is crucial for investors, traders, and policymakers alike.
Cryptocurrency and Digital Asset Basics
Cryptocurrencies are digital or virtual currencies that use cryptography for security, making them resistant to counterfeiting. Unlike fiat currencies, cryptocurrencies operate on decentralized networks, primarily using blockchain technology—a distributed ledger that records all transactions transparently and immutably.
Bitcoin (BTC): The first and most widely recognized cryptocurrency, designed as a decentralized digital alternative to traditional currency.
Altcoins: Other cryptocurrencies such as Ethereum (ETH), Cardano (ADA), Solana (SOL), and Ripple (XRP) with specific use cases beyond payment, including smart contracts, decentralized applications (dApps), and finance.
Stablecoins: Cryptocurrencies pegged to traditional currencies like USD (e.g., USDT, USDC) to minimize volatility and serve as a medium of exchange in digital markets.
Tokens: Digital assets built on existing blockchains, representing assets, access rights, or utilities within ecosystems.
Digital assets encompass a broader category beyond cryptocurrencies. They include NFTs, tokenized securities, and digital representations of real-world assets. Digital assets are programmable, tradable, and often interoperable across blockchain networks.
Market Structure
Cryptocurrency markets differ from traditional financial markets in several key aspects:
Decentralization: Unlike stock or bond markets, many cryptocurrency markets operate without a central exchange or authority. Peer-to-peer trading, decentralized exchanges (DEXs), and blockchain protocols allow transactions without intermediaries.
24/7 Trading: Cryptocurrency markets never close. Trading occurs continuously, globally, providing high liquidity opportunities but also exposing participants to constant market risk.
Market Participants: Participants include retail investors, institutional investors, miners, validators, and algorithmic trading bots. Institutional adoption has grown in recent years, introducing products like cryptocurrency ETFs, futures, and custody services.
Exchanges: Cryptocurrencies trade on centralized exchanges (CEXs) like Binance, Coinbase, and Kraken, which provide liquidity, custody, and compliance. Decentralized exchanges like Uniswap and Sushiswap operate without intermediaries, using smart contracts to facilitate trades.
Price Determinants
Cryptocurrency prices are influenced by multiple factors:
Supply and Demand: Fixed supply (e.g., Bitcoin’s 21 million cap) versus demand from investors, institutions, and retail users.
Market Sentiment: News, social media, and macroeconomic events can significantly impact crypto prices due to market psychology and herd behavior.
Regulation: Legal frameworks in different countries affect adoption and trading. Positive regulation encourages investment, while bans or restrictions can trigger sell-offs.
Technological Developments: Upgrades to blockchain protocols, new network features, or innovations in scalability and security can drive price appreciation.
Macro Factors: Inflation, interest rates, and currency depreciation indirectly influence crypto adoption as an alternative store of value.
Key Market Segments
Spot Market: The direct buying and selling of cryptocurrencies at current prices. Spot trading is the foundation of crypto markets.
Derivatives Market: Includes futures, options, and perpetual contracts allowing traders to hedge, speculate, or leverage positions. Derivatives markets add liquidity but increase systemic risk.
Decentralized Finance (DeFi): A rapidly growing sector offering lending, borrowing, yield farming, and automated market-making without traditional banks. DeFi uses smart contracts to automate financial services.
NFT Market: Non-fungible tokens represent unique digital assets such as art, collectibles, or virtual real estate. NFTs are changing the way ownership and creativity are monetized.
Tokenized Assets: Traditional assets like real estate, commodities, or stocks are increasingly tokenized to enable fractional ownership, faster settlements, and cross-border liquidity.
Trading and Investment Strategies
Cryptocurrency markets offer diverse opportunities, but they are highly volatile and risky. Common strategies include:
HODLing: Long-term holding of cryptocurrencies based on belief in their future adoption and value appreciation.
Day Trading: Short-term trading to exploit price volatility within intraday movements.
Swing Trading: Capturing medium-term price trends over days or weeks.
Arbitrage: Exploiting price differences between exchanges or markets.
Staking and Yield Farming: Earning rewards by locking cryptocurrencies in networks or DeFi protocols.
Market Risks and Challenges
Cryptocurrency and digital asset markets are exposed to several unique risks:
Volatility: Price swings of 10–20% in a single day are common. Extreme volatility can lead to significant gains or catastrophic losses.
Security Risks: Hacks, scams, phishing, and vulnerabilities in smart contracts or exchanges have historically caused large financial losses.
Regulatory Uncertainty: Governments worldwide are still defining legal frameworks. Sudden regulations can restrict access or impact asset values.
Liquidity Risk: Smaller cryptocurrencies may have low trading volume, making it difficult to enter or exit positions at desired prices.
Technological Risk: Blockchain bugs, network forks, and software vulnerabilities can disrupt trading and asset functionality.
Market Manipulation: Low liquidity and lack of regulation in some areas make cryptocurrencies susceptible to pump-and-dump schemes and price manipulation.
Adoption and Institutional Participation
Institutional adoption has accelerated the growth of cryptocurrency markets:
Major financial institutions now offer crypto custody, trading, and investment products.
Hedge funds, pension funds, and insurance companies are allocating portions of their portfolios to digital assets.
Payment companies like PayPal and Mastercard facilitate crypto transactions.
Central banks are exploring Central Bank Digital Currencies (CBDCs), potentially integrating digital assets with traditional monetary systems.
Regulatory Landscape
Regulation remains a defining factor in the future of crypto markets:
Countries like the United States and the European Union are working on clear regulatory frameworks covering taxation, anti-money laundering (AML), and investor protection.
Some nations, such as El Salvador, have adopted cryptocurrencies as legal tender.
Others, like China, have banned crypto trading and mining, illustrating the wide divergence in global policies.
Regulatory clarity is expected to increase market legitimacy, attract institutional capital, and reduce systemic risks.
Future Trends
DeFi Expansion: Decentralized finance is expected to grow, providing more sophisticated financial services without intermediaries.
Web3 Integration: Blockchain technology will underpin digital identity, social networks, and decentralized applications, creating new ecosystems for value exchange.
Layer-2 Scaling: Solutions like Ethereum’s layer-2 protocols aim to reduce transaction costs and increase network speed.
Interoperability: Cross-chain solutions will enable seamless asset transfers between blockchain networks.
Sustainable Practices: Energy-efficient consensus mechanisms like Proof-of-Stake (PoS) will gain traction over energy-intensive Proof-of-Work (PoW) models.
Conclusion
Cryptocurrency and digital asset markets represent a paradigm shift in how value is created, transferred, and stored. They combine technological innovation with financial markets, providing opportunities for speculation, investment, and new financial services. However, these markets remain highly volatile, technologically complex, and subject to regulatory uncertainty. Successful participation requires a strong understanding of blockchain fundamentals, market dynamics, risk management, and strategic foresight. As adoption grows and regulation matures, digital assets are likely to become a mainstream component of global finance, reshaping economies, investment strategies, and the financial system itself.

Geopolitical Events & Global ConflictsUnderstanding Geopolitics
Geopolitics refers to how geographical factors such as location, natural resources, population, borders, and strategic routes influence political power and international behavior. Countries do not act in isolation; their decisions are shaped by neighboring states, access to oceans, energy resources, trade corridors, and military vulnerabilities.
For example, control over choke points like the Strait of Hormuz, the Suez Canal, or the South China Sea holds immense strategic value because a large share of global trade and energy supplies passes through these regions. Any disruption in such areas can ripple through the global economy, causing spikes in oil prices, supply chain disruptions, and market volatility.
Types of Geopolitical Events
Geopolitical events can take many forms, not all of which involve direct warfare:
Military Conflicts and Wars
These include full-scale wars, regional conflicts, border skirmishes, and civil wars with international involvement. Examples include interstate wars, proxy wars, and internal conflicts that draw global attention due to humanitarian or strategic concerns.
Diplomatic Tensions and Alliances
Diplomatic standoffs, sanctions, treaty breakdowns, or the formation of new alliances (such as military or trade blocs) are major geopolitical events. Organizations like NATO, BRICS, ASEAN, and the United Nations play central roles in shaping these dynamics.
Economic and Trade Conflicts
Trade wars, sanctions, tariffs, and restrictions on technology or capital flows are increasingly common tools of geopolitical competition. Economic power has become as important as military strength in influencing global outcomes.
Energy and Resource Disputes
Conflicts over oil, gas, water, rare earth metals, and food security are becoming more prominent as global demand rises and resources become scarcer.
Political Instability and Regime Changes
Coups, revolutions, contested elections, and sudden policy shifts can alter regional balances of power and affect global markets.
Causes of Global Conflicts
Global conflicts rarely arise from a single cause. Instead, they are the result of overlapping and reinforcing factors:
Territorial Disputes: Disagreements over borders, islands, or strategic regions are among the most common triggers of conflict.
Economic Inequality and Competition: Competition for markets, resources, and technological dominance often fuels tensions between major powers.
Ideological Differences: Conflicts between political systems, governance models, or belief systems have historically driven major global confrontations.
Ethnic and Religious Divisions: Internal conflicts rooted in identity can escalate into regional or global crises when external powers intervene.
Power Transitions: When a rising power challenges an established global leader, instability often follows as both sides seek to protect their interests.
Role of Major Global Powers
Major powers such as the United States, China, Russia, and the European Union play outsized roles in global geopolitics. Their military capabilities, economic influence, technological leadership, and diplomatic reach shape global outcomes.
The United States has long acted as a global security provider, with military bases and alliances around the world.
China focuses on expanding economic and strategic influence through trade, infrastructure investment, and regional dominance.
Russia leverages energy resources, military power, and regional influence to maintain its geopolitical standing.
The European Union emphasizes diplomacy, economic integration, and regulatory power, though internal divisions sometimes limit unified action.
Smaller regional powers also play critical roles, especially in geopolitically sensitive regions such as the Middle East, South Asia, Eastern Europe, and East Asia.
Impact on the Global Economy
Geopolitical events and conflicts have immediate and long-term economic consequences:
Financial Markets: Stock markets often react sharply to geopolitical uncertainty, while safe-haven assets like gold, government bonds, and certain currencies gain demand.
Commodity Prices: Conflicts involving energy-producing regions can cause oil, gas, and food prices to surge, fueling inflation.
Supply Chains: Wars, sanctions, and political tensions disrupt global supply chains, forcing companies to rethink sourcing and production strategies.
Investment Flows: Political instability discourages foreign investment and increases risk premiums.
For investors and traders, geopolitical risk has become a key factor in decision-making, alongside traditional economic indicators.
Humanitarian and Social Consequences
Beyond economics and politics, global conflicts have profound human costs. Armed conflicts lead to loss of life, displacement of populations, refugee crises, and long-term social trauma. Infrastructure destruction, food shortages, and healthcare disruptions often persist long after fighting ends.
International organizations, humanitarian agencies, and NGOs play vital roles in conflict zones, but their efforts are frequently constrained by security risks and political barriers.
Technology and Modern Warfare
Modern geopolitical conflicts increasingly involve technology rather than traditional battlefield engagements. Cyber warfare, misinformation campaigns, satellite disruptions, and economic coercion are now standard tools of statecraft. A conflict may unfold in cyberspace, financial systems, or media narratives long before—or instead of—physical confrontation.
This shift has blurred the line between war and peace, making geopolitical risk more complex and harder to predict.
Geopolitics in a Multipolar World
The world is gradually moving from a unipolar or bipolar structure toward a multipolar one, where multiple centers of power coexist. This transition increases uncertainty, as rules and norms are contested and alliances become more fluid.
At the same time, global challenges such as climate change, pandemics, and technological disruption require cooperation, even among rival states. This creates a paradox where competition and interdependence exist simultaneously.
Conclusion
Geopolitical events and global conflicts are central forces shaping the 21st century. They influence international relations, economic stability, technological progress, and human security. While conflicts often appear sudden, they are usually the result of long-term structural tensions rooted in geography, power, and interests.
Understanding geopolitics does not mean predicting every conflict, but it helps individuals and institutions make sense of global developments and manage risk more effectively. In an increasingly interconnected world, geopolitical awareness is no longer optional—it is essential for informed decision-making, whether in policy, business, investment, or everyday life.
Forex (Currency) Market TrendsThe Foreign Exchange (Forex) market is the world’s largest and most liquid financial market, with daily trading volumes exceeding USD 7 trillion. Unlike stock markets, Forex operates 24 hours a day, five days a week, connecting major financial centers such as London, New York, Tokyo, and Sydney. Currency prices constantly fluctuate due to changes in economic conditions, interest rates, geopolitical events, and market sentiment. Understanding Forex market trends is essential for traders, investors, policymakers, and businesses involved in international trade.
What Are Forex Market Trends?
A Forex market trend refers to the general direction in which a currency pair moves over a certain period. Trends can be observed on any timeframe—minutes, hours, days, or even years—depending on the trading or investment horizon.
Forex trends are typically classified into three main types:
Uptrend – A currency pair forms higher highs and higher lows, indicating strengthening of the base currency.
Downtrend – A currency pair forms lower highs and lower lows, indicating weakening of the base currency.
Sideways (Range-bound) – Prices move within a defined range without a clear directional bias.
Identifying trends allows traders to align their strategies with market momentum rather than trading against it.
Major Drivers of Forex Market Trends
1. Interest Rates and Monetary Policy
Interest rates are the single most powerful driver of long-term currency trends. Central banks such as the US Federal Reserve, European Central Bank (ECB), Bank of England (BoE), and Bank of Japan (BoJ) influence currency values through monetary policy.
Higher interest rates attract foreign capital, strengthening the currency.
Lower interest rates reduce returns, weakening the currency.
For example, when the US Federal Reserve raises rates, the USD tends to appreciate, especially against currencies with lower yields like the Japanese Yen.
2. Economic Growth and Macroeconomic Data
Economic indicators shape expectations about a country’s future performance and influence currency demand. Key data includes:
GDP growth
Inflation (CPI, PPI)
Employment reports (Non-Farm Payrolls)
Manufacturing and services PMIs
Retail sales
Strong economic data usually supports a currency, while weak data leads to depreciation. Long-term Forex trends often mirror relative economic strength between two countries.
3. Inflation Trends
Inflation directly affects purchasing power and central bank policy decisions. Moderate inflation is healthy, but excessive inflation erodes currency value.
Rising inflation → Potential rate hikes → Currency appreciation
Falling inflation → Rate cuts → Currency depreciation
Forex traders closely monitor inflation trends because they often precede major policy shifts.
4. Geopolitical Events and Global Risk Sentiment
Geopolitical tensions, wars, trade disputes, elections, and sanctions can dramatically shift Forex trends.
In times of uncertainty, investors seek safe-haven currencies like USD, CHF, and JPY.
Risk-on environments favor higher-yielding and emerging market currencies.
For instance, during global crises, the US Dollar often strengthens due to its reserve currency status.
5. Trade Balances and Capital Flows
Countries with trade surpluses generally experience stronger currencies, while those with deficits may face depreciation.
Export-driven economies (Germany, China, Japan) benefit from strong global demand.
Capital inflows into equities and bonds also boost currency demand.
Sustained trade imbalances can create long-term structural Forex trends.
Types of Forex Market Trends by Time Horizon
Short-Term Trends
Short-term trends last from minutes to days and are influenced by:
Economic news releases
Central bank speeches
Market sentiment and speculation
Technical factors such as breakouts
Day traders and scalpers focus on these trends using technical indicators and price action.
Medium-Term Trends
Medium-term trends can last from weeks to months and are driven by:
Shifts in interest rate expectations
Economic cycles
Policy changes
Seasonal patterns
Swing traders often capitalize on these trends by combining technical analysis with macro fundamentals.
Long-Term Trends
Long-term Forex trends may last for years and reflect:
Structural economic differences
Long-term monetary policy divergence
Demographic and productivity changes
Global reserve currency dynamics
Examples include the multi-year strength of the USD during tightening cycles or prolonged weakness of currencies facing economic stagnation.
Technical Analysis and Forex Trends
Technical analysis plays a major role in identifying and confirming Forex trends. Common tools include:
Moving Averages (50, 100, 200 periods)
Trendlines and Channels
ADX (Average Directional Index) to measure trend strength
MACD for momentum confirmation
RSI for identifying trend continuation or exhaustion
Trend-following strategies such as moving average crossovers and breakout trading are widely used in Forex markets due to their strong trending nature.
Fundamental vs Sentiment-Driven Trends
Fundamental Trends
These are based on economic realities like growth, inflation, and interest rates. They tend to be slower but more sustainable.
Sentiment-Driven Trends
These emerge from market psychology, speculation, and positioning. They can move quickly but are often prone to sharp reversals.
Successful traders learn to distinguish between the two and avoid chasing sentiment-driven moves without confirmation.
Forex Trends in Emerging Markets
Emerging market currencies are influenced by:
Global liquidity conditions
Commodity prices
Political stability
Foreign investment flows
They tend to be more volatile and trend strongly during global risk-on or risk-off phases. For example, rising oil prices can strengthen commodity-linked currencies, while capital outflows can cause rapid depreciation.
Challenges in Trading Forex Trends
Despite their popularity, Forex trends are not always easy to trade. Common challenges include:
False breakouts
Sudden news-driven reversals
Central bank intervention
High leverage amplifying losses
Risk management, proper position sizing, and patience are essential when trading trends.
Conclusion
Forex market trends reflect the complex interaction of economic fundamentals, monetary policy, geopolitical forces, and market psychology. Understanding these trends helps traders align with dominant market forces instead of fighting them. While short-term price movements may appear random, sustained Forex trends often tell a deeper story about economic strength, policy direction, and global capital flows.
By combining trend analysis, technical tools, and fundamental insight, traders can better navigate the dynamic Forex market and make informed decisions. In a market that never sleeps, trend awareness is not just an advantage—it is a necessity.

Macroeconomic Indicators & Central Bank Policies1. What Are Macroeconomic Indicators?
Macroeconomic indicators are statistical data points that reflect the overall health and direction of an economy. Governments, central banks, and market participants use these indicators to assess economic performance, identify risks, and make policy or investment decisions.
These indicators are broadly classified into growth, inflation, employment, and external sector indicators.
2. Key Macroeconomic Indicators
a) Gross Domestic Product (GDP)
GDP measures the total value of goods and services produced in an economy over a specific period.
High GDP growth → economic expansion
Low or negative GDP growth → slowdown or recession
GDP can be measured using:
Production approach
Income approach
Expenditure approach
For markets, strong GDP growth often boosts equities, while weak growth increases expectations of monetary stimulus.
b) Inflation Indicators
Inflation reflects the rate at which prices rise over time.
Common inflation measures:
Consumer Price Index (CPI) – measures retail inflation
Wholesale Price Index (WPI) – measures wholesale price changes
Core Inflation – excludes food and fuel (more stable)
Moderate inflation is healthy, but high inflation reduces purchasing power, while very low inflation or deflation slows economic growth.
c) Employment & Labor Market Data
Employment indicators show the strength of the labor market.
Key metrics include:
Unemployment rate
Labor force participation rate
Job creation numbers
Wage growth
Low unemployment generally signals economic strength, but extremely tight labor markets can fuel inflation through rising wages.
d) Interest Rates
Interest rates represent the cost of borrowing money and are heavily influenced by central banks.
Low interest rates → encourage borrowing, spending, and investment
High interest rates → reduce inflation but slow growth
Interest rates directly impact stock markets, bond yields, real estate, and currencies.
e) Industrial Production & Manufacturing Data
Indicators such as:
Industrial Production Index (IPI)
Manufacturing PMI (Purchasing Managers’ Index)
These measure output and business activity in the manufacturing sector. PMI above 50 indicates expansion; below 50 indicates contraction.
f) External Sector Indicators
These reflect a country’s global economic position:
Trade balance
Current account deficit (CAD)
Foreign exchange reserves
Exchange rate
A stable currency and healthy forex reserves improve investor confidence and economic stability.
3. Role of Central Banks
A central bank is the monetary authority responsible for maintaining economic and financial stability. Examples include:
Reserve Bank of India (RBI)
US Federal Reserve (Fed)
European Central Bank (ECB)
The primary objectives of central banks are:
Price stability (control inflation)
Economic growth
Financial system stability
Currency stability
4. Central Bank Monetary Policy Tools
Central banks use monetary policy to control money supply and credit conditions.
a) Policy Interest Rates
These are benchmark rates that influence all other interest rates.
Examples:
Repo Rate (India)
Federal Funds Rate (USA)
Rate cut → stimulates growth
Rate hike → controls inflation
b) Open Market Operations (OMO)
Central banks buy or sell government securities:
Buying bonds → injects liquidity
Selling bonds → absorbs liquidity
OMOs help manage short-term liquidity in the banking system.
c) Cash Reserve Ratio (CRR)
CRR is the portion of deposits banks must keep with the central bank.
Higher CRR → less money for lending
Lower CRR → more liquidity
d) Statutory Liquidity Ratio (SLR)
SLR requires banks to hold a portion of deposits in safe assets like government bonds. It influences credit availability and banking stability.
e) Quantitative Easing (QE) & Tightening (QT)
QE: Central bank injects liquidity by purchasing assets during crises
QT: Withdrawal of excess liquidity when inflation is high
QE is often used during recessions or financial crises.
5. How Central Bank Policies Affect the Economy
a) Inflation Control
When inflation rises above target levels, central banks:
Increase interest rates
Reduce liquidity
Discourage excessive borrowing
When inflation is low, they do the opposite to boost demand.
b) Economic Growth
Loose monetary policy:
Encourages consumption
Boosts business investment
Supports stock markets
Tight monetary policy:
Slows growth
Reduces speculative bubbles
Stabilizes the economy
c) Impact on Financial Markets
Equity Markets: Prefer low interest rates
Bond Markets: Prices fall when rates rise
Currency Markets: Higher rates attract foreign capital
Commodity Markets: Inflation and liquidity influence prices
Market volatility often increases around central bank policy announcements.
6. Transmission Mechanism of Monetary Policy
The transmission mechanism explains how policy changes affect the real economy:
Policy rate change
Bank lending rates adjust
Borrowing & spending behavior changes
Investment & consumption respond
Inflation and growth adjust
This process takes time and varies across economies.
7. Coordination with Fiscal Policy
Fiscal policy (government spending and taxation) works alongside monetary policy.
Expansionary fiscal + loose monetary policy → strong stimulus
Tight fiscal + tight monetary policy → economic slowdown
Effective coordination ensures macroeconomic stability.
8. Challenges Faced by Central Banks
Balancing inflation control and growth
Managing global shocks (oil prices, wars, pandemics)
Controlling asset bubbles
Maintaining policy credibility
Dealing with time lags in policy impact
Central banks must make decisions based on imperfect and evolving data.
9. Importance for Traders and Investors
For traders and investors:
Macroeconomic data releases create volatility
Interest rate cycles define long-term market trends
Central bank guidance (forward guidance) influences expectations
Currency and bond markets react first to policy changes
Successful market participants track macro indicators alongside technical and fundamental analysis.
Conclusion
Macroeconomic indicators provide a snapshot of economic health, while central bank policies act as the control system guiding growth, inflation, and financial stability. Together, they influence interest rates, currency values, business cycles, and asset prices. Understanding this relationship is essential for policymakers, investors, and traders alike, as it helps anticipate economic trends and make informed decisions in an interconnected global economy.

Indicators & Oscillators (Technical Analysis) – Complete GuideIntroduction
In technical analysis, Indicators and Oscillators are mathematical tools derived from price, volume, or open interest data. Traders use them to analyze market behavior, identify trends, measure momentum, spot reversals, and improve trade timing.
While price action shows what the market is doing, indicators help explain how strong, how fast, and how sustainable that move is. They do not predict the future but increase probability when used correctly with price structure and risk management.
What Are Indicators?
Indicators are tools that follow price and help traders understand market direction, strength, and trend continuation.
Key Characteristics of Indicators
Usually trend-following
Work best in trending markets
Often lag price (because they are calculated from past data)
Help with trend identification and confirmation
What Are Oscillators?
Oscillators are indicators that move between fixed ranges (usually 0–100 or -100 to +100). They are mainly used to identify overbought and oversold conditions.
Key Characteristics of Oscillators
Work best in range-bound or sideways markets
Help identify potential reversals
Can give early signals but also produce false signals in strong trends
Difference Between Indicators and Oscillators
Aspect Indicators Oscillators
Market Type Trending Sideways / Range
Purpose Trend confirmation Reversal & momentum
Nature Lagging Leading or coincident
Examples Moving Average, ADX RSI, Stochastic
Commonly Used Trend Indicators
1. Moving Averages (MA)
Moving averages smooth price data to identify trend direction.
Types
Simple Moving Average (SMA)
Exponential Moving Average (EMA)
Usage
Price above MA → Uptrend
Price below MA → Downtrend
MA crossover → Trend change signal
Popular Periods
20 EMA – short-term
50 EMA – medium-term
200 EMA – long-term trend
2. Moving Average Convergence Divergence (MACD)
MACD measures the relationship between two EMAs.
Components
MACD Line
Signal Line
Histogram
Signals
MACD crossover → Buy/Sell
Histogram expansion → Momentum strength
Divergence → Possible reversal
3. Average Directional Index (ADX)
ADX measures trend strength, not direction.
Interpretation
ADX below 20 → Weak or no trend
ADX above 25 → Strong trend
ADX above 40 → Very strong trend
Used with +DI and -DI to identify direction.
4. Parabolic SAR
Used to determine trend direction and trailing stop loss.
Usage
Dots below price → Uptrend
Dots above price → Downtrend
Dot flip → Trend reversal
Best in strong trends, weak in sideways markets.
Popular Oscillators
1. Relative Strength Index (RSI)
RSI measures momentum and overbought/oversold conditions.
Range: 0–100
Key Levels
Above 70 → Overbought
Below 30 → Oversold
50 → Trend strength level
Advanced Usage
RSI above 60 = bullish trend
RSI below 40 = bearish trend
RSI divergence → Reversal signal
2. Stochastic Oscillator
Compares closing price with price range over a period.
Range: 0–100
Key Levels
Above 80 → Overbought
Below 20 → Oversold
Signals
%K and %D crossover
Divergence with price
Works best in range-bound markets.
3. Commodity Channel Index (CCI)
Measures price deviation from average price.
Range: No fixed limit
Levels
Above +100 → Strong bullish momentum
Below -100 → Strong bearish momentum
Used for early trend and reversal signals.
4. Williams %R
Similar to Stochastic but inverted.
Range: -100 to 0
Above -20 → Overbought
Below -80 → Oversold
Useful for short-term trading and scalping.
Volume-Based Indicators
1. On-Balance Volume (OBV)
Measures buying and selling pressure using volume.
Concept
Rising OBV → Accumulation
Falling OBV → Distribution
Volume leads price; OBV helps confirm breakouts.
2. Volume Oscillator
Shows difference between short-term and long-term volume averages.
Helps identify breakout strength and fake moves.
Momentum Indicators
1. Rate of Change (ROC)
Measures speed of price movement.
Positive ROC → Bullish momentum
Negative ROC → Bearish momentum
Used for momentum-based entries.
2. Momentum Indicator
Simple calculation of price change over time.
Good for spotting trend acceleration and exhaustion.
Divergence – A Powerful Concept
Divergence occurs when price and indicator move in opposite directions.
Types of Divergence
Bullish Divergence: Price makes lower low, indicator makes higher low
Bearish Divergence: Price makes higher high, indicator makes lower high
Divergence often signals trend exhaustion or reversal, especially near support/resistance zones.
How to Use Indicators Effectively
Best Practices
Never use too many indicators
Combine one trend indicator + one oscillator
Confirm signals with price action
Always use stop loss
Understand market context (trend vs range)
Common Mistakes
Blindly following signals
Using oscillators in strong trends
Ignoring risk management
Over-optimization
Ideal Indicator Combinations
EMA + RSI
MACD + Support/Resistance
ADX + Moving Average
RSI + Divergence + Price Action
Conclusion
Indicators and Oscillators are decision-support tools, not decision-makers. They help traders understand trend direction, momentum strength, market conditions, and potential reversals. When combined with price action, volume, and risk management, they significantly improve trading accuracy.
Successful traders focus on simplicity, consistency, and discipline, not on finding the “perfect” indicator. Master a few tools, understand their behavior in different market conditions, and apply them with patience.

RAYMONDLSLRAYMONDLSL
bullish trend is Showing on the chart.
buy signals in
technical indicators and
descending triangle chart pattern.

Fundamental Analysis (FA): A Complete GuideFundamental Analysis (FA) is a method of evaluating the intrinsic value of a financial asset—such as a stock, bond, or company—by analyzing economic, financial, qualitative, and quantitative factors. The goal is to determine whether an asset is undervalued, overvalued, or fairly valued compared to its current market price. Unlike technical analysis, which focuses on price and volume patterns, fundamental analysis looks at what the asset is actually worth.
Fundamental analysis is widely used by long-term investors, value investors, and institutions to make informed investment decisions.
Core Objective of Fundamental Analysis
The primary objective of fundamental analysis is to answer three key questions:
Is the company financially strong?
Is the business model sustainable and scalable?
Is the current market price justified by fundamentals?
If the intrinsic value of a stock is higher than its market price, it may be considered a buying opportunity. If it is lower, the stock may be overvalued.
Three Pillars of Fundamental Analysis
Fundamental analysis is generally divided into three main components:
1. Economic Analysis
2. Industry Analysis
3. Company Analysis
Together, these help investors understand the broader environment and the specific business performance.
1. Economic Analysis
Economic analysis evaluates the macro-economic environment in which companies operate. Since businesses are influenced by economic conditions, understanding the economy helps predict future growth or risks.
Key economic factors include:
GDP Growth Rate – Indicates overall economic health
Inflation Rate – Affects purchasing power and costs
Interest Rates – Impacts borrowing, spending, and valuations
Fiscal & Monetary Policies – Government and central bank actions
Exchange Rates – Crucial for export-oriented companies
Employment Data – Reflects consumer spending capacity
For example, low interest rates generally support equity markets by reducing borrowing costs and increasing investment, while high inflation may pressure company margins.
2. Industry Analysis
Industry analysis focuses on the sector or industry in which a company operates. Even a well-managed company may struggle if its industry is declining.
Important aspects of industry analysis include:
a) Industry Growth Rate
Fast-growing industries (technology, renewables) attract higher valuations
Mature industries (cement, utilities) offer stable but slower growth
b) Competitive Structure
Monopoly or oligopoly industries enjoy pricing power
Highly competitive industries face margin pressure
c) Regulatory Environment
Government policies can help or hurt industries (banking, pharma, telecom)
d) Demand-Supply Dynamics
Oversupply leads to price wars
Strong demand supports profitability
e) Entry Barriers
High entry barriers protect existing players (capital, patents, brand)
Understanding industry trends helps investors avoid structurally weak sectors and focus on future-ready businesses.
3. Company Analysis
Company analysis is the heart of fundamental analysis. It examines a company’s financial performance, management quality, business model, and future prospects.
A. Financial Statement Analysis
The three primary financial statements are:
1. Income Statement
Shows profitability over a period.
Key metrics:
Revenue (Sales)
Operating Profit
Net Profit
Earnings Per Share (EPS)
Profit Margins
Consistent revenue and profit growth indicate a healthy business.
2. Balance Sheet
Shows the company’s financial position at a specific time.
Key elements:
Assets
Liabilities
Shareholders’ Equity
Debt Levels
A strong balance sheet typically has low debt and high equity.
3. Cash Flow Statement
Tracks actual cash movement.
Types of cash flows:
Operating Cash Flow
Investing Cash Flow
Financing Cash Flow
Positive operating cash flow is crucial—it shows the business generates real cash, not just accounting profits.
B. Key Financial Ratios
Ratios simplify financial analysis and allow comparison across companies.
Profitability Ratios
Return on Equity (ROE)
Return on Capital Employed (ROCE)
Net Profit Margin
Valuation Ratios
Price to Earnings (P/E)
Price to Book (P/B)
Price to Sales (P/S)
Liquidity Ratios
Current Ratio
Quick Ratio
Leverage Ratios
Debt-to-Equity
Interest Coverage Ratio
High profitability, reasonable valuation, and manageable debt are signs of a strong company.
C. Qualitative Analysis
Numbers alone are not enough. Qualitative factors play a critical role.
1. Business Model
How does the company make money?
Is it scalable and sustainable?
2. Management Quality
Integrity and transparency
Capital allocation skills
Track record and vision
3. Competitive Advantage (Moat)
Brand strength
Cost leadership
Technology or patents
Distribution network
4. Corporate Governance
Promoter holding
Related party transactions
Auditor credibility
Strong governance builds investor trust and long-term value.
Valuation in Fundamental Analysis
After analyzing the business, investors estimate its intrinsic value using valuation models such as:
Discounted Cash Flow (DCF)
Dividend Discount Model (DDM)
Relative Valuation (peer comparison)
The difference between intrinsic value and market price is called the margin of safety, a key concept popularized by Benjamin Graham.
Advantages of Fundamental Analysis
Ideal for long-term investing
Helps identify undervalued stocks
Focuses on business strength
Reduces emotional decision-making
Works well for wealth creation
Limitations of Fundamental Analysis
Time-consuming and data-intensive
Not suitable for short-term trading
Market may remain irrational longer than expected
Requires assumptions that may change
External shocks can disrupt fundamentals
Fundamental Analysis vs Technical Analysis
Fundamental Analysis Technical Analysis
Focuses on value Focuses on price
Long-term approach Short-term approach
Based on financials Based on charts
Answers “what to buy” Answers “when to buy”
Many successful investors combine both for better decision-making.
Conclusion
Fundamental analysis is a powerful framework for understanding the true value of an asset. By analyzing economic conditions, industry dynamics, and company-specific factors, investors can make informed, rational, and disciplined investment decisions. While it requires patience and continuous learning, fundamental analysis remains the backbone of long-term investing and wealth creation.

Market Structure & Types of MarketsWhat Is Market Structure?
Market structure refers to the overall organization and behavior of a market. It explains how prices are formed, how trades occur, who participates, and how efficiently information is reflected in prices. Market structure influences liquidity, volatility, transaction costs, and transparency.
In financial markets, market structure is shaped by:
Number of buyers and sellers
Degree of competition
Availability of information
Entry and exit barriers
Trading mechanisms and regulations
Understanding market structure is especially important for traders because price movements, trends, and reversals are directly influenced by it.
Key Elements of Market Structure
1. Price Discovery
Price discovery is the process by which market prices are determined based on supply and demand. Efficient markets quickly reflect new information such as earnings, economic data, or geopolitical events.
2. Liquidity
Liquidity refers to how easily an asset can be bought or sold without significantly affecting its price. High liquidity means tighter bid-ask spreads and smoother price movements.
3. Volatility
Volatility measures the degree of price fluctuations. Certain market structures encourage stability, while others allow sharp price swings.
4. Transparency
Transparency indicates how easily participants can access information related to prices, volumes, and orders.
Types of Market Structure (Based on Competition)
1. Perfect Competition
In a perfectly competitive market:
There are many buyers and sellers
No single participant can influence prices
Products are homogeneous
Information is freely available
Although perfect competition is rare in financial markets, highly liquid markets like major forex pairs (EUR/USD) come close to this structure.
2. Monopoly
A monopoly exists when:
There is only one seller
High entry barriers exist
The seller controls pricing
In financial markets, pure monopolies are uncommon, but some exchanges or clearing corporations may show monopolistic characteristics due to regulatory control.
3. Oligopoly
An oligopoly involves:
A few dominant participants
High entry barriers
Interdependence among players
Investment banking, credit rating agencies, and large institutional trading often reflect oligopolistic structures.
4. Monopolistic Competition
This structure has:
Many sellers
Differentiated products
Moderate competition
Mutual funds, portfolio management services, and financial advisory firms operate under monopolistic competition.
Types of Markets (Based on Function)
1. Capital Market
The capital market deals with long-term funds and securities. It is divided into:
a) Primary Market
New securities are issued
Companies raise capital through IPOs, FPOs
Investors buy directly from issuers
b) Secondary Market
Existing securities are traded
Includes stock exchanges like NSE and BSE
Provides liquidity and price discovery
2. Money Market
The money market deals with short-term funds (up to one year).
Instruments include:
Treasury bills
Commercial papers
Certificates of deposit
Call money
Money markets are used by banks, financial institutions, and governments to manage short-term liquidity.
3. Derivatives Market
The derivatives market trades instruments whose value is derived from an underlying asset such as stocks, indices, commodities, or currencies.
Common derivatives include:
Futures
Options
Swaps
This market is widely used for hedging, speculation, and arbitrage.
4. Commodity Market
Commodity markets facilitate trading in physical goods like:
Gold, silver
Crude oil, natural gas
Agricultural products
They help producers and consumers manage price risk and ensure efficient allocation of resources.
5. Forex (Currency) Market
The forex market enables trading of currencies.
Key features:
Largest financial market in the world
Operates 24 hours
Highly liquid and decentralized
It plays a vital role in international trade and capital flows.
Types of Markets (Based on Market Conditions)
1. Bull Market
A bull market is characterized by:
Rising prices
Strong investor confidence
Economic growth
Investors focus on buying opportunities, trend-following strategies, and long-term investments.
2. Bear Market
A bear market shows:
Falling prices
Pessimism and fear
Weak economic indicators
Traders prefer short selling, defensive stocks, and capital preservation strategies.
3. Sideways or Range-Bound Market
In this market:
Prices move within a fixed range
No clear trend
Low volatility
Range trading, options strategies, and mean-reversion approaches work best here.
4. Volatile Market
A volatile market experiences:
Sharp price swings
High uncertainty
News-driven movements
Risk management becomes crucial, and position sizing plays a major role.
Types of Markets (Based on Trading Mechanism)
1. Exchange-Traded Market
Trades occur on regulated exchanges
Transparent pricing
Standardized contracts
Examples: NSE, BSE, CME
2. Over-the-Counter (OTC) Market
Trades occur directly between parties
Customized contracts
Less transparency
Forex forwards and interest rate swaps are common OTC instruments.
Importance of Understanding Market Structure
Understanding market structure helps:
Traders choose appropriate strategies
Investors manage risk effectively
Policymakers regulate markets efficiently
Institutions ensure fair and orderly trading
Market structure also determines how quickly information is reflected in prices, which directly affects profitability.
Conclusion
Market structure and types of markets form the foundation of financial systems. From capital markets and money markets to derivatives and forex, each market serves a unique purpose. Market structure defines how participants interact, how prices are discovered, and how efficiently markets function.
For traders and investors, understanding market structure is not optional—it is essential. It helps in selecting the right instruments, timing entries and exits, managing risk, and adapting strategies to different market conditions. A strong grasp of these concepts leads to better decision-making and long-term success in financial markets.

EUR/USDEURUSD experienced a clean intraday sell-side liquidity sweep, breaking below the prior range low with strong bearish displacement, signaling a stop-driven move rather than organic trend continuation.
Price tagged the lower liquidity pool, printed a sharp rejection wick, and immediately delivered a V-shaped reaction, indicating short-term exhaustion and responsive buying at discount.
Market Structure Read
Range low taken with momentum expansion
Stops flushed, creating temporary price inefficiency
Immediate bullish reaction suggests sell pressure is weakening, not building
Current Zone Logic
Price is reacting from a deep discount zone, where short-term participants are covering and early longs are stepping in
The marked green box represents a mean-reversion / mitigation zone, not a trend-reversal confirmation yet

XAUUSD/GOLD PMI NEWS FORECAST 02.02.26XAUUSD / GOLD – ISM Manufacturing PMI Trade Plan
Date: 02-02-2026
Hello traders,
Welcome back to Tamil Trading Education.
Today we are analyzing XAUUSD (Gold) based on the ISM Manufacturing PMI news.
This is a news-based breakout and retest strategy, so please avoid emotional or early entries.
🔑 Key Levels Marked on the Chart
Resistance R2 – Major upside target
Resistance R1 – Breakout decision zone
Support S1 – First downside confirmation
Support S2 – Major bearish target
We will trade only after confirmation.
📈 Scenario 1: ISM PMI is NEGATIVE (Bullish for Gold)
If the ISM Manufacturing PMI comes out negative:
Gold is expected to move upward
Wait for a clear breakout above Resistance R1
After breakout, wait for a proper retest
👉 BUY Entry:
Enter BUY only after breakout and retest confirmation
🎯 Targets:
First target near Resistance R

SINDHUTRAD || Elliott Wave AnalysisWave 1 (Impulse): From 13.04 → 39.29, completed with 5 clear sub-waves.
Wave 2 (Correction): ABC structure from 39.29 → 17.64, perfectly aligning with the 0.786 Fibonacci retracement of Wave 1.
Wave 3 (Impulse): Now in progress, signaling the next major upward move.
✅ Trendline Breakout: Price has broken the descending trendline, confirming a shift in structure and signaling the start of a new uptrend.
Trade Plan:
- 📈 Long Entry: 20.00
- 🛡️ Stoploss: 17.64
- 🎯 Target 1: 43.89
- 🎯 Target 2: 60.11
DISCLAIMER: This is purely an observation and should not be considered a trade recommendation. Kindly conduct your own analysis before making any trading decisions.

BTCUSD Near Demand Zone as Selling Pressure ContinuesBTCUSD is trading with a clear bearish structure after a strong downward move. The price has been forming lower highs and lower lows, showing that selling pressure is still present in the market. Earlier pullbacks failed near the resistance area of 89,500–90,200, where sellers became active again. This zone remains an important resistance and is limiting upside movement for now.
On the downside, price has reached a major demand zone around 80,800–81,400. This level has shown strong buyer interest in the past and is acting as an important support area. The current reaction from this zone suggests that downside momentum is slowing, and the market may move into short-term consolidation. As long as price holds above this demand, a corrective move on the upside remains possible.
At present, BTCUSD is stabilising near support, indicating a pause after strong selling. Minor upside moves may face resistance near previous reaction zones. If price breaks and holds below the demand area, it would strengthen the bearish view and open the way for further downside. Overall, the market bias stays bearish while price remains below key resistance levels.

platinum to the 4000 if supported at 2030-2100platinum to the 4000 if supported at 2030-2100 based on fibonacci levels

gold support at 4550-4600 for the target of 6200-6500gold should take support around 4550-4600 as per fibonacci and then if it consolidates at this level then potential next target is 6200-6500

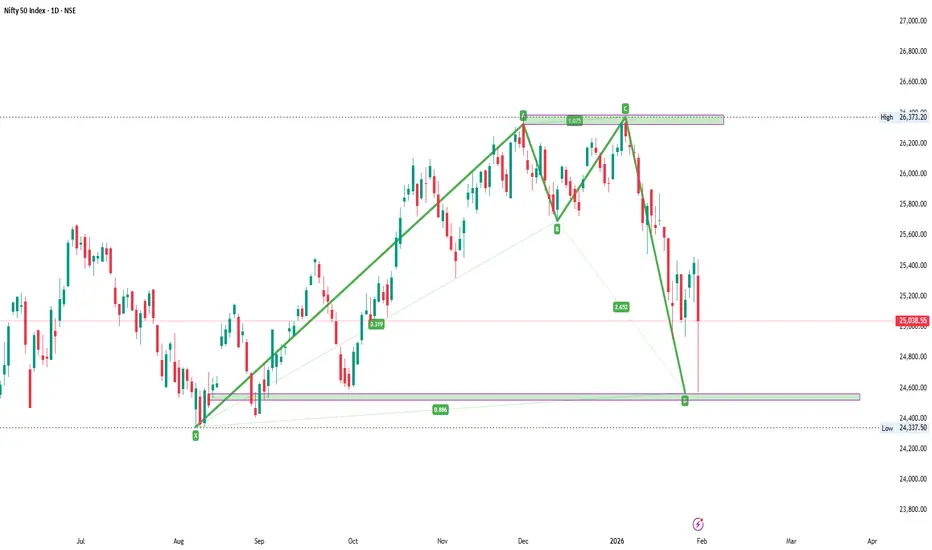
NIFTY- Intraday Levels - 2nd Feb 2026If NIFTY sustain above 25778 then above this bullish then 24971/92 then 25022/37 then again a strong range 25087/114 or 25174 above this more bullish then above this wait more levels marked on chart
If NIFTY sustain below 24732 below this bearish then around 24682/52 below this more bearish then 24511/487 very strong level 24405/381 or 24340/28 this is extremely strong range as this was the low made on 8th Aug 2025 and gave a rally of 8+%. Unless it opens below this or breakes with big candle it will not be easy for market to go below this, below this more bearish below this wait
Consider some buffer points in above levels.
Please do your due diligence before trading or investment.
**Disclaimer -
I am not a SEBI registered analyst or advisor. I does not represent or endorse the accuracy or reliability of any information, conversation, or content. Stock trading is inherently risky and the users agree to assume complete and full responsibility for the outcomes of all trading decisions that they make, including but not limited to loss of capital. None of these communications should be construed as an offer to buy or sell securities, nor advice to do so. The users understands and acknowledges that there is a very high risk involved in trading securities. By using this information, the user agrees that use of this information is entirely at their own risk.
Thank you.

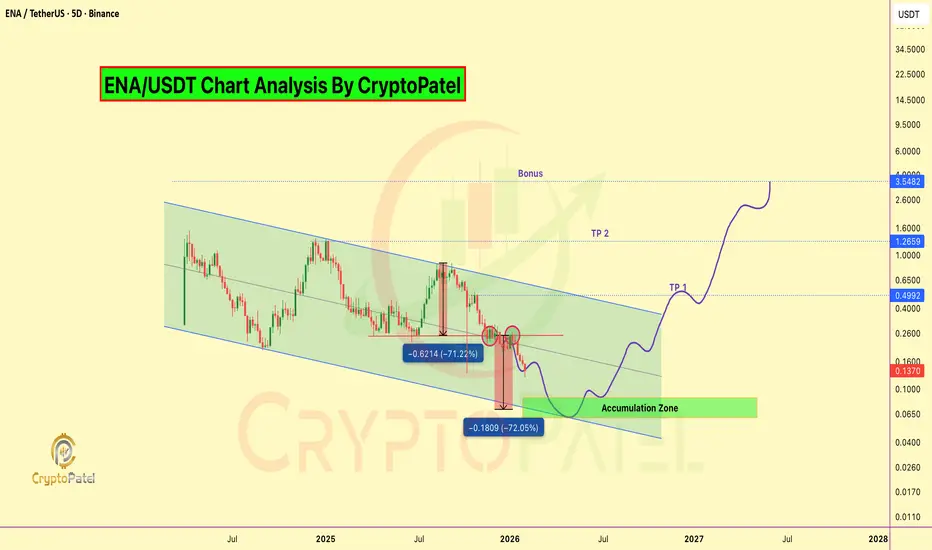
$100M Private Sale at $0.40... Now CMP Trading at $0.135$100M Private Sale at $0.40... Now Retail Can Buy at $0.135. First Time Retail Gets Better Entry Than VC
#ENA Is Trading Inside A Long-Term Descending Channel On The HTF Chart Since 2024.
Price Has Completed A Deep Multi-Leg Correction And Is Now Testing A Major Demand Zone At Channel Support.
Current Technical Structure:
✅ Descending Channel Intact
✅ ~92% Down From ATH
✅ Price Near Lower Channel Support
✅ Strong Accumulation Zone: $0.08–$0.06
✅ H&S Bearish Target For Long Term Accumulation is $0.07
✅ ~66% Below Private Investor Price (VC Discount Zone)
✅ Trump's World Liberty Financial Bought ~$5.15M ENA At ~$0.891 (Now ~$0.135 → ~85% Drawdown / ~$4.37M Unrealized Loss)
CryptoPatel Targets: $0.50 / $1.26 / Bonus $3+
As Long As ENA/USDT Holds Above The Accumulation Zone, A Relief Rally And Trend Reversal Remain Probable.
Why It Could Pump
✅ EURONEXT:USDE is now 3rd Largest Stablecoin ($5.8B)
✅ Fee Switch Coming Q1 2026 - stakers Get Protocol Revenue
✅ Building Own Blockchain
✅ Institutional Product (iUSDe) Launching Soon
✅ Major TradFi Backing
⚠️ Risks to Watch
❌ Heavy token unlocks until 2028
❌ Down 85% from ATH
❌ Similar model concerns to Terra/Luna
❌ Depends on positive funding rates
Invalidation & Risk Note: This is a high-risk, high-reward setup with elevated volatility. Strict risk management is essential.
TA Only. Not Financial Advice. ALWAYS DYOR.
Silver crash at a glanceSilver after hitting 420 is trading at 265 almost 155L down just in 2 sessions a sustainable candle below 250 can create more pressure towards downside let's see if this is a bubble burst or just accumulation

XAUUSD/GOLD WEEKLY SELL PROJECTION 01.02.26“This is the weekly sell projection for Gold, XAUUSD.
Price has reached a major resistance zone and shows clear selling momentum.
An evening star pattern is formed at the top, which indicates a potential trend reversal.
The market has broken the previous support and is now retesting the broken zone.
This area also aligns with the 50% Fibonacci retracement, making it a strong sell zone.
As long as price stays below this resistance, the bearish bias remains valid.
Downside targets are the next support levels, Support S1 and Support S2.
Risk management is very important.
Always use proper stop loss and trade with confirmation.
This is a technical analysis, not financial advice.
Trade smart, stay disciplined, and protect your capital.”
