Hindustan Copper Limited - Breakout Setup, Move is ON...#HINDCOPPER trading above Resistance of 602
Next Resistance is at 896
Support is at 458
Here are previous charts:
Chart is self explanatory. Levels of breakout, possible up-moves (where stock may find resistances) and support (close below which, setup will be invalidated) are clearly defined.
Disclaimer: This is for demonstration and educational purpose only. This is not buying or selling recommendations. I am not SEBI registered. Please consult your financial advisor before taking any trade.
Harmonic Patterns

Part 2 Intraday Institutional TradingOption Trading: Terms and Conditions
- Strike Price: Price at which option can be exercised.
- Expiry Date: Last day option can be exercised.
- Premium: Price paid for option.
- Lot Size: Number of shares/contracts per lot.
- Margin: Required for selling options.
- Exercise: Buyer chooses to buy/sell underlying asset.
- Assignment: Seller obligated to buy/sell if option exercised.

Part 1 Intraday Institutional Trading Who Should Trade Options?
People who:
- Understand options and risks.
- Have experience trading stocks/derivatives.
- Want to hedge existing positions.
- Are comfortable with potential losses.
Not suitable for:
- Beginners without knowledge.
- Risk-averse investors.

Part 5 Advance Trading Strategies Option Trading: Risks and BenefitsBenefits- Leverage: Control bigger positions with smaller capital.
- Limited Risk: Option buyers risk only the premium paid.
- Flexibility: Strategies for bullish, bearish, or neutral markets.
- Hedging: Protect portfolios with options.
Risks- Time Decay: Options lose value as expiry approaches.
- Volatility Risk: Options sensitive to changes in volatility.
- Loss of Premium: Buyers risk losing entire premium if wrong.
- Complexity: Strategies can be complex, require understanding.

JAMNAAUTO 1 Day Time Frame • Last close: ~₹124 – ₹124.36 on NSE/BSE.
• Recent daily range: Low ~₹116.60 – High ~₹126.55.
📊 Daily Support & Resistance Levels (Key Zones)
Pivot Point (Daily)
Daily Pivot ~ ₹120 – ₹123.55: Key reference for intraday bias — above is bullish, below is bearish.
Resistance Levels
R1: ~ ₹125–₹125.32 – first hurdle above pivot.
R2: ~ ₹128–₹128.38 – stronger resistance near recent swing highs.
R3: ~ ₹130–₹130.15 – extended upside pivot.
Support Levels
S1: ~ ₹120 – ₹120.49 – first support near pivot/MA levels.
S2: ~ ₹118.5 – ₹118.72 – next layer of downside support.
S3: ~ ₹115.5 – ₹115.66 – deeper support zone.
These pivot-derived levels are commonly used for intraday and next-day trading reference.
📈 What Technical Indicators Suggest (Daily)
Moving Averages / Momentum
Short-term MAs around 20–50 DMA are near the pivot zone, indicating mixed momentum around the current price.
On some technical panels, oscillators like RSI may be neutral or slightly bearish/bullish depending on the source — indicating no strong momentum bias right now.
🧠 How to Use This for a 1-Day View
Bullish Bias (short-term) if:
✔ Price sustains above daily pivot (~₹122–123)
✔ Break of R2 (~₹128–₹128.4) with volume
Bearish / Caution if:
❌ Price closes below S1 (~₹120)
❌ Momentum indicators turn down from resistance
⚠️ Risk & Notes
These levels are technical guides — not investment advice.
Price can gap on news earnings, market sentiment, or sector moves.
Always combine with your own risk management (stop-loss, position sizing).

INFIBEAM 1 Week Time Frame 📌 Current Price Snapshot
📍 Latest traded price: ₹16.25 – ₹16.30 approx. (last session)
📈 52-week range: ₹13.63 (low) – ₹22.02 (high)
📊 Near-Term 1-Week Technical Levels
🔰 Pivot Point (Reference)
Pivot: ~₹15.6 – ₹15.7 (neutral zone for short-term bias)
🛑 Resistance (Upside Targets)
These are levels where price may face selling pressure this week:
Level Mark (Approx) Notes
R1 ~₹15.8 – ₹16.0 First hurdle near current action zone
R2 ₹16.3 – ₹16.4 Key near-term resistance — breakout above this could add momentum
R3 ₹16.8 – ₹17.0 Next upside target if buyers remain strong
👉 A decisive daily close above ~₹16.4–₹16.5 can open the door toward ₹17.0+ in the week.
🧱 Support (Downside Floors)
These are levels where dips may find buyers this week:
Level Mark (Approx) Notes
S1 ₹15.3 – ₹15.4 First strong support — psychologically key pivot band
S2 ₹15.0 – ₹15.1 Next cushion below if the market weakens
S3 ₹14.8 – ₹14.7 Deeper support zone if selling accelerates
👉 A breakdown below ~₹15.0 would increase bearish pressure for the week.
📈 Short-Term Bias Interpretation
Bullish scenario:
If price holds above ₹15.6–₹15.7 pivot and breaks ₹16.3–₹16.4, the next near-term move could be toward ₹16.8–₹17.0+.
Neutral / range-bound:
Between ₹15.3 and ₹16.3, expect consolidation/trading range.
Bearish scenario:
Sustained trading below ₹15.3 risks weakening into ₹15.0 and lower.
🧠 Quick Trading Guide (1-Week)
📍 Watch for reaction at:
✔ Above ₹16.3–₹16.4 = possible upside extens ion
✔ Below ₹15.3 = risk of deeper pullback
📊 Trend cues: Recent technical indicators show mixed momentum — short-term range with pickup if buyers assert near pivot area.

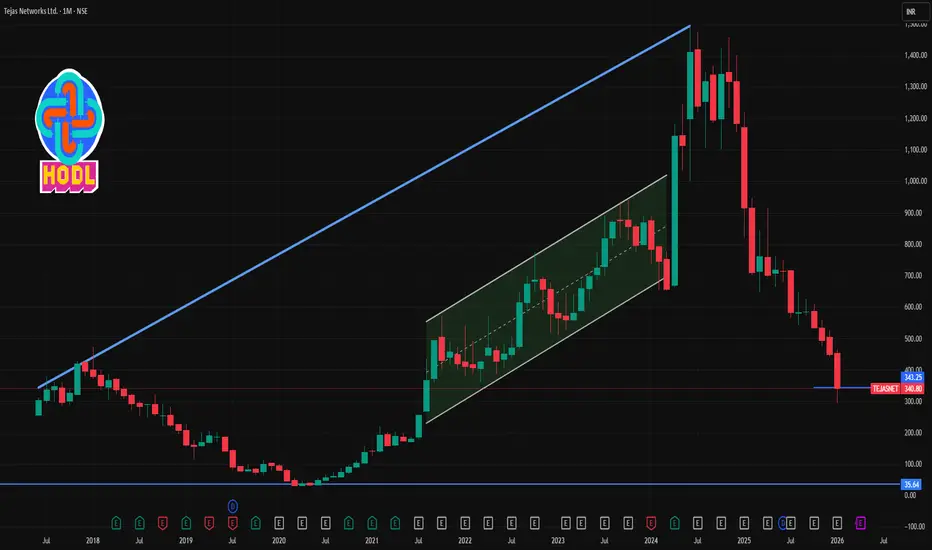
TEJASNET 1 Month Time Frame 📊 Current Price Snapshot (Approx)
Last traded price ~ ₹330-₹345 on NSE/BSE during late Jan 2026, after recent volatility and sell-offs.
📉 1-Month Timeframe — Key Levels
🔻 Support Levels (Downside)
These are levels where the stock could find buyers or pause losses on a 1-month chart:
Support Zone Significance
₹320 – ₹325 Immediate support; recent intraday floor (current price region)
₹301 – ₹315 Secondary support zone from pivot breakdowns
₹285 – ₹300 Deeper support if broader bearish momentum continues
📈 Resistance Levels (Upside)
Resistance Zone Importance
₹355 – ₹360 1st resistance from short-term moving average relevance
₹370 – ₹375 Next resistance cluster near recent intraday reactions
₹390 – ₹395 Higher resistance if bounce gains strength
🧠 Technical Indicator Context (1-Month)
📉 Trend Bias: Bearish overall, price trading significantly below major moving averages (20-day, 50-day, etc.).
📊 RSI: Near oversold but not confirmed bottom — suggests bearish momentum but potential for short-term rebounds.
📉 MACD & STOCH: Bearish signals persist, indicating weak price action on the 1-month chart.
🗂 Summary — 1-Month View
⚠️ Bearish Bias: The stock is in a short-term downtrend, trading below key moving averages and suffering weak momentum.
🛑 Support in Focus: ₹320-₹315 first; further deeper zone near ₹285-₹300 if bears intensify.
📈 Resistance Roadblock: ₹355-₹360 key for initial bounce; stronger rally needs break above ₹370+.
📉 Bearish Technicals: RSI not strongly indicating reversal yet; MACD remains bearish.
AXISBANK 1 Week Time Frame 📊 Current Context (As of 30 Jan 2026)
Last Close: ~₹1,370 – ₹1,378 range.
Recently traded near a 52-week high.
📈 Weekly Resistance Levels
These resistances act as potential upside barriers for the coming week:
R1: ~₹1,317 – ₹1,320 — first resistance zone.
R2: ~₹1,341 – ₹1,342 — next upside.
R3: ~₹1,370+ — major resistance breakout level.
➡️ Bullish scenario: A weekly close above ~₹1,317–₹1,320 increases chances of move toward ₹1,340+ / ₹1,370+.
📉 Weekly Support Levels
Support levels where price may find buying interest if it pulls back:
S1: ~₹1,262 – ₹1,265 — near-term support.
S2: ~₹1,230 — mid-range support.
S3: ~₹1,206 — broader downside buffer.
➡️ Bearish scenario: If the stock closes below ~₹1,262–₹1,265, further downside toward ₹1,230 → ₹1,206 could be possible.
📅 Likely Weekly Trading Range
Neutral / range-bound view:
₹1,262 – ₹1,320 — price may oscillate here unless a strong breakout/breakdown occurs.
📌 Quick Summary
Bullish break levels: above ₹1,317–₹1,320
Immediate upside resistances: ₹1,341 / ₹1,370+
Downside supports: ₹1,262 → ₹1,230 → ₹1,206

Candle Patterns Basics of a Candlestick
Each candlestick represents price movement for a specific time period (1 minute, 1 day, 1 week, etc.). A candlestick has four key components:
Open – Price at the beginning of the period
Close – Price at the end of the period
High – Highest price during the period
Low – Lowest price during the period

Part 3 Technical Vs. Institutional Option TradingBasic Option Trading Strategies- Long Call: Bet on price ↑, buy call option.
- Long Put: Bet on price ↓, buy put option.
- Covered Call: Sell call on stock you own, earn income.
- Protective Put: Buy put on stock you own, limit losses.

Part 2 Technical Vs. Institutional Option Trading Types of Option Trading: Calls and Puts- Call Option:
- Gives buyer the right to BUY the underlying asset.
- Buyer expects price to RISE.
- Example: Buy Nifty Call at 22,000 strike, profit if Nifty goes above 22,000 + premium paid.
- Put Option:
- Gives buyer the right to SELL the underlying asset.
- Buyer expects price to FALL.
- Example: Buy Nifty Put at 22,000 strike, profit if Nifty goes below 22,000 - premium paid

Understanding Stock Market TradingBasics of Stock Trading
At its core, stock trading involves purchasing a company’s equity, known as a share, with the expectation that its value will increase over time, providing capital gains or dividend income. Shares represent ownership in a company, giving shareholders certain rights, such as voting at annual general meetings and receiving dividends. The stock market operates under the principles of supply and demand. When demand for a stock increases, its price rises; when supply exceeds demand, the price falls.
There are two main types of stock market participants: retail investors (individuals) and institutional investors (mutual funds, banks, hedge funds, etc.). Retail investors often trade in smaller volumes and rely on personal research or brokerage platforms, whereas institutional investors handle large volumes of trades and have significant market influence.
Stock Exchanges and Trading Platforms
Trading occurs on stock exchanges—centralized platforms where buyers and sellers meet. Globally, major exchanges include the New York Stock Exchange (NYSE), NASDAQ, London Stock Exchange (LSE), and India’s National Stock Exchange (NSE) and Bombay Stock Exchange (BSE). These exchanges enforce strict regulations to ensure transparency, fair pricing, and investor protection.
In addition to traditional exchanges, trading has evolved through online brokerage platforms and mobile apps, which provide real-time market data, charts, and research tools. These platforms allow investors to place different types of orders, such as market orders, limit orders, and stop-loss orders, enabling greater control over trading strategies.
Types of Stock Market Trading
Stock trading is broadly categorized based on the time horizon and strategy:
Day Trading:
Day traders buy and sell stocks within the same trading day, aiming to profit from short-term price fluctuations. They rely heavily on technical analysis, charts, and real-time data. This type of trading is high-risk and requires quick decision-making and strict risk management.
Swing Trading:
Swing traders hold stocks for a few days to weeks, attempting to capture price movements during trends. This approach balances the intensity of day trading with a longer-term perspective and often uses a combination of technical and fundamental analysis.
Position Trading:
Position traders adopt a long-term approach, holding stocks for months or years. Their focus is on the underlying fundamentals of companies, economic trends, and growth potential rather than short-term market fluctuations.
Scalping:
Scalping is a high-frequency trading strategy where traders make numerous trades within minutes or seconds to capture small price differentials. It demands high precision, speed, and low transaction costs.
Fundamental and Technical Analysis
Successful stock trading relies on analysis, which can be divided into fundamental and technical approaches:
Fundamental Analysis:
This involves evaluating a company’s financial health, management, industry position, and growth prospects. Key metrics include earnings per share (EPS), price-to-earnings (P/E) ratio, revenue growth, profit margins, and debt levels. Macroeconomic factors like interest rates, inflation, and GDP growth also influence fundamental analysis. Investors using this method aim to identify undervalued stocks that are likely to grow over time.
Technical Analysis:
Technical analysis studies historical price movements and trading volumes to forecast future trends. Traders use charts, patterns, and indicators such as moving averages, Relative Strength Index (RSI), and Bollinger Bands. This method is widely used in short-term trading strategies like day trading and swing trading.
Many traders combine both methods to maximize insights. For instance, a swing trader may use fundamental analysis to select stocks and technical analysis to determine entry and exit points.
Derivatives and Advanced Trading
Beyond buying and selling stocks, traders can use derivatives such as options, futures, and contracts for difference (CFDs) to hedge risks or speculate.
Options give the right, but not the obligation, to buy or sell a stock at a predetermined price.
Futures are contracts to buy or sell an asset at a future date at a fixed price.
CFDs allow traders to speculate on price movements without owning the underlying asset.
These instruments amplify both potential profits and risks, requiring thorough understanding and careful risk management.
Risk Management and Psychology
Trading involves risk, as prices can fluctuate due to market volatility, economic events, or unexpected company performance. Effective risk management strategies include:
Setting stop-loss orders to limit potential losses
Diversifying across sectors and asset classes
Using position sizing to prevent excessive exposure
Equally important is trading psychology. Emotional control is critical, as fear and greed can drive impulsive decisions. Successful traders cultivate discipline, patience, and the ability to stick to their trading plans even under market stress.
Regulation and Compliance
Stock markets are heavily regulated to protect investors and maintain fair trading. Regulatory bodies, such as the Securities and Exchange Commission (SEC) in the U.S. and the Securities and Exchange Board of India (SEBI), enforce rules on transparency, insider trading, market manipulation, and reporting. Compliance ensures investor confidence and smooth functioning of markets.
Trends and Technology in Trading
Modern stock trading has been transformed by technology. Algorithmic trading and high-frequency trading leverage computers to execute trades at extremely high speeds based on predefined rules. Artificial intelligence and machine learning are increasingly used to analyze market data, detect patterns, and optimize trading strategies. Moreover, mobile trading apps and robo-advisors have democratized access, allowing even small investors to participate actively in markets.
Sustainability and ESG (Environmental, Social, and Governance) investing are also emerging trends, where traders consider non-financial factors while making investment decisions.
Conclusion
Stock market trading is both an art and a science. It provides opportunities for wealth creation, liquidity, and portfolio diversification, but it is not without risks. Success depends on a combination of knowledge, strategy, discipline, and emotional resilience. Whether you are a long-term investor focusing on fundamentals or a short-term trader analyzing technical charts, understanding market dynamics, regulatory frameworks, and risk management principles is essential.
The stock market reflects the broader economy and human behavior, making it a fascinating yet challenging domain. With the right approach, education, and patience, trading can be a rewarding avenue for financial growth and personal development.

Market Fundamentals: A Comprehensive Overview1. Definition and Importance of Market Fundamentals
Market fundamentals can be defined as the underlying forces or conditions that influence the supply and demand of financial instruments, ultimately determining their prices. These fundamentals are rooted in economic indicators, corporate performance, geopolitical developments, and investor sentiment.
The importance of market fundamentals lies in their ability to:
Provide a rational basis for valuing securities.
Help predict long-term trends in asset prices.
Allow investors to identify mispriced assets and investment opportunities.
Assist in understanding macroeconomic conditions and their impact on various sectors.
By studying market fundamentals, investors can make informed decisions rather than relying solely on speculation or short-term price fluctuations.
2. Key Components of Market Fundamentals
Market fundamentals consist of various factors that can be broadly categorized into economic fundamentals, financial fundamentals, and qualitative factors.
a) Economic Fundamentals
Economic fundamentals are indicators that reflect the overall health of an economy and influence market performance. These include:
Gross Domestic Product (GDP): GDP measures the total value of goods and services produced within a country. A growing GDP signals economic expansion, increased corporate earnings, and potentially higher stock prices. Conversely, declining GDP indicates a slowdown or recession, which can negatively affect markets.
Inflation Rates: Inflation measures the general rise in prices over time. Moderate inflation is often a sign of a healthy economy, but high inflation erodes purchasing power and can lead central banks to raise interest rates, impacting asset prices.
Interest Rates: Set by central banks, interest rates influence borrowing costs, corporate profits, and consumer spending. Lower interest rates encourage investment and spending, typically boosting stock markets, whereas higher rates can dampen economic activity.
Employment Data: Employment levels, wages, and unemployment rates reflect economic productivity and consumer purchasing power. Strong employment data usually boosts market confidence, while rising unemployment may lead to reduced spending and market corrections.
Trade Balance and Currency Strength: A country’s imports, exports, and currency value affect corporate earnings, particularly for multinational companies. A strong currency can reduce export competitiveness but lower import costs.
b) Financial Fundamentals
Financial fundamentals focus on the health, performance, and valuation of individual companies or sectors. Key metrics include:
Revenue and Earnings Growth: The primary indicators of corporate performance are revenue (sales) and net income (profit). Consistent growth signals strong management and potential for long-term stock appreciation.
Profit Margins: Profitability ratios, such as gross, operating, and net profit margins, measure efficiency and cost management. High margins often indicate competitive advantage and financial strength.
Return on Equity (ROE) and Return on Assets (ROA): ROE shows how effectively a company uses shareholder capital, while ROA measures how efficiently assets generate profits. Higher returns typically attract investors.
Debt Levels: The debt-to-equity ratio and other leverage indicators reveal financial risk. Excessive debt can lead to solvency issues, especially in economic downturns, while manageable debt supports growth and expansion.
Cash Flow: Cash flow from operations reflects a company’s ability to generate liquidity for reinvestment, debt servicing, and dividends. Strong cash flow indicates financial stability.
Valuation Metrics: Ratios such as Price-to-Earnings (P/E), Price-to-Book (P/B), and Price-to-Sales (P/S) help investors assess whether a stock is overvalued, undervalued, or fairly priced relative to its fundamentals.
c) Qualitative Factors
Not all market fundamentals are quantitative. Qualitative factors also play a crucial role in determining asset value:
Management Quality: The experience, strategy, and integrity of a company’s leadership affect its long-term success. Good management can navigate market challenges effectively.
Industry Position and Competitive Advantage: Companies with strong brand recognition, technological superiority, or unique market niches tend to outperform competitors.
Regulatory Environment: Government policies, taxation, and regulations can impact profitability and market behavior. For instance, subsidies or trade tariffs can boost or hinder specific sectors.
Geopolitical Stability: Political unrest, international conflicts, and diplomatic relations influence investor confidence and capital flows, affecting markets.
3. Market Fundamentals in Different Asset Classes
Market fundamentals apply across various financial markets:
Equities (Stocks): Stock prices are influenced by company earnings, sector performance, and macroeconomic indicators. Strong fundamentals often indicate long-term investment potential.
Bonds: Bond prices are affected by interest rates, inflation, and credit ratings. Investors look for stable returns and low default risk.
Commodities: Commodity prices depend on supply-demand dynamics, production costs, geopolitical events, and weather conditions. For example, oil prices are highly sensitive to OPEC decisions and global demand trends.
Foreign Exchange (Forex): Currency values are influenced by trade balances, interest rates, inflation, and political stability. Strong economies and fiscal policies attract foreign investment, strengthening the currency.
4. Fundamental Analysis vs. Technical Analysis
While market fundamentals focus on intrinsic value, technical analysis examines historical price patterns and trading volumes to predict short-term market movements. Both approaches complement each other:
Fundamental analysis is long-term oriented, aiming to identify undervalued or overvalued assets.
Technical analysis is short-term oriented, useful for timing entries and exits based on market psychology and trends.
Savvy investors often combine both to make well-informed decisions.
5. Challenges and Limitations of Market Fundamentals
Despite their importance, relying solely on fundamentals has challenges:
Market Sentiment: Emotional behavior, speculation, and herd mentality can cause prices to deviate from fundamental values. For example, during a bubble, assets may be overvalued despite weak fundamentals.
Data Accuracy: Economic and corporate data can be revised, delayed, or manipulated, affecting analysis accuracy.
Complex Interdependencies: Globalization means that local economic changes can have far-reaching effects, making prediction more complicated.
Time Lag: Fundamental changes often take time to reflect in market prices, leading to potential short-term volatility.
6. Practical Applications of Market Fundamentals
Investors and traders use fundamentals to:
Identify long-term investment opportunities by spotting undervalued assets.
Develop portfolio strategies that align with economic cycles and sector performance.
Assess risk by evaluating financial stability, debt levels, and external threats.
Make informed decisions during mergers, acquisitions, and capital investments.
For institutions, market fundamentals guide policy-making, monetary decisions, and strategic planning.
7. Conclusion
Market fundamentals form the backbone of informed investment decision-making. By examining economic indicators, corporate financial health, and qualitative factors, investors can assess the intrinsic value of assets and anticipate market trends. While markets can be influenced by sentiment and speculation, a strong grasp of fundamentals provides a reliable framework for long-term financial success.
In an increasingly complex and interconnected world, understanding market fundamentals is not just a tool for investors but a necessity for navigating the dynamic landscape of global finance. By combining analytical rigor with strategic insight, individuals and institutions alike can make smarter, more sustainable decisions, achieving financial growth while mitigating risk.

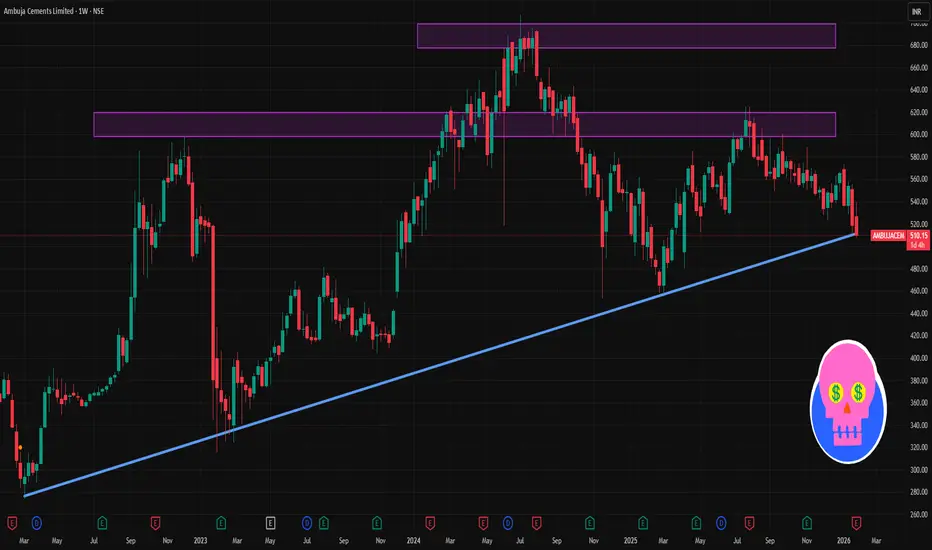
AMBUJACEM 1 Week Time Frame 📊 Current Price Context
The stock has recently traded around ₹510 – ₹536 after earnings‑related volatility.
The 52‑week range is roughly ₹455 (low) to ₹625 (high).
🔁 1‑Week Technical Levels (approx)
Key resistance (levels where sellers may step in):
₹542‑₹545: Near recent pivotal resistance zone.
₹552‑₹558: Secondary resistance cluster short‑term.
Key support (levels where buyers may defend):
₹527‑₹528: Initial support within the week.
₹521‑₹516: Next support zone if the dip extends.
₹500 – ₹495: Stronger longer‑term support if selling intensifies.
📉 Short‑Term Trend & Signal
Technical aggregators rate the stock as weak/neutral to bearish on the 1‑week timeframe — meaning downside risks currently outweigh upside signal.
Price below recent pivot and moving averages suggests bearish short‑term momentum absent close above resistance.
📌 Practical Swing Levels (Simple Guide)
Bullish trigger zone: closing above ₹545‑₹550 on weekly closes could make higher levels nearer ₹560+ possible.
Bearish trigger zone: closing below ₹520 may open path toward ₹500 and deeper.
Advanced Technical Analysis: A Comprehensive Guide1. Principles of Advanced Technical Analysis
At its core, technical analysis is based on three main principles:
Price Discounts Everything: All information — news, fundamentals, market sentiment — is reflected in the price. Advanced TA accepts this as a foundation, emphasizing price action over external factors.
Price Moves in Trends: Markets trend in three ways — uptrend, downtrend, and sideways. Advanced analysis focuses on identifying the start and end of these trends with precision using sophisticated tools.
History Repeats Itself: Patterns, behaviors, and psychology tend to repeat due to human nature. Advanced TA uses pattern recognition and statistical methods to capitalize on these repetitive behaviors.
Advanced TA combines these principles with quantitative methods and behavioral insights to increase accuracy.
2. Advanced Chart Patterns
While basic patterns include head and shoulders, double tops, and triangles, advanced patterns are more nuanced:
Harmonic Patterns: These patterns, like the Gartley, Butterfly, Bat, and Crab, use Fibonacci ratios to identify precise reversal zones. Unlike basic patterns, harmonic patterns offer a mathematically-defined framework for entry and exit.
Elliott Wave Theory: Developed by Ralph Nelson Elliott, this theory identifies recurring waves in price movement — impulsive (trend-following) and corrective (counter-trend) waves. Advanced traders use Elliott Wave to forecast multi-timeframe trends and market cycles.
Market Profile: This tool analyzes the distribution of traded volume at different price levels to identify value areas, points of control, and price acceptance zones. Market Profile is highly useful for intraday and institutional trading strategies.
3. Advanced Technical Indicators
Beyond moving averages and RSI, advanced traders rely on more sophisticated indicators:
Ichimoku Kinko Hyo: Often called the “one-glance indicator,” it provides support, resistance, trend direction, and momentum in one chart. The Kumo (cloud) identifies trend strength and potential reversals.
Fibonacci Extensions & Retracements: Advanced traders use Fibonacci levels not just for retracements, but for projecting price targets and stop-loss levels. Confluences with other indicators improve accuracy.
MACD with Histogram Divergence: While the basic MACD identifies trend and momentum, analyzing divergences between MACD and price uncovers early reversal signals.
Volume-based Indicators: Tools like On-Balance Volume (OBV), Chaikin Money Flow (CMF), and Volume Price Trend (VPT) help identify accumulation or distribution phases, indicating potential breakouts or breakdowns.
Adaptive Indicators: Indicators like Adaptive Moving Average (AMA) and Kaufman’s Efficiency Ratio adjust to market volatility, providing a more responsive approach than static indicators.
4. Multi-Timeframe Analysis
Advanced traders rarely rely on a single timeframe. Multi-timeframe analysis involves examining multiple chart intervals — from monthly to intraday — to identify trends and align trades with higher-probability setups. Key principles include:
Top-Down Approach: Start with a higher timeframe to identify the major trend, then use lower timeframes to refine entries and exits.
Timeframe Confluence: Trades are stronger when multiple timeframes agree on trend direction, support/resistance, and momentum.
Fractal Patterns: Price movements repeat across timeframes, allowing traders to anticipate behavior in smaller or larger scales using fractal analysis.
5. Advanced Price Action Techniques
Price action analysis is the study of raw price behavior without relying heavily on indicators. Advanced techniques include:
Order Flow Analysis: Examining the flow of buy and sell orders in real-time markets to understand institutional activity and anticipate price moves.
Candlestick Confluence: Combining multiple candlestick patterns across higher and lower timeframes to validate reversals or continuation signals.
Support/Resistance with Precision: Using historical highs/lows, pivot points, Fibonacci levels, and volume clusters to identify high-probability zones for entries and exits.
Trend Exhaustion Signals: Recognizing signs of overextension, like long wicks, shrinking volume, or divergence in oscillators, to anticipate reversals.
6. Quantitative and Statistical Methods
Professional technical analysis increasingly incorporates quantitative methods:
Statistical Indicators: Bollinger Bands, Standard Deviation Channels, and Keltner Channels help identify volatility, mean reversion, and breakout points.
Correlation Analysis: Examining how assets or indices move in relation to each other to hedge or amplify trades.
Backtesting and Algorithmic Validation: Advanced traders validate strategies using historical data, Monte Carlo simulations, and statistical models to measure risk and probability of success.
7. Risk Management and Trade Psychology
Advanced technical analysis is incomplete without rigorous risk management:
Position Sizing: Using volatility, ATR, or percentage-based methods to determine trade size.
Stop-Loss Placement: Placing stops beyond key support/resistance, volatility levels, or pattern invalidation points.
Reward-to-Risk Optimization: Targeting trades with at least a 2:1 or 3:1 reward-to-risk ratio ensures long-term profitability.
Psychological Discipline: Advanced traders maintain emotional control, avoid overtrading, and adhere strictly to plan-based trading.
8. Integration with Fundamental and Sentiment Analysis
Though TA focuses on price, advanced practitioners often combine it with fundamental and sentiment insights:
Macro Events: Interest rates, earnings, or geopolitical developments can amplify technical setups.
Market Sentiment Indicators: Commitment of Traders (COT) reports, VIX index, and news sentiment can provide context to technical signals.
Confluence Approach: Trades with alignment between technical setups, fundamental catalysts, and market sentiment tend to have the highest probability.
9. Algorithmic and Machine Learning Approaches
Modern advanced technical analysis increasingly incorporates algorithmic trading and AI:
Pattern Recognition AI: Machine learning models can detect complex chart patterns faster and more accurately than humans.
Predictive Analytics: Using historical price, volume, and alternative data to predict probabilities of trend continuation or reversal.
Automated Execution: Advanced traders often use bots and automated scripts to execute trades when conditions are met, reducing emotional bias and ensuring precision.
10. Key Takeaways
Advanced technical analysis is more than chart reading; it is an integrated science of price, volume, momentum, and psychology. Key principles for mastery include:
Understanding multi-timeframe trends.
Combining advanced indicators, harmonic patterns, and Elliott Wave.
Using quantitative validation and backtesting for strategy reliability.
Integrating price action with institutional order flow and sentiment data.
Implementing strict risk management and psychological discipline.
By combining these tools, techniques, and analytical frameworks, traders can increase the probability of success, adapt to changing market conditions, and make informed decisions beyond simple guesswork. Advanced technical analysis is not about finding “guaranteed” trades but about stacking probabilities in your favor.
VTL 1 Day View 📍 Latest Price Context (Daily Close)
Approx. share price: ~₹432 – ₹433 on NSE (close of last session).
Today’s range (recent session): High ~₹468, Low ~₹407.45.
52-week range: Low ~₹361.10, High ~₹539.90.
📊 Key Daily Levels (1-Day Time Frame)
🔑 Pivot & Intraday Levels
(Based on pivot point calculations for the daily session)
Central Pivot (Daily): ~₹412.33 – baseline pivot for directional bias.
📈 Resistance Levels
R1 ~₹418 – ₹423 – first near-term resistance zone.
R2 ~₹423 – ₹429 – next resistance above pivot.
R3 ~₹429 – ₹446 (or higher intraday) – notable upper resistance zone if price strengthens.
👉 Bullish scenario: Daily close above ~₹429-₹435 could trigger further upside momentum toward higher resistance zones (based on recent highs).
📉 Support Levels
S1 ~₹407 – ₹410 – short-term support near today’s low zone.
S2 ~₹401 – ₹405 – secondary support if price declines below S1.
S3 ~₹396 – ₹399 – deeper support on a pullback.
👉 Bearish scenario: A daily close below ~₹401-₹396 may open further decline toward lower support clusters.
📌 Simple Interpretation (Daily TF)
📍 Above Pivot (~₹412): Slightly bullish / range control.
📍 Holding Support (~₹407 – ₹401): Helps limit downside.
📍 Break above ~₹429: Potential for continuation to next resistance area.
📍 Break below ~₹396: Bearish momentum intensifies.
⚠️ Notes
Levels are based on standard pivot and support/resistance derivations — actual intraday price action may vary with market volatility.
For live charts and real-time plotting, it’s best to check TradingView, your broker’s charting tool, or other live market platforms.

AUROPHARMA 1 Month View📌 Current Price Context
Last traded / current price: ~₹1,207–₹1,208 on NSE.
📊 Key Technical Levels (1-Month View)
🔹 Pivot Point
Pivot (daily): ~₹1,200 – centre of recent price action.
📈 Resistance Levels
R1: ~₹1,226–₹1,228 — first meaningful resistance above current price.
R2: ~₹1,245–₹1,247 — higher resistance zone from classic pivot analysis.
R3: ~₹1,271–₹1,275+ — extended resistance from upper pivot range.
These resistances correspond to areas where price has previously found sellers or consolidation over the last few weeks.
📉 Support Levels
S1: ~₹1,181–₹1,182 — first support just below pivot region.
S2: ~₹1,155–₹1,156 — secondary support from recent swing lows.
S3: ~₹1,136–₹1,138 — deeper support area if market weakens further.
These support zones align with recent range lows and moving average clusters over a monthly period.
📊 Moving Averages & Trend
20-day / 50-day / 100-day EMAs and SMAs are currently around ₹1,164–₹1,192 range — near price but showing neutral-to-slightly bullish bias on daily charts.
Price trading above most short and mid-term moving averages suggests short-term strength if levels hold.
📈 Oscillators / Momentum (Short-term indication)
RSI near mid-to-bullish levels (~58–68) indicating no extreme overbought condition yet.
Momentum suggests neutral-to-slightly uptrend in the recent 1-month timeframe.
📍 Summary (1-Month Technical View)
Bullish breakout zone:
• Above ~₹1,226 → may accelerate toward ₹1,245 / ₹1,270+
Key neutral range:
• ₹1,181–₹1,226 — consolidation band to watch intra-month
Bearish trigger (pullback):
• Below ~₹1,155 → risk of deeper test of ₹1,136+ support

STAR 1 Day View 📌 Live Price Snapshot
• Current price: ~₹877.00 on NSE (Last traded)
• Today’s range: ₹791 – ₹908.40
• 52-Week range: ₹513.05 – ₹1,025.00
📊 Daily Pivot & Key Levels (1-Day Timeframe)
These are approximate pivot, support and resistance levels based on the most recent pivot analysis published today:
📍 Pivot Point
Central Pivot: ~ ₹850.8
🛑 Resistance Levels
R1: ~ ₹868.1
R2: ~ ₹891.0
R3: ~ ₹908.3
(These are short-term upside barriers where price may slow/reverse)
🟩 Support Levels
S1: ~ ₹827.9
S2: ~ ₹810.6
S3: ~ ₹787.7
(These are immediate downside zones where price could find buying interest)
📌 How to Use These Levels Today
✔ Bullish view:
• Above Pivot ₹850.8 → watch for closing above R1 (~₹868) to strengthen upside bias.
• Breaking and holding above R2 (~₹891) could extend toward R3 (~₹908).
✔ Bearish/Range view:
• Failure below Pivot ₹850.8 or S1 (~₹827.9) increases odds of deeper correction toward S2/S3.
• Intraday rejections at R1/R2 can signal short-term sellers.

ACC 1 Month View 📈 1-Month Key Price Range
🔹 1-Month High: ~₹1,779 (late Jan 2026)
🔹 1-Month Low: ~₹1,626 (recent session low)
➡️ So the current 1-month trading range is roughly:
👉 ₹1,626 – ₹1,779
🔥 Short-Term Support & Resistance Levels
Support (Downside)
• S1: ~₹1,626 — recent intra-day low and current 52-week low area.
• S2: ~₹1,600 — psychological/support near multi-session lows (below recent range).
• S3: ~₹1,570 … deeper support if the range breaks down.
Resistance (Upside)
• R1: ~₹1,670–₹1,680 — immediate resistance around recent price reaction zone.
• R2: ~₹1,720 — short-term resistance near 20–30 day moving averages.
• R3: ~₹1,760–₹1,780 — recent 1-month highs.
📊 1-Month Technical Context
📉 Over the past 30 days, ACC has been in a modest downtrend/weak range, with 1-month returns in negative territory and prices sliding from the upper ₹1,700s toward mid-₹1,600s.
Technical indicators also point toward bearish/neutral momentum in the short term (e.g., RSI weak, MACD bearish) — aligning with the recent price pressures.

[SeoVereign] BITCOIN BULLISH Outlook – January 31, 2025Bitcoin is currently deciding its next move around the recent daily low of 80,700 USDT.
At this point, there are three main scenarios that could unfold for Bitcoin. First, it does not break below 80,700 USDT and continues to rise. Second, it breaks below 80,700 USDT but forms a whipsaw movement, fully recovers the decline, and reverses upward. Third, it breaks below 80,700 USDT and leads to a major decline.
Since we are traders, we must determine which of these three scenarios will prove to be correct.
It would be ideal if we could clearly choose one of the three options above. However, a market perspective is rarely something that can be decisively concluded in a black-or-white manner.
Therefore, rather than selecting one of the three scenarios, I will describe my subjective view in a narrative form.
First, I believe that in the short term, Bitcoin could rise without breaking below 80,700 USDT. However, if that happens, I do not expect the upward trend to last very long.
The reason is that historically, when Bitcoin transitions from a major downtrend to an uptrend, it has often broken below the previous low through a whipsaw to stop out long positions before reversing.
This may differ in smaller trends, but in larger timeframes, a double bottom without a whipsaw (where the right bottom is higher than the left) has, in my experience and research, rarely resulted in a meaningful major trend reversal.
Therefore, if the price rises immediately from the current level, I plan to take profits relatively quickly, as indicated on the chart.
On the other hand, if Bitcoin breaks below 80,700 USDT, two possibilities emerge. It could form a whipsaw and then transition into a major bull trend, or it could enter what many would call a “season-ending” level of significant decline. Which of these becomes reality can only be determined by observing the chart structure after some time has passed following the actual breakdown below 80,700 USDT.
Predicting the distant future in advance may be possible for some, but I consider it nearly impossible.
That is why, even though I predicted a rise in my previous idea and currently hold a long position, I did not allocate a large size. Compared to my usual trades, the position is very small, because my level of conviction was not high before placing the bet.
Although it is still early 2026, this moment could turn out to be the most difficult trading environment to predict this year. As I always say, everything is hardest at the beginning. Investing is the same. Capturing the initial turning point from decline to rise is extremely difficult and painful. However, once this phase passes and the next trend forms, reading the market becomes much easier.
The reason I maintain a high win rate is that I do not rashly predict the distant future. If you wait, there are often moments when the chart provides clues about the next move. I simply wait until then. The longer you wait, the more evidence accumulates, and predicting the next move becomes significantly easier.
If Bitcoin breaks below 80,700 USDT, I will update my view in this idea or share a new post.
Another point I would like to mention is that significant movements are occurring across the broader market.
If a book is ever written about the history of silver, January 31 may be recorded as one of its historic days. As of now, silver is showing a drop of over 20% in a single day. Alongside the U.S. market, the commodities market is experiencing enormous volatility. While the exact cause requires further research, what is certain is that asset “rebalancing” is taking place.
For some time, crypto has been thoroughly neglected by the market. While other assets continued their rallies, crypto alone remained in decline. The reason is simple. The crypto market lacked attractiveness, and capital did not flow into it. However, crypto is now at relatively low price levels, while other assets are forming price ranges near their highs.
I believe there is a high probability that funds liquidated from assets positioned at high levels will eventually flow into the crypto market. If crypto continues to decline, it may mean that investors are temporarily holding that capital on the sidelines. In other words, commodities are likely to show weakness or move sideways, while crypto is likely to show strength or move sideways.
Even I am currently holding a substantial amount of cash while waiting for opportunities to increase my spot crypto allocation.
As mentioned in this post, crypto’s direction will soon be determined. When that moment comes, I will decide whether to purchase spot or wait a little longer.
In summary, in the short term, I plan to accumulate long exposure based on this idea. The size of the position will be adjusted over time as the market becomes clearer. For now, since information is limited and multiple directions remain open, I am buying only a small amount. Technically, I am basing this on the Shark Pattern, and from a macro perspective, on the market rebalancing discussed above.
Accordingly, I have set a short-term target around 89,308 USDT.
If the movement becomes clearer or the analysis requires updating, I will add to this post or return with a new one.
Thank you for reading.

DAILY FOREX SCAN Session – 22 30 01 26Scanning multiple forex pairs to filter high-quality trade setups. No trades are forced—only structure-based opportunities.
Note: There may be a delay in this video due to upload processing time.
Disclaimer: FX trading involves high leverage and substantial risk, and losses can exceed your initial investment. This content is for educational purposes only and should not be considered financial advice. Trade at your own risk.

Gold Market Shows Volatile Swings as Buyers and Sellers Clash(Educational)
At market open, Gold demonstrated strong bullish momentum, opening with a clear upside gap and quickly moving toward key highs. Early buying enthusiasm met significant selling pressure, causing prices to drop sharply. Buyers re-entered near lower zones, triggering a rebound, but renewed selling capped gains and pushed prices back down. The session has been marked by aggressive and fast swings, reflecting an active battle between buyers and sellers. Support is observed at lower zones, while resistance forms at recent highs and supply areas. Price action remains unstable, alternating between bullish and bearish phases, emphasizing the need for caution and disciplined observation. Traders should closely monitor these critical zones, as they highlight short-term momentum shifts, reversal potential, and areas where market control alternates. Overall, Gold continues to show a dynamic structure with rapid swings, requiring careful attention to market reactions and active participation from both sides. Volatility remains high, offering both opportunities and risks, making it important to follow price behavior and adjust strategies accordingly.

BTCUSD Demand Zone in Focus After Strong Bearish MoveBTCUSD is currently trading after a strong bearish move, where price broke below the earlier sideways structure with high selling momentum. The market clearly respected a downward trend, forming lower highs and showing consistent selling pressure. The resistance area around 89,800–90,400 worked as a strong selling zone, where price faced rejection and sellers regained control, leading to a sharp fall.
After this decline, price has now reached a major demand zone near 83,500–84,000. This area is supported by earlier buying activity and base formation, making it an important support level. The present reaction from this zone indicates that sellers are slowing down and buyers are trying to hold price. As long as BTCUSD stays above this demand, short-term stability or a corrective move can be seen.
The risk area below demand shows where downside pressure may increase if support breaks. A clear move below this zone would strengthen the bearish trend further. For now, price is consolidating near support, and volatility is expected around these levels. Overall market bias remains cautious, with bearish control still active, but short-term recovery chances remain while demand holds.
Disclaimer: This analysis is for educational purposes only. It is not financial advice. Trading involves risk and uncertainty.
