MAX FINANCIAL SERVICES LTDAs of May 1, 2025, at 9:35 AM IST, here are the key daily support and resistance levels for Max Financial Services Ltd. (NSE: MFSL) based on recent technical analysis:
🔹 Support Levels
S3: ₹1,011.58
S2: ₹1,020.37
S1: ₹1,030.43
🔹 Resistance Levels
R1: ₹1,049.28
R2: ₹1,058.07
R3: ₹1,068.13
These levels are derived from the Classic pivot point method, calculated based on the price range of the previous trading day.
📊 Technical Indicators
RSI (14): 50.14 (Neutral)
MACD: 1.57 (Sell)
ADX (14): 22.20 (Neutral)
Williams %R: -51.44 (Buy)
CCI (14): 68.41 (Neutral)
ROC: 3.45 (Buy)
These indicators suggest a neutral to slightly bullish trend, with the stock trading near its 20-day moving average and showing mixed momentum signals.
📈 Moving Averages
20-day EMA: ₹1,073.42
50-day EMA: ₹1,109.36
100-day EMA: ₹1,118.91
200-day EMA: ₹1,086.00
The stock is trading below its 50-day and 100-day EMAs, indicating a potential resistance zone around ₹1,109.36.
Note: These levels and indicators are based on historical data and are subject to change with market conditions. It's advisable to monitor the stock's price movements and consult with a financial advisor before making any trading decisions.
HDFC

PIL ITALICA LIFESTYLE LTDAs of May 1, 2025, at 9:20 AM IST, here are the key daily support and resistance levels for Pil Italica Lifestyle Ltd (NSE: PILITA) based on recent technical analysis:
🔹 Support Levels
S1: ₹14.71
S2: ₹14.40
S3: ₹14.02
🔹 Resistance Levels
R1: ₹15.40
R2: ₹15.78
R3: ₹16.09
These levels are derived from the Classic pivot point method, calculated based on the price range of the previous trading day.
Technical Indicators:
RSI (14): 66.92 (Uptrend)
MFI: 88.87 (Strong Uptrend)
CCI (14): 262.93 (Strong Uptrend)
EMA (20): ₹13.37 (Neutral)
EMA (50): ₹12.94 (Uptrend)
EMA (100): ₹12.72 (Uptrend)
EMA (200): ₹12.27 (Uptrend)
These indicators suggest a bullish trend, with the stock trading above key moving averages and strong momentum indicators.
Please note that these levels are based on historical data and are subject to change with market conditions. It's advisable to monitor the stock's price movements and consult with a financial advisor before making any trading decisions.

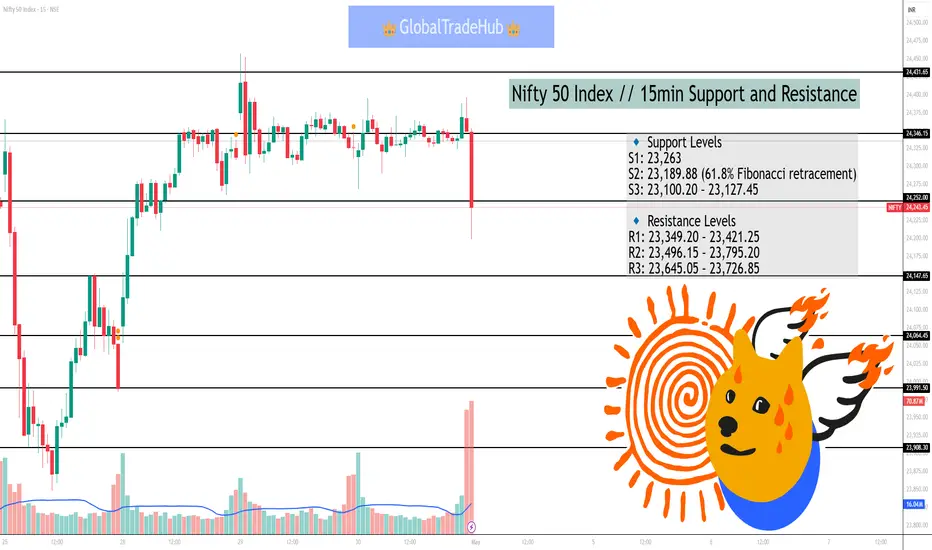
Nifty 50 Index // 15min Support and ResistanceAs of May 1, 2025, at 9:04 AM IST, the Nifty 50 index is trading at approximately 23,630. Based on recent intraday analysis, here are the key 15-minute support and resistance levels:
🔹 Support Levels
S1: 23,263
S2: 23,189.88 (61.8% Fibonacci retracement)
S3: 23,100.20 – 23,127.45
🔹 Resistance Levels
R1: 23,349.20 – 23,421.25
R2: 23,496.15 – 23,795.20
R3: 23,645.05 – 23,726.85
These levels are derived from recent intraday analysis and are subject to change with market conditions. It's advisable to monitor the stock's price movements and consult with a financial advisor before making any trading decisions.
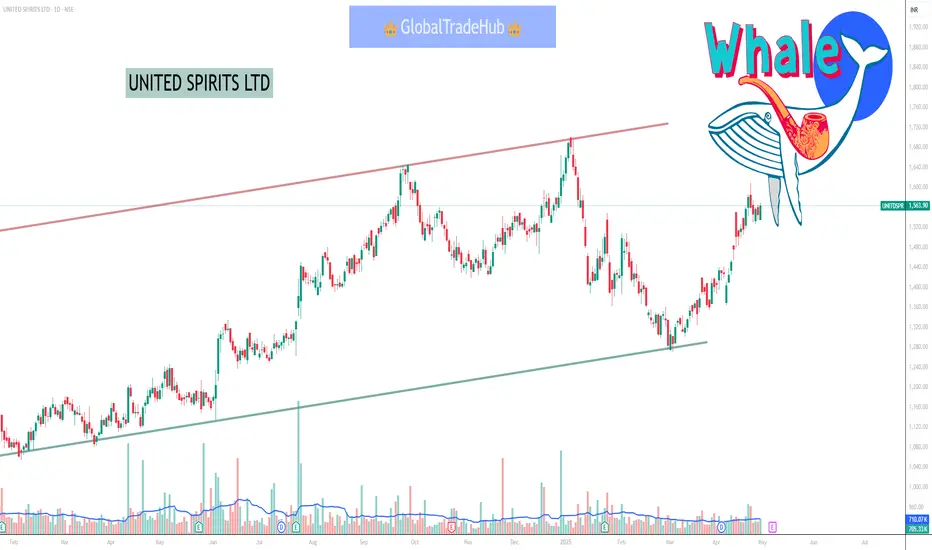
UNITED SPIRITS LTD As of May 1, 2025, here are the key support and resistance levels for United Spirits Ltd (NSE: UNITDSPR) based on the latest technical analysis:
🔹 Support Levels
S1: ₹1,322.63
S2: ₹1,297.97
S3: ₹1,271.98
🔹 Resistance Levels
R1: ₹1,373.28
R2: ₹1,399.27
R3: ₹1,423.93
These levels are derived from pivot point calculations and are commonly used by traders to identify potential price reversal zones.
Please note that these levels are based on historical data and are subject to change with market conditions. It's advisable to monitor the stock's price movements and consult with a financial advisor before making any trading decisions.
Option TradingOption trading involves buying or selling contracts that give the right, but not the obligation, to buy or sell an underlying asset (like a stock) at a specific price (strike price) by a certain date (expiration date). It allows traders to speculate on future price movements of an asset without actually owning it.

MACD TradingThe Moving Average Convergence/Divergence indicator is a momentum oscillator primarily used to trade trends. Although it is an oscillator, it is not typically used to identify over bought or oversold conditions. It appears on the chart as two lines which oscillate without boundaries.

Explanation of RSIThe Relative Strength Index (RSI) is a momentum indicator used in technical analysis to assess the speed and magnitude of price changes. It helps traders identify potential overbought and oversold conditions in a financial instrument, suggesting when an asset might be nearing a trend reversal. RSI values range from 0 to 100, with readings below 30 often indicating oversold conditions and readings above 70 suggesting overbought conditions.

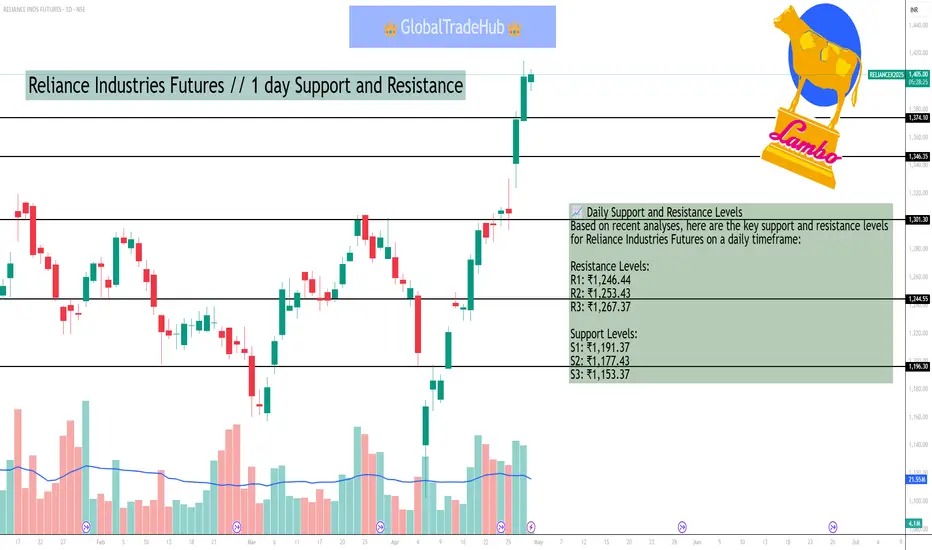
Reliance Industries Futures // 1 day Support and ResistanceAs of April 30, 2025, the Reliance Industries Futures (NSE: RELIANCE) closed at ₹1,235.80, up 0.16% from the previous close of ₹1,233.80. The futures market indicates a slight bullish sentiment, with open interest increasing by 4.82%, suggesting that traders are holding onto long positions.
📈 Daily Support and Resistance Levels
Based on recent analyses, here are the key support and resistance levels for Reliance Industries Futures on a daily timeframe:
Resistance Levels:
R1: ₹1,246.44
R2: ₹1,253.43
R3: ₹1,267.37
Support Levels:
S1: ₹1,191.37
S2: ₹1,177.43
S3: ₹1,153.37
These levels are derived from classic pivot point calculations and can act as potential entry, target, and stop-loss levels for intraday traders.
📊 Technical Indicators
Futures Price: ₹1,243.90
Pivot Point: ₹1,246.98
Support Levels:
S1: ₹1,233.12
S2: ₹1,222.33
S3: ₹1,208.47
Resistance Levels:
R1: ₹1,257.77
R2: ₹1,271.63
R3: ₹1,282.42
These levels are calculated based on the futures price and can provide insights into potential price movements.
🧭 Trading Strategy
Bullish Scenario: If Reliance Industries Futures breaks above ₹1,246.44, it could signal a continuation of the upward trend, with potential targets at ₹1,253.43 and ₹1,267.37.
Bearish Scenario: A decline below ₹1,191.37 may indicate a bearish trend, with support levels at ₹1,177.43 and ₹1,153.37.
Traders should monitor these levels closely and adjust their strategies accordingly.
Please note that these levels are subject to change based on market dynamics and should be used in conjunction with other technical analysis tools for informed decision-making.
Nifty Financial Services Index//15min Support and ResistanceAs of April 30, 2025, the Nifty Financial Services Index (FINNIFTY) is exhibiting a bullish trend, with the current price at ₹23,512.80. Technical indicators such as moving averages and pivot points suggest potential support and resistance levels for short-term trading.
📊 Key Support and Resistance Levels
Based on recent analyses, here are the critical levels to monitor:
Resistance Levels:
R1: ₹23,571.52
R2: ₹23,630.23
R3: ₹23,695.77
Support Levels:
S1: ₹23,447.27
S2: ₹23,381.73
S3: ₹23,323.02
These levels are derived from pivot point calculations and are useful for intraday trading strategies.
📈 Technical Indicators
Moving Averages:
The index is trading above its 5-day, 10-day, and 20-day simple and exponential moving averages, indicating a bullish short-term trend.
Pivot Points:
The classic pivot point is at ₹24,264.15, with R1 at ₹24,397.3 and S1 at ₹24,175.85.
🧭 Trading Strategy
Given the current bullish momentum, traders might consider buying near support levels and targeting resistance levels for potential profits. However, it's essential to monitor market conditions closely, as breakouts above resistance levels could lead to further upward movement, while failures to hold support may indicate a reversal.
Please note that these levels are subject to change based on market dynamics and should be used in conjunction with other technical analysis tools for informed decision-making.

Engineers India Ltd (EIL)As of April 30, 2025, Engineers India Ltd (EIL) is trading at ₹178.41 on the NSE. Based on the latest technical analysis, here are the key intraday support and resistance levels for EIL:
📊 Intraday Support and Resistance Levels
Pivot Point: ₹180.13
First Support: ₹177.46
Second Support: ₹174.04
Third Support: ₹171.37
First Resistance: ₹183.55
Second Resistance: ₹186.22
Third Resistance: ₹189.64
📈 Technical Indicators
Relative Strength Index (RSI): 37.21 (indicating a potentially oversold condition)
Money Flow Index (MFI): 28.35 (suggesting weak buying pressure)
MACD: -9.01 (indicating a bearish trend)
These levels and indicators suggest that EIL is currently in a bearish phase, with the stock trading below its pivot point and facing resistance at higher levels. Traders may consider monitoring the stock for potential reversal patterns or further breakdowns.
Please note that stock prices and technical levels are subject to change, and it's advisable to consult with a financial advisor or conduct further research before making investment decisions.

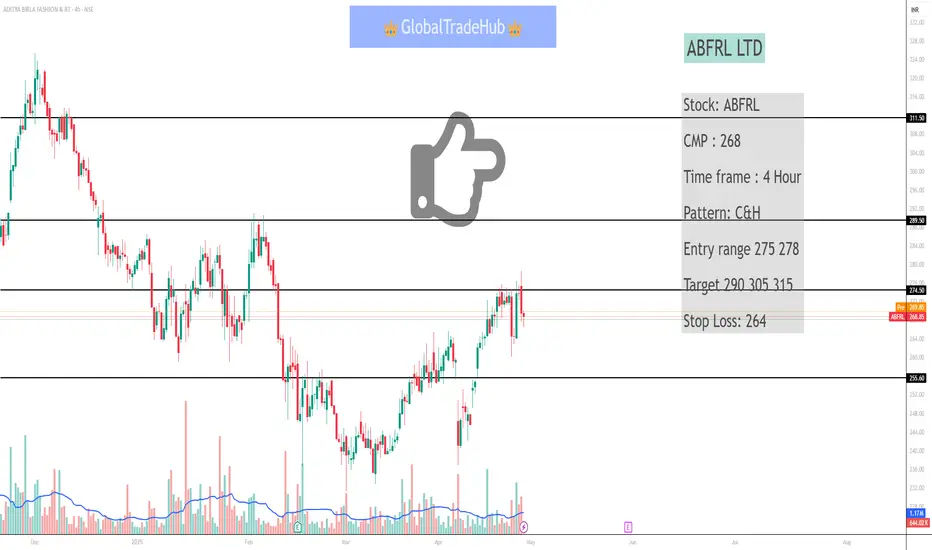
ABFRL LTDABFRL LTD
I'm not a SEBI - Registered advisor. All the information provided is for educational and information purposes only.
Note- This is not buy/sell recommendation, before investing discuss with your financial adviser
Stock: ABFRL
CMP : 268
Time frame : 4 Hour
Pattern: C&H
Entry range 275 278
Target 290 305 315
Stop Loss: 264
#ABFRL
Hindustan Aeronautics LtdHindustan Aeronautics Ltd
Hindustan Aeronautics Ltd (HAL) Analysis Pattern: Ascending Triangle Breakout
CMP: *4609.30
Intraday Setup:
Buy Above: *4630
Target: *4745
Stop Loss: *4545
Strong trendline support and breakout above horizontal resistance confirm bullish
momentum. Volume confirms breakout strength.

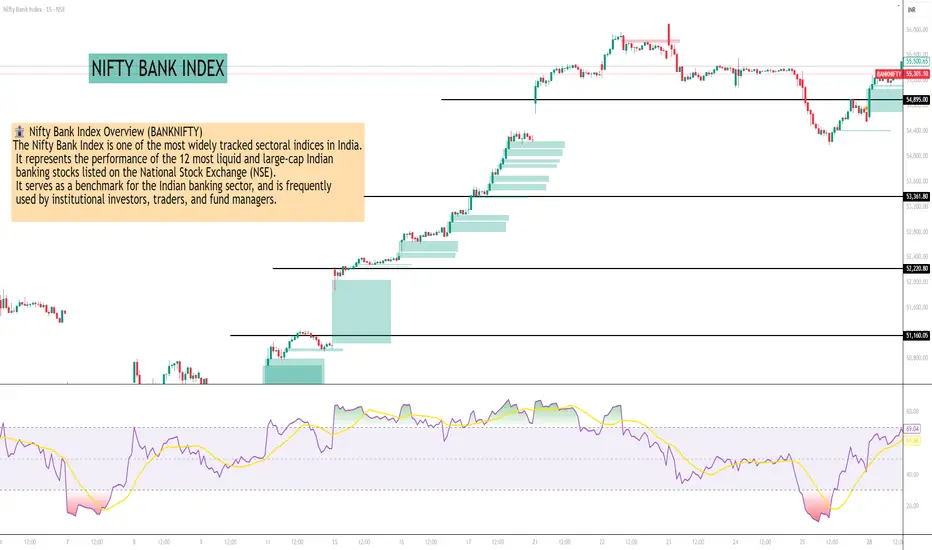
NIFTY BANK INDEX🏦 Nifty Bank Index Overview (BANKNIFTY)
The Nifty Bank Index is one of the most widely tracked sectoral indices in India. It represents the performance of the 12 most liquid and large-cap Indian banking stocks listed on the National Stock Exchange (NSE). It serves as a benchmark for the Indian banking sector, and is frequently used by institutional investors, traders, and fund managers.
📌 Key Highlights (as of April 29, 2025)
Index Level: ₹48,511.20
1-Day Change: ▼ 0.97%
52-Week Range: ₹45,828.80 – ₹54,467.35
Market Cap (approx.): ₹40.02 trillion
P/E Ratio: 12.63
P/B Ratio: 1.59
Dividend Yield: 1.31%
Explanation of Support and ResistanceSupport is a price point below the current market price that indicate buying interest. Resistance is a price point above the current market price that indicate selling interest.

MACD TradingThe Moving Average Convergence/Divergence indicator is a momentum oscillator primarily used to trade trends. Although it is an oscillator, it is not typically used to identify over bought or oversold conditions. It appears on the chart as two lines which oscillate without boundaries.

Advanced Database TradingAdvanced database systems try to meet the requirements of present-day database applications by offering advanced functionality in terms of data modeling, multimedia data type support, data integration capabilities, query languages, system features, and interfaces to other worlds.

Divergence Based TradingDivergence occurs when the stochastic oscillator's peaks or troughs disagree with the price. For instance, if the stochastic makes lower highs while the price is rising, it indicates a bearish divergence. Likewise, higher stochastic lows against lower price lows indicate a bullish divergence.

BEL // 2hr Support and ResistanceAs of April 29, 2025, here are the key 2-hour support and resistance levels for Bharat Electronics Ltd (NSE: BEL) based on recent technical analyses:
📈 2-Hour Support and Resistance Levels
Type Level (₹)
Resistance 1 (R1) ₹292.55
Resistance 2 (R2) ₹294.85
Resistance 3 (R3) ₹296.35
Support 1 (S1) ₹286.35
Support 2 (S2) ₹284.05
Support 3 (S3) ₹282.10
These levels are derived from recent intraday price action and can serve as potential reversal or breakout zones for the stock.
📊 Additional Technical Indicators
Relative Strength Index (RSI): Approximately 55.26, indicating a neutral to slightly bullish momentum.
Money Flow Index (MFI): Approximately 50.44, suggesting balanced buying and selling pressure.
Moving Average Convergence Divergence (MACD): Approximately -0.92, indicating a bearish trend.
Average True Range (ATR): Approximately 8.7, indicating moderate volatility.
📌 Key Observations
Resistance Levels: If BEL breaks above ₹292.55, it may face resistance at ₹294.85 and ₹296.35.
Support Levels: A decline below ₹286.35 could lead to further support at ₹284.05 and ₹282.10.
Trend Analysis: The stock is currently trading within a range, with key levels at ₹292.55 on the upside and ₹286.35 on the downside. A breakout above or below these levels could indicate the next directional move.
Please note that these levels and indicators are based on historical data and technical analysis, and actual market conditions may vary. It's advisable to conduct further research or consult with a financial advisor before making investment decisions.

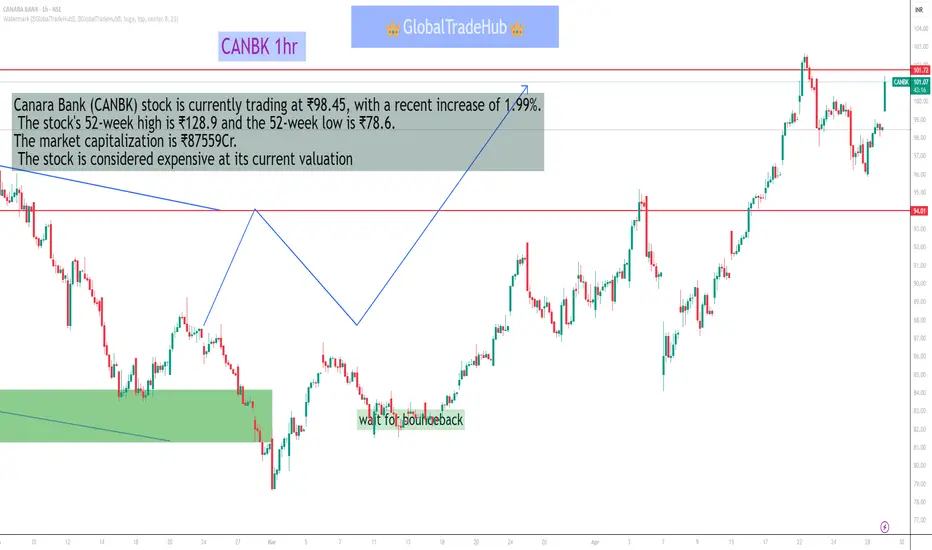
Canara BankAs of April 29, 2025, here are the key 1-hour support and resistance levels for Canara Bank (NSE: CANBK) based on recent technical analyses:
📈 1-Hour Support and Resistance Levels
Type Level (₹)
Resistance 1 (R1) ₹108.05
Resistance 2 (R2) ₹109.51
Support 1 (S1) ₹104.56
Support 2 (S2) ₹102.53
These levels are derived from recent intraday price action and can serve as potential reversal or breakout zones for the stock.
📊 Additional Technical Indicators
Relative Strength Index (RSI): Approximately 60, indicating a neutral to slightly bullish momentum.
Moving Average Convergence Divergence (MACD): Currently in a bearish crossover, suggesting potential downward pressure.
Bollinger Bands: The stock is trading near the upper band, indicating high volatility and potential overbought conditions.
📌 Key Observations
Resistance Levels: If Canara Bank breaks above ₹108.05, it may face resistance at ₹109.51.
Support Levels: A decline below ₹104.56 could lead to further support at ₹102.53.
Trend Analysis: The stock is currently testing the upper resistance zone. A breakout above ₹108.05 could signal a continuation of the upward trend. Conversely, a drop below ₹104.56 may indicate a bearish reversal.
Please note that these levels and indicators are based on historical data and technical analysis, and actual market conditions may vary. It's advisable to conduct further research or consult with a financial advisor before making investment decisions.
Reliance Industries //1 day Support and ResistanceAs of April 29, 2025, here are the key daily support and resistance levels for Reliance Industries Ltd (NSE: RELIANCE) based on recent technical analyses:
📈 Daily Support and Resistance Levels
Level Type Value (₹)
Support 1 (S1) ₹1,191.37
Support 2 (S2) ₹1,177.43
Support 3 (S3) ₹1,153.37
Resistance 1 (R1) ₹1,229.37
Resistance 2 (R2) ₹1,253.43
Resistance 3 (R3) ₹1,267.37
These levels are derived from recent technical analyses and can serve as potential reversal or breakout zones for the stock.
📊 Additional Technical Indicators
Relative Strength Index (RSI): Approximately 48.94, indicating a neutral to slightly bearish momentum.
Moving Averages:
5-Day Simple Moving Average (SMA): ₹1,210.41
50-Day Simple Moving Average (SMA): ₹1,213.72
200-Day Simple Moving Average (SMA): ₹1,216.23
The stock is trading near its short-term moving averages, suggesting a consolidation phase.
📌 Key Observations
Resistance Levels: If Reliance Industries breaks above ₹1,229.37, it may face resistance at ₹1,253.43 and ₹1,267.37.
Support Levels: A decline below ₹1,191.37 could lead to further support at ₹1,177.43 and ₹1,153.37.
Trend Analysis: The stock is currently trading within a range, with key levels at ₹1,229.37 on the upside and ₹1,191.37 on the downside. A breakout above or below these levels could indicate the next directional move.
Please note that these levels and indicators are based on historical data and technical analysis, and actual market conditions may vary. It's advisable to conduct further research or consult with a financial advisor before making investment decisions.

Bank Nifty IndexAs of April 29, 2025, here are the key support and resistance levels for the Bank Nifty Index based on recent technical analyses:
📈 Bank Nifty Support and Resistance Levels:
Type Level (₹)
Resistance 1 (R1) 46,000
Resistance 2 (R2) 46,375
Resistance 3 (R3) 47,200
Support 1 (S1) 45,236
Support 2 (S2) 44,936
Support 3 (S3) 44,100
These levels are derived from recent technical analyses and can serve as potential reversal or breakout zones for the index.
📊 Additional Technical Indicators
Relative Strength Index (RSI): Approximately 52, indicating a neutral to slightly bullish momentum.
Moving Averages:
5-Day Average: ₹53,435.41
50-Day Average: ₹51,815.64
200-Day Average: ₹50,455.01
The stock is trading above its 5-day and 50-day simple moving averages (SMAs), suggesting a short-term bullish trend.
📌 Key Observations
Resistance Levels: If Bank Nifty breaks above ₹46,000, it may face resistance at ₹46,375 and ₹47,200.
Support Levels: A decline below ₹45,236 could lead to further support at ₹44,936 and ₹44,100.
Trend Analysis: The index is currently testing the upper resistance zone. A breakout above ₹46,000 could signal a continuation of the upward trend. Conversely, a drop below ₹45,236 may indicate a bearish reversal.
Please note that these levels and indicators are based on historical data and technical analysis, and actual market conditions may vary. It's advisable to conduct further research or consult with a financial advisor before making investment decisions.

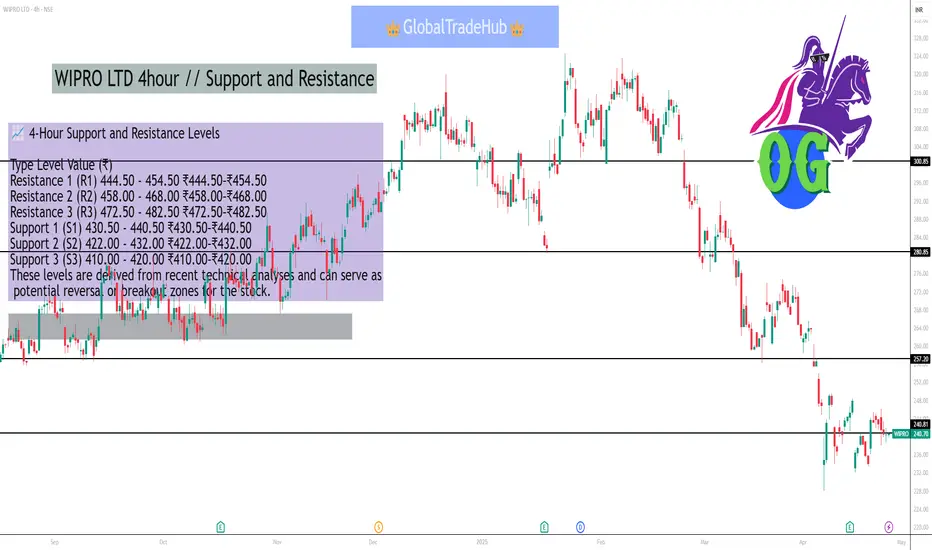
WIPRO LTD 4hour // Support and ResistanceAs of April 29, 2025, here are the key 4-hour support and resistance levels for Wipro Ltd (NSE: WIPRO) based on recent technical analyses:
📈 4-Hour Support and Resistance Levels
Type Level Value (₹)
Resistance 1 (R1) 444.50 - 454.50 ₹444.50–₹454.50
Resistance 2 (R2) 458.00 - 468.00 ₹458.00–₹468.00
Resistance 3 (R3) 472.50 - 482.50 ₹472.50–₹482.50
Support 1 (S1) 430.50 - 440.50 ₹430.50–₹440.50
Support 2 (S2) 422.00 - 432.00 ₹422.00–₹432.00
Support 3 (S3) 410.00 - 420.00 ₹410.00–₹420.00
These levels are derived from recent technical analyses and can serve as potential reversal or breakout zones for the stock.
📊 Additional Technical Indicators
Relative Strength Index (RSI): Approximately 60, indicating a neutral to slightly bullish momentum.
Moving Average Convergence Divergence (MACD): Currently in a bearish crossover, suggesting potential downward pressure.
Bollinger Bands: The stock is trading above the upper band, indicating high volatility and potential overbought conditions.
📌 Key Observations
Resistance Levels: If Wipro breaks above ₹444.50, it may face resistance at ₹458.00 and ₹472.50.
Support Levels: A decline below ₹430.50 could lead to further support at ₹422.00 and ₹410.00.
Trend Analysis: The stock is currently testing the upper resistance zone. A breakout above ₹444.50 could signal a continuation of the upward trend. Conversely, a drop below ₹430.50 may indicate a bearish reversal.
Please note that these levels are based on historical data and technical analysis, and actual market conditions may vary. It's advisable to conduct further research or consult with a financial advisor before making investment decisions.
Adani Green Energy Ltd As of April 29, 2025, here are the key weekly support and resistance levels for **Adani Green Energy Ltd based on recent technical analyses:
📈 Weekly Support and Resistance Levels
| Type | Level | Value (₹) |
|------------|--------|-----------|
| Resistance 1 (R1) | 991.77 | ₹991.77 |
| Resistance 2 (R2)| 1,040.48 | ₹1,040.48 |
| Resistance 3 (R3) | 1,066.17 | ₹1,066.17 |
| Support 1 (S1) | 917.37 | ₹917.37 |
| Support 2 (S2) | 891.68 | ₹891.68 |
| Support 3 (S3) | 842.97 | ₹842.97 |
These levels are derived from recent technical analyses and can serve as potential reversal or breakout zones for the stock.
📊 Additional Technical Indicators
Relative Strength Index (RSI): The RSI is 42.48, indicating that the stock is in the neutral territory, suggesting neither overbought nor oversold conditions.
- Moving Averages:
- 5-Day EMA: ₹825.40
- 50-Day EMA: ₹973.00
- 200-Day EMA: ₹1,335.50
- Current Price: ₹919.15
The stock is trading below its 50-day and 200-day exponential moving averages (EMAs), suggesting a short-term bearish trend.
⚠️ Important Notes
- Market Conditions: The stock has experienced significant volatility, with a 52-week high of ₹1,753.17 and a low of ₹455.37. The recent price decline of 19.92% over the past month indicates increased market uncertainty. )
- **Trading Restrictions**: Please be aware of any trading restrictions or circuit limits that may apply to the stock.
Please note that these levels and indicators are based on historical data and technical analysis, and actual market conditions may vary. It's advisable to conduct further research or consult with a financial advisor before making investment decisions.
