Momentum, Swing & Day Trading StrategiesTrading in financial markets offers a variety of strategies suited to different timeframes, risk appetites, and goals. Among the most popular trading methodologies are Momentum Trading, Swing Trading, and Day Trading. These strategies, while overlapping in some aspects, are distinct in their approach to capitalizing on market opportunities. Each appeals to a particular type of trader and requires different skills, tools, and psychological traits.
This guide provides a deep dive into these three trading styles, helping aspiring traders understand how they work, what tools are needed, and how to determine which might be the best fit for their goals.
1. Momentum Trading
Definition
Momentum trading is a strategy that seeks to capitalize on the strength of existing market trends. Momentum traders aim to buy securities that are moving up and sell them when they show signs of reversing—or go short on securities that are moving down.
The underlying belief is that stocks which are already trending strongly will continue to do so in the short term, as more traders jump on the bandwagon.
Core Principles
Trend Continuation: Assets that exhibit high momentum will likely continue in their direction for a while.
Volume Confirmation: High volume typically confirms the strength of momentum.
Short-term holding: Positions are held for a few minutes to several days.
Relative Strength: Comparing the performance of securities to identify leaders and laggards.
Example Strategy
Identify stocks with high relative volume (5x or more average volume).
Look for breakouts above recent resistance with strong volume.
Enter the trade once confirmation occurs (price closes above resistance).
Use a trailing stop-loss to ride the trend while locking in gains.
2. Swing Trading
Definition
Swing trading involves taking trades that last from a few days to a few weeks in order to capture short- to medium-term gains in a stock (or any financial instrument). Swing traders primarily use technical analysis due to the short-term nature of the trades but may also use fundamental analysis.
This strategy bridges the gap between day trading and long-term investing.
Core Principles
Trend Identification: Traders look for mini-trends within larger trends.
Support & Resistance: Entry and exit points are often based on technical levels.
Risk-to-Reward Ratios: Focus on setups with favorable risk/reward profiles (typically 1:2 or better).
Market Timing: Entry and exit are more strategic and less frequent than day trading.
Example Strategy
Scan for stocks in a clear uptrend or downtrend.
Wait for a pullback to a key moving average or support zone.
Enter on a bullish/bearish reversal candlestick pattern.
Set stop-loss just below support or recent swing low.
Set target profit at next resistance level or use a trailing stop.
3. Day Trading
Definition
Day trading is a strategy that involves buying and selling financial instruments within the same trading day. Traders aim to exploit intraday price movements and typically close all positions before the market closes to avoid overnight risks.
This strategy demands intense focus, fast decision-making, and a strong grasp of technical analysis.
Core Principles
Speed: Executing trades rapidly and precisely.
Volume & Liquidity: Only liquid assets are traded to ensure quick execution.
Leverage: Often used to increase potential profits (and losses).
Volatility: The more a stock moves, the better for day trading.
Example Setup
Identify a high-volume stock with a news catalyst.
Wait for an opening range breakout.
Enter long/short based on breakout with tight stop-loss.
Set profit targets based on support/resistance or risk-reward ratio.
Tools Commonly Used Across All Strategies
Regardless of the strategy, traders typically use the following tools:
Charting Platforms: TradingView, ThinkorSwim, MetaTrader, NinjaTrader.
Screeners: Finviz, Trade Ideas, MarketSmith.
News Feed Services: Benzinga Pro, Bloomberg, CNBC, Twitter/X.
Brokerage Platforms: Interactive Brokers, TD Ameritrade, E*TRADE, Fidelity.
Risk Management Software: Used to calculate position sizing, stop losses.
Risk Management: The Cornerstone of All Strategies
No matter the strategy, risk management is essential. Key practices include:
Position Sizing: Never risk more than 1–2% of capital per trade.
Stop-Loss Orders: Automatically exits a losing trade at a predefined level.
Risk-Reward Ratio: Most successful traders seek at least a 1:2 ratio.
Diversification: Avoid overexposing to one sector or asset.
Conclusion: Which Strategy is Right for You?
Choosing the right trading strategy depends on your:
Time availability: Can you watch the markets all day?
Capital: Can you meet margin and liquidity requirements?
Personality: Are you calm under pressure, or do you prefer slower decision-making?
Experience level: Some strategies are more forgiving and suitable for beginners.
HDFCBANK
Trading Psychology & Risk Management🧠 Part 1: Trading Psychology
Trading psychology refers to the emotional and mental aspects that influence trading decisions. It includes traits like discipline, patience, confidence, and emotional control.
✅ Traits of Successful Traders
1. Discipline
Following your trading plan no matter what.
Not deviating due to emotions or "gut feelings".
2. Patience
Waiting for the right setup to occur.
Not chasing trades or forcing market entries.
3. Emotional Resilience
Being able to handle losses without emotional reactions.
Not reacting with fear, revenge, or frustration.
💼 Part 2: Risk Management
Risk management ensures that you survive and thrive in trading, even when the market moves against you. It’s not about avoiding losses — it’s about limiting them so that no single trade can wipe out your account.
🧮 Core Concepts in Risk Management
1. Risk Per Trade
Limit risk to 1–2% of total capital per trade.
For example, on a ₹1,00,000 account, risk only ₹1,000–₹2,000 per trade.
2. Position Sizing
Use your stop-loss level to determine how many shares/contracts to trade.
Market Types1. Stock Markets
The stock market is perhaps the most well-known type of financial market. It provides a platform for buying and selling shares of publicly traded companies.
Types of Stock Markets
Primary Market: Where new shares are issued (IPOs).
Secondary Market: Where existing shares are traded among investors.
2. Forex (Foreign Exchange) Markets
The foreign exchange market is the largest and most liquid financial market in the world, with daily trading volumes exceeding $6 trillion.
How It Works
Currencies are traded in pairs (e.g., EUR/USD), where one currency is exchanged for another. The forex market is decentralized, operating 24 hours a day across major global financial centers.
3. Commodities Markets
Commodities markets allow traders to buy and sell raw materials or primary agricultural products.
Categories
Hard commodities: Gold, silver, oil, natural gas
Soft commodities: Coffee, cocoa, wheat, cotton
4. Derivatives Markets (Futures and Options)
Derivatives are financial instruments whose value is derived from an underlying asset such as stocks, commodities, currencies, or indices.
Futures
Contracts obligating the buyer to purchase an asset (or seller to sell) at a predetermined price at a specified time.
Options
Contracts that give the right, but not the obligation, to buy/sell an asset at a set price within a specific period.
AI and Algorithmic TradingWhat Is Algorithmic Trading?
Algorithmic trading (or “algo trading”) involves using computer programs to follow a defined set of instructions — an algorithm — to place, manage, and close trades. These rules are based on parameters such as timing, price, volume, and even complex mathematical models.
Key Benefits of Algorithmic Trading:
Speed: Algorithms can analyze market data and execute trades in microseconds.
Accuracy: Eliminates human error in order placement.
Backtesting: Strategies can be tested on historical data before going live.
Emotionless Trading: Algorithms remove the influence of greed, fear, and hesitation.
The Rise of AI in Trading
Artificial Intelligence takes algorithmic trading a step further. Traditional algo trading relies on predefined rules, but AI allows a system to learn from data and adapt over time. This dynamic approach enables smarter trading decisions, especially in volatile or non-linear market environments.
AI Techniques Used in Trading:
Machine Learning (ML) – Supervised and unsupervised models for prediction and classification.
Deep Learning – Neural networks for recognizing patterns in complex data sets like candlestick charts, news feeds, and audio transcripts.
Natural Language Processing (NLP) – To analyze news, social media sentiment, earnings reports, and tweets.
Reinforcement Learning – Agents learn optimal actions through trial and error over time.
The Market SentimentPCR (Put-Call Ratio) – The Market Sentiment Radar
✅ What is PCR?
PCR stands for Put-Call Ratio, a popular sentiment indicator in the options market. It tells you whether traders are buying more puts (bearish bets) or more calls (bullish bets).
What is IV?
Implied Volatility (IV) is the market’s forecast of how volatile a stock or index might be in the future. It doesn’t tell direction, but only how fast or wild the moves could be.
✅ How does IV affect option prices?
Higher IV = Higher Option Premiums
Lower IV = Lower Option Premiums
Think of IV as the “air” in a balloon. More air (IV) = bigger premium (balloon).
✅ Why IV is Crucial:
Entry Timing: You want to buy options when IV is low (cheap premiums).
Exit Strategy: You want to sell options when IV is high (expensive premiums).
IV spikes before big events – like earnings, RBI policy, Budget, Fed meetings, etc.
✅ Example:
You buy a Nifty 20000 CE when IV is 14%. Then IV jumps to 22% even if price doesn’t move much.
Your option gains value because of IV expansion (called Vega Gain).
✅ IV vs HV:
IV: What market expects.
HV (Historical Volatility): What already happened.
When IV > HV = Overpriced Options.
When IV < HV = Underpriced Options.
VIX (Volatility Index) – The Fear Gauge of India
✅ What is VIX?
VIX is the Volatility Index, often called the "Fear Index". In India, we use India VIX, which measures expected volatility of Nifty 50 over the next 30 days.
✅ How is VIX calculated?
India VIX is derived from the option prices of Nifty 50 – mainly ATM (At-The-Money) options. It reflects market’s fear level or confidence.
✅ Interpretation:
VIX < 12 → Calm, low volatility (complacent market)
VIX 12–18 → Normal volatility
VIX > 20 → High fear, high volatility
🔁 VIX is inversely correlated with Nifty:
VIX rises → Nifty tends to fall
VIX falls → Nifty tends to rise
✅ Smart Usage of VIX:
Options Selling: When VIX is high, sell far OTM options (premium decay faster).
Options Buying: When VIX is low, buy options expecting breakout or event-driven moves.
Event Hedge: Spike in VIX signals market is anticipating big movement – ideal for straddle/strangle trades.
✅ Real Market Scenario:
During Budget day or unexpected geopolitical news, VIX may shoot up from 13 to 22 in a day.
Smart traders pre-position strangles or reduce exposure when VIX hits extremes.
🔷 Putting It All Together – Mastery Strategy
Let’s combine PCR, IV, and VIX for smart institutional-level setups.
🔹 1. PCR + VIX Confluence
PCR High + VIX High = Too much fear → Possible market bottom → Buy signal
PCR Low + VIX Low = Overconfidence → Possible correction → Sell signal
🔹 2. IV Crush Trade
Before event (high IV) → Sell options → Capture premium decay post-event
After event (low IV) → Buy directional options → Lower premium, better RR
🔹 3. Directional Bet with PCR + IV
Rising PCR + Rising IV = Building bearish pressure → Bearish bias
Falling PCR + Falling IV = Bullish optimism → Bullish bias

Technical Analysist and fundamental analysist What is Technical Analysis?
Technical Analysis involves studying historical price charts, volume data, and market indicators to forecast future price movements. It operates on the belief that "price reflects all known information." Hence, instead of looking at a company's balance sheet, a technical analyst focuses on patterns, trends, and momentum.
🔹 Key Principles of Technical Analysis
Market Discounts Everything: All news, earnings, and fundamentals are already reflected in the price.
Price Moves in Trends: Markets move in trends – uptrend, downtrend, or sideways – and tend to persist over time.
History Repeats Itself: Human behavior in markets follows patterns that tend to repeat, which technical analysis aims to exploit.
Strengths of Technical Analysis
Ideal for short-term traders and scalpers.
Uses real-time data, not delayed financial reports.
Visual, intuitive, and good for identifying precise entry/exit levels.
Applies universally across asset classes.
What is Fundamental Analysis?
Fundamental Analysis seeks to evaluate the intrinsic value of a security by analyzing financial statements, economic factors, industry conditions, and management performance. It’s more common among long-term investors, like Warren Buffett, who believe in buying undervalued stocks and holding them for years.
🔹 Key Principles of Fundamental Analysis
Every stock has an intrinsic value – a “true” value based on fundamentals.
The market may misprice stocks temporarily – creating opportunities.
Strong financials lead to long-term success – even if the short-term market fluctuates.
Strengths of Fundamental Analysis
Helps identify long-term investment opportunities.
Less volatile and emotional than technical trading.
Supports strategic investing based on actual business performance.
Useful for determining the true value of a stock.

Hdfc Bank: Go Short till 1940.50 stop 2053Hdfc Bank consolidation is happening and it may retrace down to it's trend support line Near 1940. Keep an eye towards rejection 2030 where it may get hurdle and nay fall to take a support.
It's a regular pattern for this script.. Ut recently made anew high on the charts.
Hurdle 2035-2050
Support 1940.50

Institutional Trading Strategies🔍 What Is Institutional Trading?
Institutional trading refers to how large financial institutions, such as hedge funds, investment banks, mutual funds, insurance companies, and pension funds, buy and sell large volumes of stocks, options, futures, and other financial instruments in the market.
Unlike retail traders (individual traders), institutions trade with massive capital, often in millions or billions of dollars. Their actions can move the market, and they use advanced tools, data, and strategies to protect their capital and maximize profit.
🏦 Who Are the Institutional Players?
Here are examples of institutional traders:
BlackRock
Vanguard
JP Morgan
Goldman Sachs
Citadel
Morgan Stanley
HDFC AMC / SBI MF (India context)
These entities manage huge portfolios for clients or for themselves and use highly strategic methods to execute trades.
⚙️ Why Are Their Strategies Different?
Institutional traders have several advantages over retail traders:
Access to better data (real-time order flow, economic models)
Advanced technology (high-frequency trading algorithms)
Lower transaction costs (thanks to bulk volume deals)
Connections (direct access to liquidity providers, brokers)
Skilled teams (analysts, quant traders, risk managers)
But there’s a big challenge: Their trades are so large, they can’t buy or sell in one go. If they do, they’ll cause huge price moves (called slippage). So they use smart strategies to enter and exit positions quietly without alerting the market.
🧠 Core Institutional Trading Strategies
Here are the most important trading strategies used by institutions:
1. 📊 Volume-Based Trading (Accumulation & Distribution)
Institutions use a strategy of accumulating large positions over time (buying slowly) and later distributing (selling slowly). This is done to hide their true intent from the market.
Accumulation Phase: Buying gradually in small chunks to avoid price spikes.
Distribution Phase: Selling in a quiet way so they don’t crash the price.
They might accumulate shares for weeks or months, often using dark pools or algorithms to keep their activity hidden.
2. 🏦 Order Flow Analysis / Tape Reading
Institutional traders track real-time order flow — meaning they study the buy/sell pressure using tools like:
Level 2 (market depth)
Time & sales (ticker tape)
Footprint charts
Delta volume
They watch where large orders are being placed, pulled, or spoofed, giving insight into what other big players are doing.
3. 💻 Algorithmic & High-Frequency Trading (HFT)
Institutions use algorithms (algos) to place thousands of trades per second. These bots follow specific rules based on:
Market trends
Arbitrage opportunities
Statistical models
HFT strategies are extremely fast, aiming to profit from tiny price differences in milliseconds.
4. 🧱 Quantitative Trading
Quant funds like Renaissance Technologies or D.E. Shaw use math, coding, and machine learning to create models that predict price movements.
They may build systems that factor in:
Price action history
News sentiment
Economic indicators
Correlation between assets
Volatility, interest rates
These are not human trades – the models execute trades based on data patterns.
5. 🧩 Options-Based Hedging Strategies
Institutions use options to hedge, speculate, or generate income.
Common techniques:
Protective Puts (insurance for falling stocks)
Covered Calls (collect premium for sideways movement)
Calendar Spreads, Iron Condors, etc. (advanced strategies for theta/gamma/vega exposure)
They often create multi-leg options positions to reduce risk and take advantage of implied volatility.
6. 🏰 Dark Pools Trading
Institutions often trade through dark pools, which are private exchanges not visible to the public. These are used to place large orders without revealing size, so other traders don’t front-run their positions.
Example: An institution may buy 1 million shares through a dark pool instead of a public exchange like NSE or NYSE.
7. 📍 Sector Rotation Strategy
Institutions frequently rotate their capital between sectors based on economic cycles.
In recession: move to defensive stocks (FMCG, Pharma)
In recovery: switch to cyclicals (automobile, banking, infrastructure)
They allocate billions of dollars based on macro themes, earnings cycles, and geopolitical shifts.
8. 🔁 Rebalancing Portfolios
Large funds constantly rebalance their portfolios — buying/selling assets to maintain target allocations. This causes monthly/quarterly flows in stocks or ETFs, which can influence price significantly.
Traders often try to anticipate these flows and trade in the same direction.
📉 How Institutional Traders Enter Positions Quietly
Let’s break down a common stealth strategy:
📘 Step-by-Step Accumulation Example:
Stock ABC trades at ₹100.
Institution wants to buy 5 lakh shares.
If they buy all at once, the price may jump to ₹110+.
So they:
Break order into 5,000 share blocks
Buy at different times of day
Use different brokers/accounts to hide volume
Buy some shares in dark pool
Use algorithm to monitor market depth
After 2 weeks, they complete the buy at an average price of ₹101.
Once they have the position, they might release news or earnings upgrades to support the price.
They hold till price hits their target (say ₹130), then start distributing in small blocks again.
👁 How to Spot Institutional Activity as a Retail Trader?
While you can’t directly see them, you can learn to follow the footprints:
🔍 Clues of Smart Money Activity:
Unusual volume on low-news days
Breakout with high volume but small price move
Price holding key levels repeatedly (support/resistance)
Option open interest buildup
Low volatility periods followed by volume spike
Multiple rejections from the same price zone (indicating accumulation/distribution)
🧠 Mindset of Institutional Traders
What makes institutions successful is not just tools or money — it’s their discipline, planning, and patience. Key principles:
Capital preservation first
Risk-to-reward must be favorable
Avoid emotional decisions
Backtesting before executing strategies
Long-term consistency over short-term wins
📌 Summary – What Can We Learn?
Institutional trading is not magic — it’s structured, logical, and data-driven. As a retail trader, you can’t beat them in speed or capital, but you can:
✅ Learn how they operate
✅ Use similar risk management
✅ Follow the smart money
✅ Avoid emotional trades
✅ Focus on long-term skill building
🏁 Final Thought
The goal isn’t to copy institutional trades, but to understand their footprint and align your trades with their flow. Most successful retail traders grow by observing how smart money moves, then reacting wisely.
You don’t need ₹100 crore to trade like an institution — you need a strategic mindset, discipline, and a plan.

Options Trading Strategies📌 What Are Options in Trading?
Before we get into strategies, let’s understand what options actually are.
In the simplest form, options are contracts that give a trader the right, but not the obligation, to buy or sell an asset (like a stock, index, or commodity) at a specific price before or on a specific date.
There are two main types of options:
Call Option – Gives you the right to buy something at a set price.
Put Option – Gives you the right to sell something at a set price.
These tools can be used to hedge, speculate, or generate income. Now that you know what options are, let’s go deeper into strategies.
🎯 Why Use Options Strategies?
Options trading is not just about buying Calls and Puts randomly. It’s about smart combinations and planned risk management. With the right strategies, you can:
Profit in up, down, or sideways markets
Limit your losses
Leverage small capital
Hedge your stock or portfolio
Earn regular income
Let’s now dive into some popular options trading strategies—from basic to advanced—with examples.
✅ 1. Covered Call Strategy
💡 Use When: You own a stock and expect neutral or slightly bullish movement.
You own shares of a stock and you sell a Call Option on the same stock. You receive a premium from selling the Call, which gives you extra income even if the stock doesn’t move.
📘 Example:
You own 100 shares of Reliance at ₹2800. You sell a 2900 Call Option and receive ₹30 per share as premium.
If Reliance stays below ₹2900 – You keep your stock and the premium.
If Reliance goes above ₹2900 – Your stock gets sold (you deliver), but you still profit from stock rise + premium.
✅ Pros:
Earn extra income
Lower risk than buying naked calls
❌ Cons:
Limited upside
Need to own stock
✅ 2. Protective Put Strategy
💡 Use When: You own a stock but want to protect from downside risk.
Here, you buy a Put Option along with owning the stock. It acts like insurance – if the stock crashes, the Put will rise in value.
📘 Example:
You buy HDFC Bank shares at ₹1700 and buy a 1650 Put Option for ₹25.
If HDFC drops to ₹1600 – Your stock loses ₹100, but your Put may gain ₹50–₹75.
If HDFC goes up – You lose only the premium ₹25.
✅ Pros:
Protects your portfolio
Peace of mind in volatile markets
❌ Cons:
You pay a premium (like insurance)
Can eat into profits
✅ 3. Bull Call Spread
💡 Use When: You are moderately bullish on a stock.
You buy a Call Option at a lower strike and sell another Call Option at a higher strike (same expiry). This reduces your cost and risk.
📘 Example:
Buy Nifty 22500 Call at ₹100
Sell Nifty 23000 Call at ₹50
Your net cost = ₹50
Max profit = ₹500 (if Nifty ends above 23000)
✅ Pros:
Lower cost than naked Call
Defined risk and reward
❌ Cons:
Limited profit potential
✅ 4. Bear Put Spread
💡 Use When: You are moderately bearish.
You buy a Put at higher strike and sell another Put at lower strike. This is just like Bull Call, but for falling markets.
📘 Example:
Buy Bank Nifty 50000 Put at ₹120
Sell 49500 Put at ₹60
Net Cost = ₹60
Max Profit = ₹500
✅ Pros:
Risk-managed way to profit in downtrend
❌ Cons:
Limited profits if market crashes heavily
✅ 5. Iron Condor
💡 Use When: You expect the market to stay sideways or within a range.
It’s a neutral strategy involving four options:
Sell 1 lower Put, Buy 1 far lower Put
Sell 1 upper Call, Buy 1 far upper Call
📘 Example:
Sell 22500 Put
Buy 22200 Put
Sell 23000 Call
Buy 23300 Call
You receive a net premium. If the index stays between 22500–23000, you make full profit.
✅ Pros:
Profits in range-bound market
Low risk, fixed reward
❌ Cons:
Requires margin
Complicated setup
✅ 6. Straddle Strategy
💡 Use When: You expect a big move in either direction, but not sure which.
Buy both a Call and a Put at the same strike price and expiry. One side will definitely move.
📘 Example:
Buy Nifty 23000 Call at ₹80
Buy Nifty 23000 Put at ₹90
Total cost = ₹170
If Nifty makes a big move (up or down), one side can explode in value.
✅ Pros:
Unlimited potential if market breaks out
Great for news events
❌ Cons:
Expensive to enter
Needs big movement to profit
✅ 7. Strangle Strategy
💡 Use When: You expect a big move, but want to reduce cost compared to straddle.
Buy an Out-of-the-Money Call and Put.
📘 Example:
Buy Nifty 23200 Call at ₹40
Buy Nifty 22800 Put at ₹50
Total cost = ₹90
You still profit from big movement, but cheaper than a straddle.
✅ Pros:
Lower cost
Profits from big moves
❌ Cons:
Requires even larger movement than straddle
✅ 8. Short Straddle (for experts)
💡 Use When: You think the market will stay flat (low volatility).
Sell a Call and a Put at the same strike. You earn double premium.
⚠️ Risk: Unlimited risk if market moves too much!
This strategy is not for beginners. You need tight stop losses or hedges.
🔐 Risk Management Is Key
No matter which strategy you use:
Always define your maximum risk and reward.
Avoid taking naked positions without hedging.
Use stop losses and trailing SLs.
Don’t bet your whole capital – use position sizing.
Avoid trading right before major events unless you understand the risks.
Strangle
🤔 Real-Life Example (Simple Breakdown)
Let’s say the market is range-bound and Nifty is stuck between 22500–23000 for weeks. You can go with an Iron Condor:
Sell 22500 Put at ₹80
Buy 22200 Put at ₹40
Sell 23000 Call at ₹70
Buy 23300 Call at ₹35
Net Premium = ₹75
If Nifty expires between 22500–23000, you get full ₹75 profit per lot. If it breaks the range, losses are capped due to hedges.
💬 Final Thoughts
Options trading strategies are like different weapons in your trading arsenal. But using them without understanding or discipline is dangerous. Always know:
What is your market view?
What is your max risk?
How will you manage losses?
The smartest traders don’t gamble—they plan. They treat options like a business, not a lottery ticket.
So whether you’re trading with ₹5000 or ₹5 lakhs, always use a strategy with:
✔ Proper Risk-Reward
✔ Defined Exit Plan
✔ Strong Logic (not emotion)
BTCUSD 1D TimeframeBitcoin is trading near $117,800 – $118,400
It’s in a sideways consolidation zone after a strong uptrend
📊 Technical Summary
📈 Trend Direction:
Primary Trend: Bullish (long-term)
Short-Term Trend: Sideways to slightly bullish
Structure: Higher highs and higher lows still intact
🔍 Key Support & Resistance Levels
🟢 Support Zones:
$117,000 — Immediate support zone
$115,000 — Minor demand zone
$112,000 — Key swing low support
$108,000 – $110,000 — Strong base if correction deepens
🔴 Resistance Zones:
$119,000 — Current price ceiling
$121,000 — Breakout target
$123,000 – $125,000 — All-time high resistance area
🧠 Indicators Overview
📌 RSI (Relative Strength Index):
Around 58–60
Shows moderate bullishness — not overbought
📌 MACD (Moving Average Convergence Divergence):
MACD line above signal line, but momentum is weakening
Indicates potential slowing of bullish push
📌 Moving Averages:
20-day EMA: Below price — short-term support
50-day EMA: Also below — confirms mid-term uptrend
200-day EMA: Far below — strong long-term bullish signal
🕯️ Candlestick Behavior
Recent candles are small-bodied: suggests indecision
Wicks both sides: market waiting for next trigger
No bearish reversal patterns visible yet

SENSEX 1D TimeframeClosing Value: ₹81,463.09
Day Change: ▼ 721.08 points (−0.88%)
Opening Level: ₹82,065.76
Day's High: ₹82,069.51
Day's Low: ₹81,397.69
Intraday Range: ~₹672 points swing
🧭 Market Context
Sensex fell nearly 1% in a single session, indicating a short-term pullback or profit-booking.
The fall was led by major banking, IT, and financial stocks.
Broader market sentiment turned cautious amid weak domestic cues and global uncertainty.
Several heavyweight stocks saw sharp declines, with a few dropping more than 5% in a single day.
🕵️♂️ Technical Perspective (1D Timeframe)
The daily candle likely formed a strong bearish body, signaling selling pressure.
The index is still trading well above its key moving averages (e.g., 50-day, 200-day), but this drop shows possible reversal signals.
Immediate support lies around ₹81,200–81,000, while resistance remains near the ₹82,500–83,000 zone.
🔍 Outlook Ahead
If weakness continues, the index may retest the ₹80,500–81,000 range.
A rebound above ₹82,000 with volume could reignite bullish sentiment.
Keep an eye on FII/DII flows, global indices, and upcoming earnings for direction.

Trading Master Class With Experts🎓 Trading Master Class With Experts
Join a premium learning experience led by real market experts and institutional-level traders.
This is not just theory—it's real-world strategy, live insights, and powerful execution.
🔥 What You’ll Learn:
Advanced Price Action – Master structure, trends & breakouts
Institutional Trading Tactics – Learn how the big players move
Options & Derivatives – Trade with smart setups & defined risk
Strategy Building – From scalping to swing setups
Trader Psychology – Build discipline, mindset & consistency
Risk Management – Professional capital protection strategies
💡 Why Join?
✅ Learn from real experts
✅ Get access to institutional methods
✅ Trade with confidence, clarity & control
✅ Perfect for intraday, swing, and option traders
📌 Learn. Apply. Profit.
This is your step toward trading like a pro.

Option Trading💼 Option Trading 📉📈
Leverage. Flexibility. Strategic Advantage.
Option Trading is a powerful segment of the financial markets where traders and investors use derivative contracts—known as options—to speculate, hedge, or generate income. Unlike traditional stock trading, options give you the right (but not the obligation) to buy or sell an asset at a predetermined price, within a specific time frame.
It’s a strategic tool used by everyone from retail traders to hedge funds to gain exposure with limited risk and amplified potential.
🔍 Key Concepts:
✅ Call Option – Gives the right to buy an asset at a fixed price (strike)
✅ Put Option – Gives the right to sell an asset at a fixed price
✅ Premium – The price paid to buy the option contract
✅ Strike Price – The level at which the option can be exercised
✅ Expiry Date – The date on which the contract expires
✅ In-the-Money / Out-of-the-Money – Describes the moneyness of a position relative to current price
⚙️ Why Trade Options?
🔹 Leverage – Control larger positions with smaller capital
🔹 Flexibility – Bullish, bearish, neutral—there’s a strategy for every view
🔹 Defined Risk – Max risk = premium paid (in buying options)
🔹 Income Generation – Sell options (covered calls, credit spreads) for passive income
🔹 Hedging – Protect existing stock positions from volatility or loss
Option trading isn’t gambling—it’s a game of precision, risk management, and market insight. To succeed, you need to master:

Institutional Trading🏛️ Institutional Trading 📊
Trade Like the Smart Money
Institutional Trading refers to the high-volume, data-driven buying and selling of financial assets by large entities such as hedge funds, banks, mutual funds, insurance companies, pension funds, and proprietary trading firms. Unlike retail traders, institutional traders have access to advanced tools, deep liquidity, insider networks, and strategic research that give them a significant edge in the market.
These market participants don’t chase price—they move it. Their trades are structured, well-researched, and often hidden from the public eye through techniques like iceberg orders, dark pools, and algorithmic execution.
🔍 Key Features of Institutional Trading:
✅ Volume & Scale: Trades are executed in massive quantities, often spread across multiple venues to avoid detection.
✅ Market Influence: Institutions drive trends and liquidity. Their positioning can define entire market cycles.
✅ Strategic Execution: Every move is planned, including accumulation, distribution, and fakeouts to trap retail participants.
✅ Advanced Tools: They use sophisticated algorithms, AI-based models, high-frequency data, and institutional-grade charting.
✅ Focus on Risk-Reward: Strict risk management and portfolio balancing govern every trade decision.
🚀 Elevate Your Trading:
Learning Institutional Trading isn’t about copying big players—it’s about thinking like them, reading the market through their lens, and upgrading your strategy with smart money logic.
📈 Trade with structure. Trade with logic. Trade like an institution.

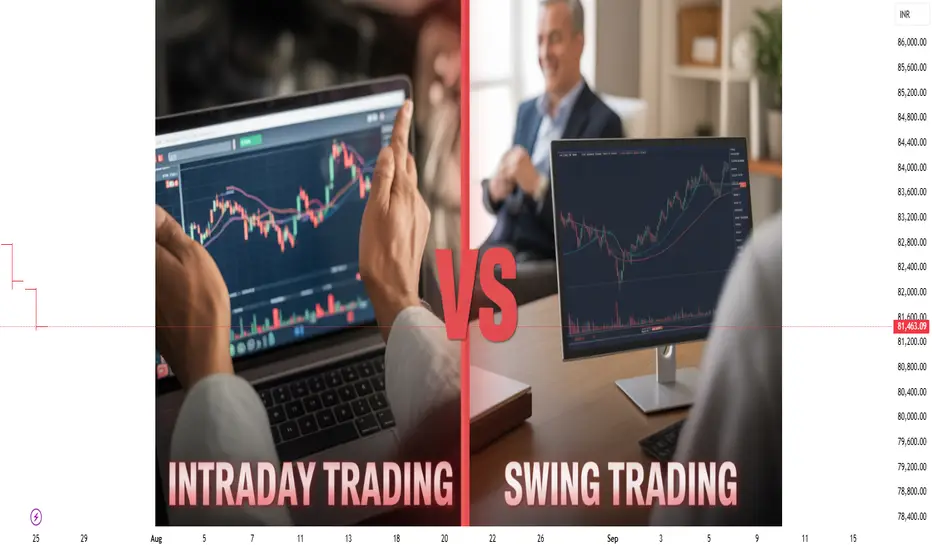
Intraday Trading vs Swing Trading🕐 1. What is Intraday Trading?
Intraday trading (also called day trading) is all about buying and selling stocks within the same day. That means you enter and exit the trade before the market closes—no matter what.
You're not holding positions overnight. You’re just capturing small price moves during the trading day.
Example:
Let’s say you buy 100 shares of Reliance at ₹2,800 at 10:00 AM and sell them at ₹2,820 by 1:30 PM. That’s an intraday trade—you made a quick profit in a few hours.
🕓 2. What is Swing Trading?
Swing trading means holding a trade for a few days to a few weeks. You’re not looking for quick moves, but for slightly longer trends in the stock price.
Swing traders try to catch a “swing” in price—that could be an upward trend or a downward trend.
Example:
Let’s say you buy HDFC Bank at ₹1,450 on Monday after seeing a bullish chart. Over the next 5 days, it moves up to ₹1,520. You sell it on Friday. That’s swing trading.
⚙️ 4. Tools & Strategies Used
🔸 Intraday Trading Tools:
5-min, 15-min candlestick charts
Indicators: VWAP, RSI, MACD, Supertrend
News-based scalping
Volume spikes
Price action patterns (breakouts, breakdowns)
🔹 Swing Trading Tools:
Daily & 1-hour charts
Indicators: RSI (14), MACD, Bollinger Bands
Chart patterns: Cup & Handle, Flag, Head & Shoulders
Support-resistance levels
Sector rotation or earning-based moves
📈 5. Pros & Cons of Intraday Trading
✅ Pros:
No overnight risk (no worries about global news hitting your stock overnight)
Frequent opportunities to make quick profits
Capital can be reused multiple times a day
Brokers offer high leverage (low capital, high exposure)
❌ Cons:
Very stressful and time-consuming
Needs fast decision-making and discipline
Big losses can happen quickly without proper stop-loss
Overtrading is a common trap
📊 6. Pros & Cons of Swing Trading
✅ Pros:
No need to watch charts all day
Ideal for people with jobs or other commitments
Less emotional pressure
More room for trend to play out
Works well in trending markets
❌ Cons:
Overnight risk from gap-ups or gap-downs
Requires patience—sometimes no trades for days
Wider stop-loss may mean higher losses if wrong
May miss fast intraday opportunities
💡 7. Who Should Choose What?
🧠 Choose Intraday Trading if:
You can dedicate 5–6 hours a day to watching the market
You are fast with decisions and execution
You can handle pressure, speed, and losses
You are ready to follow strict discipline and exit rules
You're okay with small profits (and small losses) daily
💼 Choose Swing Trading if:
You have a job or business and can't watch the market all day
You’re okay with holding stocks overnight
You prefer calm trading and less screen time
You're okay with waiting days or weeks for a trade to work out
You want to combine technical + some fundamental analysis
💸 8. Real-World Example
Imagine two friends, Rahul and Neha.
Rahul is an intraday trader. He sits in front of 3 screens from 9:15 to 3:30. He trades 5–10 times a day. Some days he makes ₹2,000, some days he loses ₹1,500. He needs to be sharp, fast, and emotionally strong.
Neha is a swing trader. She checks charts at night, finds 1–2 good stocks, and places limit orders. She holds her positions for 5–7 days. Her average profit is ₹5,000 per trade, but she takes fewer trades.
Both are traders, but with different lifestyles and psychology.
🧮 9. What About Brokerage and Tax?
Intraday trading has higher brokerage and STT (Securities Transaction Tax) due to frequent trades.
Swing trading involves delivery trades, so less brokerage but includes DP charges and short-term capital gains tax if held under 1 year.
🛠️ 10. Can You Do Both?
Yes! Many experienced traders use both styles:
Intraday for quick income and excitement
Swing for slower, more stable profits
But if you're a beginner, it’s best to pick one style and master it before mixing.
✅ Final Conclusion
There’s no winner between intraday and swing trading — both work when done with planning, discipline, and a solid strategy.
👉 Choose intraday if you enjoy speed, adrenaline, and real-time action.
👉 Choose swing if you prefer peace, patience, and flexibility.
Both require:
Risk management
Emotional control
Strategy and learning from mistakes
Your personality, time availability, and goal will tell you which path is best.
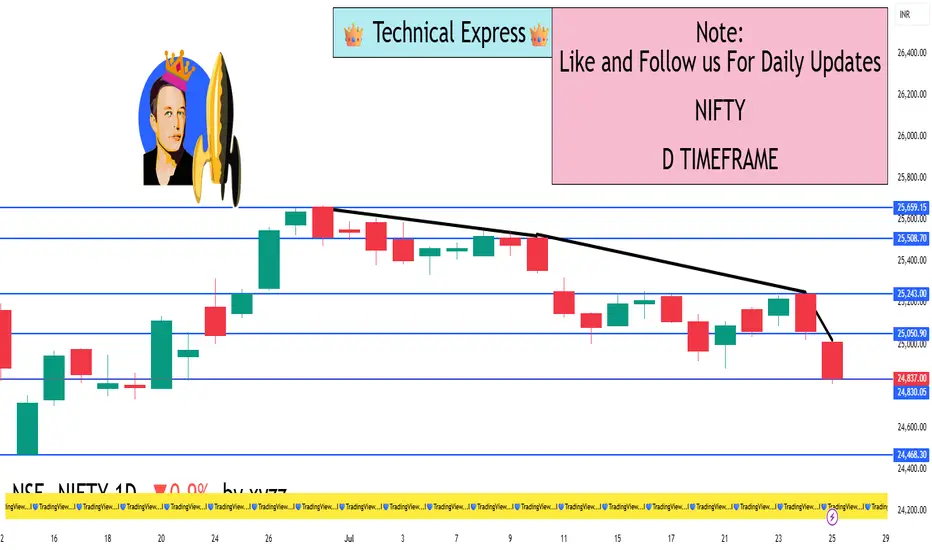
NIFTY 1D TimeframeClosing Price: 24,837.00
Net Change: −225.10 points (−0.90%)
Opening: 24,981.35
High: 25,008.90
Low: 24,770.85
Trend: Bearish
📊 Technical Overview
✅ Candle Type:
Bearish candle formed with a long body and small wicks.
Indicates strong selling pressure throughout the day.
🔻 Support Zones:
24,750 – Immediate support (tested on 25 July)
24,600 – Stronger support zone
24,400 – Medium-term support from early July
🔺 Resistance Zones:
24,900 – Immediate resistance
25,000 – Psychological resistance
25,150–25,300 – Strong resistance zone
📈 Indicators Summary:
RSI: Likely near 45 – showing weakening momentum
MACD: Bearish crossover continues – indicating downward trend
Volume: Slightly higher than average – confirms active selling
🧠 Market Sentiment:
Sentiment remains cautious and bearish.
Selling seen in major sectors like Auto, Energy, FMCG, and Banking.
Only Pharma showed relative strength.
Global cues and foreign investor selling weighed on market sentiment.
This marks the fourth straight weekly loss for the Nifty index.
✅ Conclusion:
Nifty is in a short-term downtrend, unable to sustain above 25,000.
If 24,750 is broken decisively, the next target could be 24,600 or lower.
Bulls must reclaim and hold above 25,000–25,150 to reverse the sentiment.
Institutional Option Trading🏛️ Institutional Option Trading
Institutional Option Trading refers to how large financial institutions like hedge funds 📊, investment banks 🏦, insurance firms 🧾, and asset managers 💼 use options contracts strategically to hedge risks, generate income, or make large, leveraged bets with controlled risk.
These institutions trade options using:
🧠 Advanced analytics & algorithms
📉 Volatility-based strategies (like straddles, condors, and spreads)
📊 Risk-neutral positioning using Greeks (Delta, Vega, Theta, etc.)
🛡️ Portfolio hedging & macroeconomic plays
💼 Multi-million dollar contracts with custom structures
Their trading is not based on emotions, but on probabilities, risk-reward analysis, and long-term objectives.
📌 In simple words:
Institutional Option Trading is how big players use options smartly to manage risk and extract value — with precision, scale, and professional tools. 💼⚙️📈

Learn Advanced Institutional Trading🎓 Learn Advanced Institutional Trading
Advanced Institutional Trading is the high-level skill of trading financial markets the way professional institutions do — using big data, smart tools, and strategic decision-making to consistently win in the market. 💼📊
Learning this means going beyond basic charts or trendlines. It’s about understanding how big money moves, and how to:
🧠 Read institutional order flow
📉 Trade with algorithms and dark pools
📈 Use volume, liquidity zones & smart money indicators
🛡️ Apply institutional-level risk management
⚙️ Trade options, futures, and other derivatives at scale
💬 Interpret economic data like banks and funds do
You’ll learn to:
Identify entry and exit points based on institutional footprints
Use macro and micro market analysis
Build a trading system with logic and consistency
React to live news, earnings, and global events the way hedge funds do
📌 In simple words:
Learning Advanced Institutional Trading gives you the mindset, tools, and strategies used by the top 1% of traders — so you can trade smart, calculated, and professional just like the big players.

Technical Class📚 Technical Class
A Technical Class in trading is a structured learning program focused on teaching you how to read and analyze price charts 📈, indicators 📊, and market patterns 🔁 to make smart and profitable trading decisions.
In a good technical class, you’ll learn to:
🔍 Read candlestick charts like a pro
🧱 Identify support & resistance levels
📉 Spot breakouts, fakeouts, and trend reversals
🔄 Use moving averages, RSI, MACD, and volume tools
🧠 Understand market psychology through patterns
📌 Time your entry and exit points with precision
⚖️ Combine multiple indicators for confirmation
These classes are perfect for:
🚀 Beginners who want to build a strong foundation
📈 Intermediate traders ready to sharpen their skills
🎯 Anyone looking to trade based on logic, not emotion
📌 In simple words:
A Technical Class teaches you how to "read the market" — using charts, patterns, and indicators — so you can trade with confidence, clarity, and strategy.

Zero-Day Options (0DTE)🔍 What Are Zero-Day Options (0DTE)?
The term “0DTE” stands for Zero Days to Expiration. These are options contracts that expire on the same day you buy or sell them.
In simple words, if today is Thursday and you’re trading a weekly Nifty or BankNifty option that expires today — you're trading a 0DTE option.
This type of option:
Has no time left beyond today.
Is highly sensitive to price movement.
Is extremely risky and extremely rewarding.
Earlier, we only had Thursday expiry for weekly options. But now, due to growing popularity, exchanges have introduced:
Nifty 50 expiry: Monday to Friday (Daily)
Bank Nifty expiry: Tuesdays and Thursdays
Fin Nifty expiry: Tuesdays
Sensex expiry: Fridays
This means 0DTE trading can now happen almost every day!
📈 Why 0DTE Trading Has Become So Popular
Zero-Day Options are now one of the most actively traded instruments — both by retail and institutional traders. Here’s why:
1. Small Premiums, Big Potential
Since the option expires today, its price (premium) is very low — sometimes just ₹5 or ₹10. If the market moves in your favor, that ₹10 option can quickly become ₹50 or ₹100.
That’s a 5x to 10x return, sometimes in just 15-30 minutes.
2. No Overnight Risk
You’re in and out the same day. No gap-ups, no global tension ruining your position overnight.
3. Scalping Friendly
Perfect for intraday traders who don’t want to hold positions for long.
4. Lots of Movement Near Expiry
Prices jump fast because time is running out. This gives more opportunities — but also more chances to get trapped.
5. Better Tools & Platforms
With modern brokers offering real-time data, scalping tools, and fast execution — more traders are trying 0DTE.
💼 How Do 0DTE Options Work?
Let’s take a simple example:
Today is Thursday, and Nifty is trading around 22,000.
You think it will rise, so you buy a 22,100 Call Option (CE) at 11 AM for ₹15.
If Nifty rises 50 points in the next 30 minutes, your option may become ₹45.
That’s 200% return.
But… if Nifty remains flat or falls, your option may go to ₹0 by the end of the day.
What Makes Them Move So Fast?
There are 3 reasons:
Time Decay (Theta): Since it's the last day, every minute that passes reduces the option's value if there's no movement.
Volatility: Even small market moves can cause big percentage changes in premium.
Greeks Sensitivity: Delta, Gamma, and Vega — all move faster near expiry.
🔁 Most Common 0DTE Strategies
1. Directional Option Buying
Buy a Call or Put based on price action.
Works best when there's momentum or breakout.
Example: Buy 22,100 CE at ₹10 → Nifty moves up → Exit at ₹50.
👍 High reward
👎 High risk (can go to zero)
2. Straddle/Strangle Selling (Non-Directional)
Sell both Call and Put at the same or nearby strikes.
You win if the market stays in range.
Example: Sell 22,000 CE and 22,000 PE → Market closes at 22,000 → Both go to zero.
👍 Profit from time decay
👎 If market breaks out in any direction, huge loss
3. Iron Condor
Sell OTM Call and Put spreads to capture decay in a defined range.
Lower risk, but also lower return.
👍 Safer than naked straddle
👎 Limited reward
4. Scalping with 1-2 Candle Momentum
Monitor breakouts on 1-min or 3-min chart.
Take quick entries and exits with small quantities.
👍 Quick gains
👎 Requires sharp execution and discipline
🏦 Who Uses 0DTE — Institutions or Retail?
🔹 Institutions:
Use algos to sell options in range.
Make profit from premium decay.
Use 0DTE to hedge portfolios or capture intraday IV changes.
🔹 Retail Traders:
Use for quick profits or gambling.
Often go for cheap out-of-the-money options.
Tend to overtrade without understanding risk.
⚠️ Risks Involved in 0DTE Trading
Let’s be honest — 0DTE options are not safe for everyone.
Here are the major dangers:
1. Time Decay (Theta Burn)
Every minute, the option loses value unless the market moves.
2. Fast Premium Erosion
Flat markets = quick loss. A ₹10 option can go to ₹0 in 15 minutes.
3. No Margin for Error
You need to be right on direction, timing, AND speed. All three.
4. Emotional Stress
Prices jump fast. Without discipline, you’ll end up revenge trading.
5. Overtrading
Traders often re-enter after loss without a plan — increasing risk.
🎯 Real-World Example of a 0DTE Trade
Let’s say it's Tuesday, and you’re trading BankNifty (expires today).
10:00 AM: BankNifty at 47,200
You buy 47,300 CE at ₹12
10:30 AM: BankNifty jumps 80 points
Your CE becomes ₹42
You exit — 250% return
But…
If BankNifty remained flat or dropped, that ₹12 option may go to ₹3 or even ₹0.
Same day. Same strike. Two opposite outcomes.
💡 Tips for Beginners to Trade 0DTE Safely
Start with Small Capital
Never risk your full capital on one trade.
Set Hard Stop-Loss
Exit if your option loses 40-50%. No second thoughts.
Trade in Breakout Zones
Avoid choppy ranges — they kill premiums.
Watch Open Interest + Price Action
See where the buyers/sellers are active.
Trade First Hour or Last Hour
That’s when you get big movements and clear setups.
Avoid Trading Just for Fun
0DTE is not for boredom. It’s for precision and skill.
Do Not Hold Till 3:30 PM
If you’re an option buyer, premiums usually die in the last 15 minutes.
🧠 Should You Trade 0DTE Options?
✅ YES — if:
You have solid technical analysis
You understand risk management
You can stick to a strict plan
You are okay with losing 100% on a bad trade
❌ NO — if:
You are emotionally reactive
You don’t track charts closely
You trade with borrowed or large capital
You don’t know how option Greeks work
🏁 Final Words
Zero-Day Options are not just another strategy. They are a whole new mindset of trading.
If used with the right knowledge, strict rules, and patience, they can become a powerful weapon in your trading toolbox. But if misused, they are the fastest way to drain your account.
Respect the instrument. Learn the rules. Start small. Scale with confidence.
Macro-Driven Risk Planning🔍 What is Macro-Driven Risk Planning?
At its core:
Macro-driven risk planning means managing your investment or trading risks by keeping the larger economic environment in mind.
You don’t just look at a stock or a chart — you ask:
What's happening with interest rates?
Is inflation rising or falling?
What’s the government doing with taxes or spending?
Is the US dollar strong or weak?
What are central banks like the RBI or the Federal Reserve up to?
These macroeconomic factors can make or break entire trades, portfolios, and even industries. So macro-driven risk planning is about aligning your strategies with the economic environment.
🧠 Why Is This Important?
Let’s say you’re trading in India.
If the US increases its interest rates sharply:
Foreign investors might pull money out of Indian markets.
INR might weaken.
Stock market might fall due to FII outflows.
If you're not paying attention to this macro signal, you might be trading blindly — even if your technicals are perfect.
🏦 Key Macro Factors That Drive Risk
Here’s a list of major macroeconomic indicators that smart investors and institutions track:
1. Interest Rates
Central banks (like the RBI or US Fed) control this.
📈 Rising Rates: Borrowing becomes expensive → Business slows → Markets may fall.
📉 Falling Rates: Loans become cheaper → Business expands → Markets may rise.
How to plan risk:
If rates are going up, shift from high-growth, high-debt companies to safer sectors like FMCG, pharma, utilities.
2. Inflation
This measures how fast prices are rising.
Moderate inflation = Normal
High inflation = Dangerous for consumers
Deflation = Danger of recession
Indicators: CPI (Consumer Price Index), WPI (Wholesale Price Index)
Risk Planning Tip:
In high inflation, avoid sectors that depend on raw material prices (like auto, FMCG) and look at commodities or inflation-protected assets (like gold, real estate).
3. GDP Growth (Economic Output)
Gross Domestic Product shows if the economy is expanding or shrinking.
📈 Strong GDP = Business confidence = Higher earnings
📉 Weak GDP = Caution = Lower valuations
Risk Strategy:
During GDP growth, take on slightly higher risk with cyclical stocks (like infra, banks). During slowdown, shift to defensive sectors (like pharma, IT).
4. Currency Movements (INR/USD, etc.)
Currency strength/weakness affects:
Imports/Exports
FII flows
Commodity prices (like oil)
Example: If INR weakens, oil imports become costly → Impacts inflation → May lead to rate hikes.
Plan risk: Export-based sectors (IT, pharma) benefit from weak rupee. Importers (oil, aviation) suffer.
5. Fiscal and Monetary Policies
This includes:
Government budgets (fiscal policy) – Taxes, subsidies, spending
Central bank actions (monetary policy) – Rate changes, money supply
Risk View:
A budget with heavy borrowing = inflation pressure
A tight monetary policy = reduced liquidity in markets
Keep eyes on RBI speeches, Fed meetings, union budgets.
6. Global Events
Even if you only trade in India, global news affects you:
US elections
Crude oil prices
Geopolitical tensions (e.g. China-Taiwan, Russia-Ukraine)
Supply chain issues
US Non-Farm Payroll (NFP) data
Macro-risk planning = Staying alert to these changes.
7. Bond Yields
Especially US 10-year bond yield.
Rising yield = Risk-off = Equities may fall
Falling yield = Risk-on = Equities may rise
Foreign investors use this as a guide. It directly affects FII flows.
📘 Real-Life Example: Macro Risk in Action
Case: COVID-19 Pandemic (2020)
Global economy shut down
Interest rates slashed to zero
Stimulus packages announced
Investors moved money into gold, tech stocks, pharma
Smart traders did this:
Moved into digital, pharma, and FMCG stocks
Stayed away from travel, aviation, real estate
Watched central bank actions daily
Used hedges (like buying puts or moving to cash)
This is macro-driven risk planning in real-time.
⚖️ How to Build a Macro Risk Management Plan
Here’s a step-by-step structure anyone can follow:
Step 1: Define Your Risk Tolerance
Are you a short-term trader or long-term investor?
Can you handle volatility?
Do you rely on leverage or trade with cash?
This tells you how much room you have to play with.
Step 2: Track Macro Indicators Weekly
Use sites like:
RBI website for policy updates
Trading Economics for inflation, GDP, interest rates
Bloomberg, CNBC, or Twitter for global headlines
Set alerts for:
Fed meeting dates
India CPI, GDP, IIP
Crude oil updates
Step 3: Use Hedging Tools
Advanced traders use:
Options (buying protective Puts)
Inverse ETFs (for global markets)
Gold or commodities
Diversification (across sectors, geographies)
Step 4: Stay Flexible
Macro conditions change fast. Stay open to:
Rotating your portfolio
Sitting on cash during uncertain times
Changing strategies with data, not emotions
🧭 Conclusion: Think Bigger, Trade Smarter
Macro-Driven Risk Planning is about being proactive, not reactive.
Markets aren’t moved by charts alone. They’re driven by:
Central banks
Government decisions
Global events
Economic data
So when you plan your next trade or invest in a stock, ask yourself:
“Am I moving with the economic current — or fighting against it?”
The more you understand macro trends, the better you’ll manage your risks and grow consistently.
Institution Option Trading📌 1. Multi-leg Strategic Trades
Institutions rarely take single-leg naked options. They use advanced setups like:
✅ Vertical Spreads (Bull Call / Bear Put)
✅ Iron Condor / Iron Butterfly
✅ Calendar / Diagonal Spreads
✅ Ratio Spreads
✅ Box Spreads (riskless arbitrage)
These strategies offer:
Defined risk
Better reward-to-risk ratios
Controlled exposure to market direction and volatility
📌 2. Delta Hedging
Institutions holding large stock or futures positions hedge delta using options.
For example:
Holding ₹50 crore worth of Reliance shares
Buy Reliance PUT options to protect against fall
Or, dynamically sell call options as price rises to adjust exposure
This is called Delta Hedging, and it’s done in real-time using algorithms.
📌 3. Open Interest (OI) Tracking
Institutions use option chain OI to:
Spot support/resistance based on strike activity
Identify traps and short-covering zones
Detect institutional presence via unusual OI spikes
For example:
Sudden OI surge at 22,000 PE in Bank Nifty
Might indicate put writers protecting downside, expecting reversal
📌 4. Time Decay (Theta) Exploitation
Institutions are the real beneficiaries of theta decay.
They sell options (straddles, strangles, spreads) around key levels (like VWAP, CPR) and let time decay eat the premium.
Especially on:
Expiry day (Thursday in India)
After big moves
In range-bound markets
They deploy millions of rupees in premium-selling strategies to generate daily/weekly returns.
🔶 Institutional Option Strategies Explained
Let’s break down some common institutional strategies in real terms:
🔷 1. Short Straddle
Sell ATM Call and ATM Put at same strike
Works in sideways markets
Profits from time decay and low movement
✅ Used heavily by institutions on weekly expiry
✅ Risk: Sharp move in either direction
🔷 2. Bull Call Spread
Buy a lower strike Call
Sell a higher strike Call
Lower cost, limited risk & reward
✅ Used when institutions expect moderate bullish move
✅ Controlled exposure + reduced premium
🔷 3. Iron Condor
Sell OTM Call & Put
Buy further OTM Call & Put
Net credit strategy with limited risk
✅ Best in low volatility, non-trending markets
✅ Profitable if market stays between two levels
🔷 4. Calendar Spread
Sell near-term option
Buy far-month option (same strike)
Used when:
Near-term IV is high
Long-term view is neutral or unclear
✅ Profits from IV difference and time decay advantage
🔷 5. Protective Put
Holding equity or futures
Buy Put Option to insure position
Institutions use this to hedge large portfolios during high uncertainty (e.g., elections, war threats, Fed rate decisions)
🔶 Real Example – How an Institution Trades Nifty Options
Let’s say Nifty is at 22,000.
📊 Scenario:
IV is high
No major event ahead
OI buildup seen at 22000 PE and 22100 CE
📈 Institutional Strategy:
Sell 22000 PE and 22100 CE (Short Straddle)
Buy 21900 PE and 22200 CE (hedge legs)
Result:
If Nifty stays in range → theta decay = profit
If it breaks out → hedge legs protect loss
✅ Low-risk, smart premium capture strategy
🔶 Key Tools Institutions Use in Options Trading
Bloomberg Terminal (real-time global data)
Opstra / Sensibull / QuantsApp (for Greek/OI analysis)
Option Vega/IV scanners
Algo trading engines
Python/R-based custom backtesting engines
Retail traders can start by using TradingView + Sensibull/Opstra.
🔶 How to Learn Institutional Options Trading?
Here’s a step-by-step approach:
✅ Understand Options Basics – Calls, Puts, Moneyness
✅ Study Greeks Deeply – Delta, Theta, Vega, Gamma
✅ Learn Option Chain Analysis – OI, IV, Max Pain
✅ Explore Spreads & Multi-leg Setups
✅ Practice Risk Management & Position Sizing
✅ Track Institutional Behavior via OI shifts & volume
✅ Backtest Your Strategy before going live
🔶 Final Takeaways
Institutional Options Trading is not about guessing. It’s about data, structure, and risk.
Retail traders who try to copy institutions without understanding their objectives often get trapped.
But if you:
Study Smart Money behavior
Use strategic entries based on volume + volatility
Respect risk and capital preservation
…you can trade with the institutions, not against them.

Institutional Objectives in Options Trading🔷 What Are Institutions in the Market?
Before diving into their objectives, let’s first understand who institutions are:
Institutions are large, professional organizations that trade in the financial markets using massive amounts of capital. These include:
Mutual Funds
Hedge Funds
Pension Funds
Insurance Companies
Investment Banks
FIIs (Foreign Institutional Investors)
Proprietary Trading Firms
These players account for over 80-90% of daily turnover in options markets like NSE’s Bank Nifty and Nifty. Unlike retail traders, they don’t trade emotionally or randomly. Every move they make has a calculated reason behind it.
🎯 Why Do Institutions Use Options?
Options are powerful tools. Institutions don’t just trade them for direction; they use options to achieve multiple objectives:
✅ 1. Hedging Portfolios
🔍 Objective:
To protect their large equity/futures holdings from adverse market movements.
Institutions have huge long-term positions in stocks or indices. If the market falls sharply, these positions can suffer big losses. So, they use PUT options to hedge.
📈 Example:
A pension fund holds ₹500 crore worth of Nifty 50 stocks.
It buys Nifty 50 PUT Options at 22,000 strike.
If market crashes, the loss in stocks is offset by profit in PUTs.
📌 Result: Limited downside, peace of mind, capital protection.
✅ 2. Generating Additional Income (Option Writing)
🔍 Objective:
To generate consistent income from existing holdings through Covered Calls, Cash-secured Puts, or Iron Condors.
Institutions write options (sell) to earn premium—especially in sideways markets.
💡 Examples:
Covered Call: Own Reliance shares + Sell OTM Call option to earn income.
Short Strangles: Sell far OTM Put and Call if volatility is high.
Iron Condor: Sell call/put spreads to profit from time decay.
📌 Result: Generates passive income with controlled risk.
✅ 3. Arbitrage and Spread Trading
🔍 Objective:
To lock in risk-free or low-risk profits through price inefficiencies.
Institutions use Calendar Spreads, Box Spreads, or Volatility Arbitrage to exploit inefficiencies in option pricing.
🔧 Example:
Calendar Spread: Buy Nifty 22500 CE in August, sell Nifty 22500 CE in July.
Profit from IV differences or time decay.
📌 Result: Non-directional trading, but consistent profits with high capital.
✅ 4. Taking Directional Bets With Defined Risk
🔍 Objective:
To take high-conviction trades without exposing entire capital like futures.
Institutions use Debit Spreads, Straddles, or Long Options for directional views with limited risk.
💡 Example:
If expecting a bullish breakout, they might:
Buy 22000 CE
Sell 22200 CE
It caps both risk and profit. Perfect for risk-managed directional exposure.
📌 Result: Risk-defined entry into market trends without using futures.
✅ 5. Volatility Trading (Not Price Trading)
Institutions often trade volatility, not just price direction. They use Straddles, Strangles, Calendar Spreads to play IV.
💡 Example:
If implied volatility is low and an event is coming (like RBI policy):
Buy Straddle (ATM Call + Put)
Expect IV spike or a big move
📌 Result: Profit from volatility expansion or collapse, even if price stays in a range.
✅ 6. Managing Fund Exposure / Risk Neutralizing
Large funds have multiple exposures—options help them balance and adjust their overall risk (Delta-neutral, Vega-neutral, etc.).
They regularly:
Adjust positions using Gamma scalping
Balance portfolio Delta using options
Reduce Vega risk in high IV periods
📌 Result: A smooth, hedged, and controlled portfolio with minimal exposure to wild market moves.
✅ 7. Creating Synthetic Positions
Sometimes, instead of using equity or futures, institutions use options to replicate or create synthetic trades.
💡 Example:
Buy Call + Sell Put = Synthetic Long Future
Sell Call + Buy Put = Synthetic Short
This helps institutions:
Avoid STT, slippage
Better margin use
Higher flexibility with position sizing
📌 Result: Capital efficiency and strategic execution
📈 How to Spot Institutional Activity in Options?
You can decode institutional movement using these tools:
🔸 1. Open Interest (OI) Analysis
Spike in OI with price action = smart money at work
Build-up of OI near a strike = possible resistance/support zone
Use tools like Sensibull, Opstra
🔸 2. Volume + Price Movement
Sudden spike in volume in far OTM options = Institutional hedging or setup
Buy-Sell flow data shows positioning
🔸 3. Put-Call Ratio (PCR)
Used to detect market sentiment and institutional net positioning
🔸 4. IV Charts / Skew
Institutional volatility strategies are visible through steep IV skew or unusual IV changes
🔐 Final Thoughts
Institutional trading in options is not speculation. It is a scientific approach to manage:
Capital exposure
Risk control
Income generation
Volatility protection
Their objectives are not just to win trades, but to:
Protect capital
Optimize returns
Stay profitable in all market conditions
