Part 1 Master Candlestick PatternOptions vs Stocks/Futures
Stocks: You own a part of the company.
Futures: Obligation to buy/sell in future.
Options: Right, but not obligation, with flexibility.
Common Mistakes by Beginners
Over-leveraging with big lots.
Only buying cheap OTM options.
Ignoring time decay.
Not using stop-loss.
Blindly copying tips without understanding.
Risk Management in Options
Never risk more than 2–5% of capital in one trade.
Use stop-loss orders.
Avoid holding losing options till expiry.
Use spreads to limit risk.
Keep emotions under control.
HDFCBANK

PCR Trading Strategy Options Strategies (Beginner to Advanced)
Options allow many strategies:
Beginner:
Buying Calls & Puts – Simple directional trades.
Intermediate:
Covered Call – Sell call against owned stock.
Protective Put – Buy put to protect long positions.
Advanced:
Straddle – Buy call + put (expect volatility).
Strangle – Similar, but with different strikes.
Iron Condor – Profits from sideways markets.
Butterfly Spread – Low-risk range-bound strategy.
Options in the Indian Market
Traded mainly on NSE (National Stock Exchange).
Popular instruments: Nifty, Bank Nifty, FinNifty, and top stocks.
Expiry cycles: Weekly (Thursday) and Monthly.
Lot sizes fixed by SEBI (e.g., Nifty lot = 25).
India is one of the world’s largest options markets today.

Part 2 Support and ResistanceKey Terms in Options Trading
Before diving deeper, let’s understand some key terms:
Strike Price: The fixed price at which you can buy/sell the asset.
Premium: The price paid to buy the option.
Expiry Date: The date on which the option contract expires.
Lot Size: Options are traded in lots (e.g., 25 shares per lot for Nifty options).
In-the-Money (ITM): When exercising the option is profitable.
Out-of-the-Money (OTM): When exercising would cause a loss.
At-the-Money (ATM): When the strike price = current market price.
Option Buyer: Pays premium, has limited risk but unlimited profit potential.
Option Seller (Writer): Receives premium, has limited profit but unlimited risk.
Types of Options – Calls and Puts
Call Option (CE)
Buyer has the right to buy.
Profits when the price goes up.
Put Option (PE)
Buyer has the right to sell.
Profits when the price goes down.
Example with Reliance stock (₹2500):
Call Option @ 2600: Profitable if Reliance goes above ₹2600.
Put Option @ 2400: Profitable if Reliance goes below ₹2400.

Part 1 Support and ResistanceIntroduction to Options Trading
Trading in the stock market has many forms: buying shares, trading futures, investing in mutual funds, or speculating in commodities. Among all these, Options Trading is one of the most exciting and complex areas.
Options trading gives traders the right, but not the obligation, to buy or sell an underlying asset (like a stock, index, or commodity) at a fixed price before a fixed date.
In simple words:
If you buy a Call Option, you are betting that the price will go up.
If you buy a Put Option, you are betting that the price will go down.
Options give flexibility—traders can profit from rising, falling, or even sideways markets if they use the right strategies. That’s why they are called derivative instruments (their value is derived from an underlying asset).
What are Options? (Basics)
An Option is a financial contract between two parties:
Buyer (Holder): Pays a premium for the right (not obligation) to buy/sell.
Seller (Writer): Receives the premium and has an obligation to honor the contract.
There are two basic types:
Call Option (CE) – Right to buy.
Put Option (PE) – Right to sell.
Example:
Suppose Infosys stock is trading at ₹1500. You buy a Call Option with a strike price of ₹1550 expiring in 1 month. If Infosys goes above ₹1550, you can exercise your right to buy at ₹1550 (cheaper than market). If it doesn’t, you just lose the small premium you paid.
This flexibility is the beauty of options.

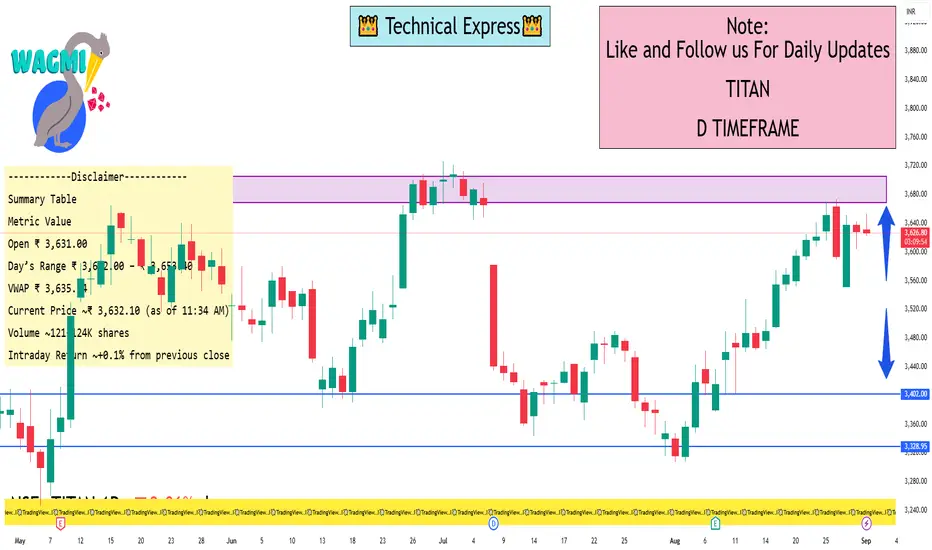
TITAN 1 Day viewReal-Time Quotes (Mid-Morning Trading)
According to Economic Times at around 11:34 AM IST, the stock was trading at:
NSE: ₹3,632.10 (+₹3.30 gain, ~0.10%)
BSE: ₹3,633.35 (+₹4.80 gain, ~0.13%)
Technical Indicators (Intraday)
According to Intraday Screener, the technical outlook shows:
MACD: 2.54 — Bearish
RSI: 47.47 — Neutral
SuperTrend: 3,620.12 — Bullish
ATR: 6.04 — Low Volatility
This suggests short-term caution (bearish MACD) but overall stability and moderate bullishness indicated by SuperTrend — all in a low-volatility environment.
Intraday Chart & Analysis Tools
Platforms like Investing.com and TradingView offer interactive charts where users can:
View candlestick patterns for 1-day intervals
Analyze open, high, low, close data
Apply technical overlays (e.g., MA, RSI, MACD)
Trendlyne also offers a live price chart with metrics such as overall technical momentum.
Volume in TradingIntroduction
In the world of financial markets, price is often the first thing that traders and investors focus on. We look at whether a stock, commodity, or cryptocurrency is going up or down, and based on that, we make decisions. However, price alone does not tell the full story. To understand whether a price move is strong, weak, reliable, or suspicious, traders look at another crucial element: Volume.
Volume is one of the most powerful and widely used tools in trading. It tells us how much activity is happening in the market—in other words, how many shares, contracts, or units are being bought and sold during a given period. High volume usually signals strong interest and conviction, while low volume suggests hesitation or lack of participation.
In this write-up, we will explore volume in trading from the basics to advanced applications, explaining why it matters, how it is used, and how traders can benefit from interpreting volume correctly.
What is Volume in Trading?
At its simplest, volume refers to the total number of shares, contracts, or units of a security traded within a specific time period. This period could be one minute, one hour, one day, or any timeframe depending on the trader’s focus.
For example:
If 1,000 shares of Reliance Industries are traded on the NSE between 9:15 AM and 9:30 AM, the trading volume for that period is 1,000 shares.
If 10,000 contracts of Nifty futures are exchanged during the day, then the daily futures volume is 10,000 contracts.
In forex or crypto, volume is often measured in terms of lots or tokens.
Key Point:
Volume measures activity. It does not directly tell you whether people are buying or selling more. It only records the number of transactions. For every buyer, there is always a seller—so volume tells us how many times such exchanges happened, not the direction.
Why is Volume Important in Trading?
Volume is like the heartbeat of the market. Without volume, price movements can be misleading or unreliable. Here’s why it matters:
Confirms Price Trends
If a stock is rising but on low volume, the uptrend may not be sustainable. On the other hand, if the stock is rising with high volume, it suggests strong buying interest and a more reliable uptrend.
Identifies Strength of Breakouts
When price breaks above resistance or below support, traders look at volume. A breakout with high volume is more likely to succeed, while a breakout on low volume often fails.
Indicates Market Participation
High volume means many traders are actively participating, which usually reduces manipulation and increases reliability. Low volume may signal lack of interest or potential traps.
Helps Spot Reversals
Sometimes, a sudden spike in volume during an uptrend or downtrend can indicate exhaustion and reversal. For instance, after a long rally, if volume spikes but price fails to rise further, it may signal distribution.
Used in Technical Indicators
Several technical indicators, like On-Balance Volume (OBV), Volume Weighted Average Price (VWAP), and Volume Profile, are built entirely around volume data.
How is Volume Calculated?
The calculation is straightforward:
In stocks, volume is the total number of shares traded in a given time frame.
In futures and options, it is the number of contracts traded.
In forex, volume is often tick volume, which measures how many times the price changes, since centralized volume data is unavailable.
In cryptocurrency, volume is the number of tokens traded across exchanges.
Example:
If Infosys has 20 lakh shares traded on NSE in a day, then the daily volume is 20 lakh.
Relationship Between Price and Volume
To understand market psychology, traders study how volume behaves relative to price. Here are some classic patterns:
Price Up + Volume Up → Bullish Confirmation
Rising price on rising volume shows strong demand and confirms the uptrend.
Price Up + Volume Down → Weak Rally
If price rises but volume falls, it may signal that fewer participants are pushing the price, often leading to reversals.
Price Down + Volume Up → Bearish Confirmation
Falling price with increasing volume confirms strong selling pressure.
Price Down + Volume Down → Weak Decline
Declining prices with low volume suggest lack of strong sellers; the trend may be temporary.
Tools & Indicators Based on Volume
Traders don’t just look at raw volume numbers. They use tools to interpret volume more effectively:
1. On-Balance Volume (OBV)
OBV adds volume on up days and subtracts volume on down days, creating a running total. Rising OBV confirms bullish pressure, while falling OBV confirms bearish pressure.
2. Volume Profile
Volume Profile shows how much volume occurred at different price levels, not just over time. It helps identify support/resistance zones based on where most trading activity happened.
3. VWAP (Volume Weighted Average Price)
VWAP calculates the average price at which a security has traded throughout the day, weighted by volume. Institutional traders often use VWAP as a benchmark for fair value.
4. Accumulation/Distribution Line
This indicator uses both price and volume to detect whether money is flowing into (accumulation) or out of (distribution) a stock.
5. Chaikin Money Flow (CMF)
CMF combines price and volume to measure buying and selling pressure over a certain period.
Volume Patterns in Trading
Volume often reveals patterns that help traders interpret the market:
High Volume at Breakouts
When a stock breaks out of a range with high volume, it confirms a real move.
Low Volume Breakouts
Often fake moves. If volume is weak, the breakout might not sustain.
Volume Spikes
Sudden surges in volume may indicate big institutional activity, news events, or trend reversals.
Volume Dry-Up
When volume dries up after a trend, it may signal exhaustion or upcoming consolidation.
Climax Volume
Near the end of strong trends, volume may spike dramatically, showing panic buying or selling. This often signals reversals.
Practical Applications of Volume
1. Spotting Trend Continuation
If an uptrend continues with increasing volume, traders stay in the trade confidently.
2. Detecting False Moves
Volume helps avoid traps. For example, a stock breaking resistance with weak volume is a red flag.
3. Day Trading with Volume
Intraday traders often use VWAP and relative volume (RVOL) to judge whether momentum trades are worth taking.
4. Long-Term Investing
Investors also watch volume to confirm whether institutions are accumulating or distributing shares.
Volume in Different Markets
Stock Market: Volume shows investor participation. Stocks with higher volumes are more liquid, making them easier to buy/sell.
Futures & Options: Volume indicates interest in contracts. High option volume often highlights where traders expect big moves.
Forex: Since forex is decentralized, traders use tick volume or broker-provided estimates.
Cryptocurrency: Volume is vital because crypto markets are prone to manipulation. Exchanges often report trading volumes to show liquidity.
Examples from Indian Markets
Reliance Industries Breakout
When Reliance broke past ₹2,000 levels in 2020, it was supported by record-high volumes, confirming strong institutional participation.
Bank Nifty Index Futures
During big events like Union Budget, Bank Nifty futures often see surges in volume, confirming traders’ interest and directional bets.
SME IPOs
Many SME stocks in India show thin volumes after listing, making them risky for retail investors due to low liquidity.
Common Mistakes in Interpreting Volume
Assuming High Volume Always Means Bullish
High volume doesn’t always mean buying. It could also be strong selling. Traders must analyze price action alongside volume.
Ignoring Context
Volume must be compared with historical averages. A spike is meaningful only if it is unusual compared to typical activity.
Relying on One Indicator
Volume should confirm price action, not replace it. Relying solely on volume can be misleading.
Advanced Concepts
Relative Volume (RVOL): Compares current volume to average past volume. RVOL > 2 means twice the usual activity.
Volume Divergence: If price rises but volume falls, it warns of weakening trend.
Dark Pools: Large institutional trades may not immediately show in public volume data, so volume analysis is not always perfect.
Psychological Aspect of Volume
Volume reflects human behavior in markets. Rising volume shows enthusiasm, fear, or greed, while falling volume shows apathy or caution. Big volume often comes from institutions, and spotting their footprints helps retail traders align with the “smart money.”
Conclusion
Volume is one of the most essential elements in trading. It is not just a number—it is a window into market psychology and trader participation. By studying volume along with price, traders can confirm trends, identify breakouts, detect reversals, and avoid false signals.
From simple applications like confirming support/resistance breakouts to advanced tools like VWAP and Volume Profile, volume remains a critical guide for traders across stocks, futures, forex, and crypto.
The key lesson is: Price tells you what is happening, but Volume tells you how strong it is.
Together, they form the foundation of smart trading decisions.
Bounce or Breakdown? HDFC Bank at Crucial Support BandHDFC Bank has been under sustained pressure over the past few sessions, reflecting both stock-specific concerns and broader market volatility. The stock has failed to participate meaningfully in the recent market upmove, which highlights underlying weakness in its structure. Selling pressure has intensified, and price action shows that the stock is struggling to hold above key support zones.
At present, HDFC Bank is trading around a crucial support band of ₹950–₹940. This zone has historically acted as an important demand area, where buyers have stepped in to defend the price. However, the inability of the stock to bounce strongly from this range in recent days raises caution.
A decisive breakdown below ₹940 may trigger further weakness, opening the door for a slide toward ₹930, ₹900, and even ₹870 levels in the near term. These levels are important psychological and technical supports, and a test of them cannot be ruled out if selling continues.
Overall, unless the stock manages to sustain and bounce above ₹950 with strong volumes, the undertone remains weak. The coming sessions will be crucial to determine whether HDFC Bank stabilizes at this support zone or extends its downtrend.

Part 1 Master Candlestick PatternHow Options Work (Premiums, Strike Price, Expiry, Moneyness)
Every option has certain key components:
Premium: The price you pay to buy the option. This is determined by demand, supply, volatility, and time to expiry.
Strike Price: The fixed price at which the option holder can buy/sell the asset.
Expiry Date: Options are valid only for a certain period. In India, index options have weekly and monthly expiries, while stock options usually expire monthly.
Moneyness: This defines whether an option has intrinsic value.
In the Money (ITM): Already profitable if exercised.
At the Money (ATM): Strike price equals the current market price.
Out of the Money (OTM): Not profitable if exercised immediately.
Why Trade Options?
Options trading is popular because it serves multiple purposes:
Hedging: Protecting investments from adverse price movements. Example: A farmer uses commodity options to protect against falling crop prices.
Speculation: Traders can bet on market direction with limited capital.
Income Generation: Selling (writing) options like covered calls can generate steady income.
Leverage: With a small premium, traders can control large positions.

Part 3 Trading Master ClassIntroduction
Options trading is one of the most fascinating and versatile aspects of the financial markets. Unlike stocks, which give ownership in a company, or bonds, which provide fixed income, options are derivative instruments whose value is derived from an underlying asset such as stocks, indices, commodities, or currencies. They give traders the right, but not the obligation, to buy or sell the underlying asset at a predetermined price before a specific expiration date.
Because of this unique characteristic, options allow traders and investors to design strategies that suit a wide range of market conditions—whether bullish, bearish, or neutral. Through careful strategy selection, one can aim for limited risk with unlimited upside, hedge existing positions, or even profit from sideways markets where prices don’t move much.
This article explores options trading strategies in detail. We’ll cover the building blocks of options, common strategies, advanced combinations, and risk management. By the end, you’ll have a strong foundation to understand how professional traders use options to manage portfolios and generate returns.
Risk Management in Options Trading
Options carry significant risks if misused. Successful traders emphasize:
Position Sizing: Never risk too much on one trade.
Diversification: Spread across multiple strategies/assets.
Stop-Loss & Adjustments: Exit losing trades early.
Implied Volatility (IV) Awareness: High IV increases premiums; selling strategies may be better.

Part 2 Support and ResistanceWhy Use Options?
Options provide traders with:
Leverage: Control a large position with a smaller investment.
Flexibility: Create strategies for any market scenario.
Risk Management: Hedge against adverse price movements.
Income Generation: Sell options to collect premium.
Simple Options Trading Strategies
These strategies are suitable for beginners. They involve limited positions and simple risk-reward profiles.
Long Call
Outlook: Bullish
How it works: Buy a call option when expecting price to rise.
Risk: Limited to premium paid.
Reward: Unlimited upside.
Example: Stock trading at ₹100, buy a call with strike ₹105 for ₹3 premium. If stock rises to ₹120, profit = (120–105–3) = ₹12.
Long Put
Outlook: Bearish
How it works: Buy a put option when expecting price to fall.
Risk: Limited to premium paid.
Reward: Potential profit increases as price drops (limited to strike price minus premium).
Example: Stock at ₹100, buy a put strike ₹95 for ₹2. If stock falls to ₹85, profit = (95–85–2) = ₹8.
Covered Call
Outlook: Neutral to mildly bullish
How it works: Own stock and sell a call against it.
Risk: Downside risk in stock, upside capped at strike.
Reward: Earn premium income.
Protective Put
Outlook: Hedge
How it works: Own stock and buy a put to protect downside.
Risk: Limited (stock downside hedged).
Reward: Unlimited upside, protection from losses.

Part 1 Support and ResistanceIntroduction
Options trading is one of the most fascinating and versatile aspects of the financial markets. Unlike stocks, which give ownership in a company, or bonds, which provide fixed income, options are derivative instruments whose value is derived from an underlying asset such as stocks, indices, commodities, or currencies. They give traders the right, but not the obligation, to buy or sell the underlying asset at a predetermined price before a specific expiration date.
Because of this unique characteristic, options allow traders and investors to design strategies that suit a wide range of market conditions—whether bullish, bearish, or neutral. Through careful strategy selection, one can aim for limited risk with unlimited upside, hedge existing positions, or even profit from sideways markets where prices don’t move much.
This article explores options trading strategies in detail. We’ll cover the building blocks of options, common strategies, advanced combinations, and risk management. By the end, you’ll have a strong foundation to understand how professional traders use options to manage portfolios and generate returns.
1. Basics of Options
Before diving into strategies, it’s important to review some fundamental concepts.
1.1 What is an Option?
Call Option: Gives the holder the right (not obligation) to buy the underlying asset at a predetermined price (strike price) before or on expiration.
Put Option: Gives the holder the right (not obligation) to sell the underlying asset at a predetermined price before or on expiration.
1.2 Key Terms
Premium: The price paid to buy an option.
Strike Price: The agreed price to buy or sell the underlying.
Expiration Date: The last day the option can be exercised.
Intrinsic Value: Difference between underlying price and strike (if favorable).
Time Value: Portion of the premium that reflects time until expiration.
1.3 Options Styles
European Options: Exercisable only at expiration.
American Options: Exercisable any time before expiration.

Algorithmic & Quantitative TradingIntroduction
Trading has evolved dramatically over the past few decades. From the days of shouting bids in open-outcry pits to today’s ultra-fast trades executed in milliseconds, technology has transformed how markets operate. Two of the most important concepts in this transformation are algorithmic trading and quantitative trading.
At their core, both involve using mathematics, statistics, and technology to make trading decisions instead of relying purely on human judgment. While traditional traders might rely on intuition, news, and gut feeling, algo and quant traders build rules, models, and systems to trade with consistency and efficiency.
In this comprehensive guide, we’ll dive into:
The basics of algorithmic & quantitative trading.
Their differences and overlaps.
The strategies they use.
The technologies and tools behind them.
Risks, challenges, and regulatory aspects.
The future of algo & quant trading.
By the end, you’ll understand how these forms of trading dominate global financial markets today.
1. Understanding Algorithmic Trading
Definition
Algorithmic trading (often called algo trading) is the process of using computer programs and algorithms to automatically place buy or sell orders in financial markets. The algorithm follows a set of predefined instructions based on variables like:
Price
Volume
Timing
Technical indicators
Market conditions
The key idea is automation: once the rules are programmed, the system executes trades without manual intervention.
Why Algorithms?
Speed: Computers can process data and execute trades in milliseconds, far faster than humans.
Accuracy: Algorithms eliminate emotional decision-making.
Efficiency: They can scan thousands of instruments simultaneously.
Consistency: Strategies are applied without deviation or hesitation.
Examples of Algo Trading in Action
A program that buys stock when its 50-day moving average crosses above its 200-day moving average.
A system that places trades when prices deviate 1% from fair value in futures vs. spot markets.
High-frequency algorithms that profit from microsecond price differences across exchanges.
2. Understanding Quantitative Trading
Definition
Quantitative trading (quant trading) uses mathematical and statistical models to identify trading opportunities. Instead of intuition, it relies on data-driven analysis of price patterns, volatility, correlations, and probabilities.
In simple words:
Algo trading = How trades are executed.
Quant trading = How strategies are designed using math and data.
Many traders combine both: they design quantitative strategies and then execute them algorithmically.
Why Quantitative?
Markets are complex and noisy. Statistical models help filter out randomness.
Data-driven strategies can uncover hidden opportunities humans can’t easily spot.
Backtesting allows quants to test ideas on historical data before risking real money.
Quantitative Models Used
Mean Reversion Models – assuming prices return to their average over time.
Trend-Following Models – capturing momentum in markets.
Statistical Arbitrage Models – exploiting mispricings between correlated assets.
Machine Learning Models – using AI to adapt and predict market moves.
3. Algo vs. Quant Trading: Key Differences
Although often used interchangeably, there are subtle differences:
Feature Algorithmic Trading Quantitative Trading
Focus Execution of trades using automation Strategy design using math & statistics
Tools Algorithms, order routing systems Models, statistical analysis, simulations
Objective Speed, precision, automation Finding profitable patterns
Example VWAP (Volume Weighted Average Price) execution algorithm Pairs trading based on correlation
In practice, quant trading often leads to algo trading:
Quants design models.
Those models are turned into algorithms.
Algorithms execute trades automatically.
4. Key Strategies in Algorithmic & Quantitative Trading
Both algo and quant trading employ a wide variety of strategies. Let’s explore them in depth.
A. Trend-Following Strategies
Based on the belief that prices tend to move in trends.
Uses tools like moving averages, momentum indicators, and breakout levels.
Example: Buy when 50-day MA > 200-day MA (Golden Cross).
B. Mean Reversion Strategies
Assumes prices revert to their average over time.
Tools: Bollinger Bands, RSI, Z-score analysis.
Example: If stock deviates 2% from its mean, bet on reversal.
C. Arbitrage Strategies
Exploit price discrepancies between related securities.
Statistical Arbitrage – trading correlated assets (like Coke vs. Pepsi).
Merger Arbitrage – trading on price gaps during acquisitions.
Index Arbitrage – between index futures and underlying stocks.
D. Market-Making Strategies
Provide liquidity by continuously quoting buy and sell prices.
Profit comes from the bid-ask spread.
Requires ultra-fast systems.
E. High-Frequency Trading (HFT)
Subset of algo trading with extremely high speed.
Millisecond or microsecond execution.
Often used for arbitrage, market making, and exploiting tiny inefficiencies.
F. Machine Learning & AI-Based Strategies
Use large datasets and predictive models.
Neural networks, reinforcement learning, and deep learning applied to market data.
Example: Predicting volatility spikes or option price movements.
G. Execution Algorithms
These are not designed to predict prices but to optimize order execution:
VWAP (Volume Weighted Average Price) – executes in line with average traded volume.
TWAP (Time Weighted Average Price) – spreads order evenly over time.
Iceberg Orders – hides large orders by breaking them into small chunks.
5. Tools & Technologies Behind Algo & Quant Trading
Trading at this level requires robust infrastructure.
A. Data
Historical Data – for backtesting strategies.
Real-Time Data – for live execution.
Alternative Data – satellite images, social media, news sentiment, credit card usage, etc.
B. Programming Languages
Python – easy, rich libraries (pandas, numpy, scikit-learn).
R – strong for statistics and visualization.
C++/Java – high-speed execution.
MATLAB – research-heavy environments.
C. Platforms
MetaTrader, NinjaTrader, Amibroker – retail algo platforms.
Interactive Brokers API, FIX protocol – institutional-grade.
D. Infrastructure
Low-latency servers close to exchange data centers.
Cloud computing for scalability.
Databases (SQL, NoSQL) to handle terabytes of data.
6. Advantages of Algo & Quant Trading
Speed – execute trades in milliseconds.
Emotion-Free – avoids greed, fear, panic.
Backtesting – test before risking capital.
Diversification – manage thousands of instruments simultaneously.
Liquidity Provision – improves market efficiency.
Scalability – one strategy can be deployed globally.
7. Risks & Challenges
Despite advantages, algo & quant trading face serious risks.
A. Market Risks
Models might fail during extreme market conditions.
Example: 2008 financial crisis saw many quant funds collapse.
B. Technology Risks
Latency issues.
Software bugs leading to erroneous trades (e.g., Knight Capital loss of $440M in 2012).
C. Overfitting in Models
A strategy may look profitable in historical data but fail in real-time.
D. Regulatory Risks
Authorities impose strict rules to avoid market manipulation.
Example: SEBI in India regulates algo orders with checks on co-location and latency.
E. Ethical Risks
HFT firms sometimes exploit slower participants.
Raises fairness concerns.
8. Algo & Quant Trading in Global Markets
US & Europe: Over 60-70% of equity trading is algorithmic.
India: Around 50% of trades on NSE are algorithm-driven, with growing adoption.
Emerging Markets: Adoption is slower but rising as infrastructure improves.
Major players include:
Citadel Securities
Renaissance Technologies
Two Sigma
DE Shaw
Virtu Financial
9. Regulations Around Algo Trading
Different regulators have implemented measures:
SEC (US) – Market access rule, risk controls for algos.
MiFID II (Europe) – Transparency and monitoring of algo strategies.
SEBI (India) – Approval for brokers, limits on co-location, kill switches for runaway algos.
The aim is to balance innovation with market stability.
10. The Future of Algo & Quant Trading
The next decade will see major shifts:
AI & Deep Learning – self-learning trading models.
Quantum Computing – solving optimization problems faster.
Blockchain & Smart Contracts – decentralized, transparent execution.
Alternative Data Explosion – satellite data, IoT, ESG metrics.
Retail Algo Access – democratization through APIs and brokers.
Markets will become more data-driven, automated, and technology-intensive.
Conclusion
Algorithmic and quantitative trading represent the intersection of finance, mathematics, and technology. Together, they have reshaped global markets by making trading faster, more efficient, and more complex.
Algorithmic trading focuses on execution automation.
Quantitative trading focuses on designing mathematically-driven strategies.
From trend-following to machine learning, from VWAP execution to HFT, these approaches dominate today’s trading world.
However, with great power comes great risk—overreliance on models, tech glitches, and ethical debates remain.
Looking ahead, advancements in AI, alternative data, and quantum computing will further revolutionize how markets operate. For traders, investors, and policymakers, understanding these dynamics is crucial.
Trading Psychology & DisciplineIntroduction
In the world of financial markets, traders often focus on technical analysis, fundamental research, algorithms, and news-driven events to make decisions. While these tools are essential, there is one element that is frequently underestimated yet plays a much bigger role in success: trading psychology and discipline.
Trading is not just about numbers, charts, or strategies—it is a game of emotions, mindset, and self-control. Even the most sophisticated strategies fail if the trader cannot control fear, greed, and impulsive behavior. On the other hand, an average trading system can become profitable in the hands of a disciplined and emotionally balanced trader.
This discussion will explore the psychological aspects of trading, the emotional challenges, common behavioral biases, and how discipline can transform a trader’s performance. We’ll also look at techniques and practices to build a resilient trading mindset.
1. The Role of Psychology in Trading
Trading psychology refers to the emotions and mental state that influence how traders make decisions in the market. Unlike professions where skills and experience directly translate into results, trading is unique because psychological factors often override logic.
For example:
A trader may have a solid strategy to exit a position at a 10% profit. But when the time comes, greed makes them hold longer, hoping for more, and the market reverses.
Another trader may see a perfect setup but doesn’t enter the trade because of fear after a previous loss.
This illustrates that psychology can either support or sabotage trading success. Research shows that 80–90% of retail traders lose money consistently—not always because of poor strategies, but due to a lack of discipline and emotional control.
2. Key Emotional Challenges in Trading
Let’s examine the major psychological challenges that traders face.
a) Fear
Fear is the most dominant emotion in trading. It manifests in different ways:
Fear of losing money (not taking a trade).
Fear of missing out (FOMO—jumping into a trade too late).
Fear of being wrong (holding on to losing positions).
Fear often leads to hesitation, early exits, or missed opportunities.
b) Greed
Greed drives traders to:
Overstay in profitable trades.
Over-leverage positions.
Overtrade (taking too many trades in a day).
While the market rewards patience, greed often blinds judgment.
c) Hope
Many traders fall into the trap of hope, especially with losing trades. Instead of cutting losses, they keep hoping the market will reverse in their favor. Hope replaces rational decision-making.
d) Revenge Trading
After a loss, traders sometimes feel the need to recover money immediately. This leads to impulsive trades without proper setups—often resulting in bigger losses.
e) Overconfidence
Success can be as dangerous as failure. After a winning streak, traders may become overconfident, take unnecessary risks, or abandon risk management—leading to devastating drawdowns.
3. Behavioral Biases in Trading
Trading psychology overlaps with behavioral finance, where human biases cloud rational thinking. Some common biases include:
Loss Aversion Bias – The pain of loss is psychologically stronger than the pleasure of gain. Traders avoid booking small losses, leading to bigger ones.
Confirmation Bias – Traders look only for information that supports their trade idea, ignoring opposing signals.
Anchoring Bias – Traders anchor to a certain price level (like the price they bought at) and refuse to sell below it.
Herd Mentality – Following the crowd without analysis, often during market bubbles.
Recency Bias – Giving more weight to recent outcomes rather than long-term performance.
These biases affect judgment and lead to poor decision-making.
4. The Importance of Discipline in Trading
If psychology is the foundation, discipline is the structure that holds a trader’s career together. Discipline in trading means sticking to rules, risk management, and strategies regardless of emotions.
A disciplined trader:
Enters trades only when rules align.
Exits trades at predefined stop-loss or target levels.
Maintains position sizing regardless of emotions.
Accepts losses as part of the business.
Avoids impulsive and revenge trading.
Discipline converts trading from gambling into a professional business.
5. The Mindset of a Successful Trader
Professional traders think differently from amateurs. They focus on process over outcome. Their mindset includes:
Probability Thinking
No trade is guaranteed. Each trade is just one outcome in a series of probabilities. Accepting this reduces emotional pressure.
Detachment from Money
Professionals see money as a tool, not an emotional anchor. They measure success in terms of following their plan, not short-term profits.
Adaptability
Markets change constantly. Disciplined traders adapt rather than stubbornly sticking to failing strategies.
Patience
They wait for high-probability setups rather than forcing trades.
Long-term Focus
Success is measured in months and years, not a single trade.
6. Building Trading Discipline
Discipline is not automatic—it requires conscious practice. Here’s how traders can develop it:
a) Create a Trading Plan
A trading plan defines:
Entry and exit rules.
Position sizing.
Risk-reward ratios.
Markets and timeframes to trade.
Maximum daily/weekly losses.
Without a plan, emotions take over.
b) Use Risk Management
Risk per trade should never exceed 1–2% of capital. Stop-loss orders should be predefined. This ensures survival even during losing streaks.
c) Keep a Trading Journal
A journal helps track:
Why you entered a trade.
Emotions felt during the trade.
What went right/wrong.
Over time, patterns emerge, revealing weaknesses in psychology and strategy.
d) Practice Mindfulness
Mindfulness techniques such as meditation, deep breathing, or visualization help traders stay calm during stressful market conditions.
e) Accept Losses as Normal
Even the best traders lose frequently. What matters is keeping losses small and letting winners run. Accepting losses removes emotional baggage.
f) Avoid Overtrading
Set daily/weekly limits on trades. This prevents emotional exhaustion and impulsive decisions.
7. Practical Techniques to Improve Trading Psychology
Here are actionable steps:
Pre-Market Routine – Spend 10–15 minutes visualizing scenarios, checking news, and calming the mind.
Set Daily Goals – Focus on execution (e.g., “Follow my plan”) rather than monetary goals.
Take Breaks – Step away after a loss or win streak to reset emotionally.
Limit Screen Time – Over-monitoring leads to anxiety. Check setups at predefined times.
Simulation/Backtesting – Helps build confidence in a system before using real money.
Accountability Partner – Sharing trades with another trader builds discipline.
8. Case Studies: Trading Psychology in Action
Case 1: The Fearful Trader
A new trader avoids trades after a big loss. Despite seeing good setups, fear paralyzes action. Over time, opportunities are missed, and frustration builds.
Lesson: Risk management and small position sizing reduce fear.
Case 2: The Greedy Trader
Another trader doubles account quickly during a bull run, but refuses to book profits. Overconfidence leads to leverage, and one market crash wipes out everything.
Lesson: Discipline and humility are essential.
Case 3: The Disciplined Trader
A professional trader takes 40% win rate trades but manages risk with 1:3 reward ratios. Despite losing more trades than winning, account grows steadily.
Lesson: Discipline beats emotions.
9. The Role of Technology and Psychology
Modern trading platforms provide tools like:
Automated trading systems – Reduce emotional interference.
Alerts and stop-loss automation – Enforce discipline.
Analytics dashboards – Help track performance.
But even with technology, psychology remains the deciding factor, since traders often override systems when emotions take over.
10. Long-Term Development of Trading Mindset
Trading psychology is not built overnight. It requires years of consistent practice. Key long-term practices include:
Reading trading psychology books (e.g., Trading in the Zone by Mark Douglas).
Engaging in regular self-reflection.
Accepting that markets are uncertain.
Developing resilience to handle both drawdowns and success.
The goal is to become a trader who is calm in chaos, rational under stress, and disciplined under temptation.
Conclusion
Trading psychology and discipline are the invisible forces behind every successful trader. Strategies and indicators provide the “how,” but psychology answers the “why” and “when.”
Fear, greed, and biases sabotage results.
Discipline enforces consistency and professionalism.
A strong trading mindset focuses on probabilities, risk management, and patience.
Ultimately, trading is not a battle with the market—it is a battle with oneself. Mastering psychology and discipline transforms trading from an emotional rollercoaster into a structured, profitable business.
As the saying goes:
“In trading, your mind is your greatest asset—or your biggest enemy. The choice is yours.”

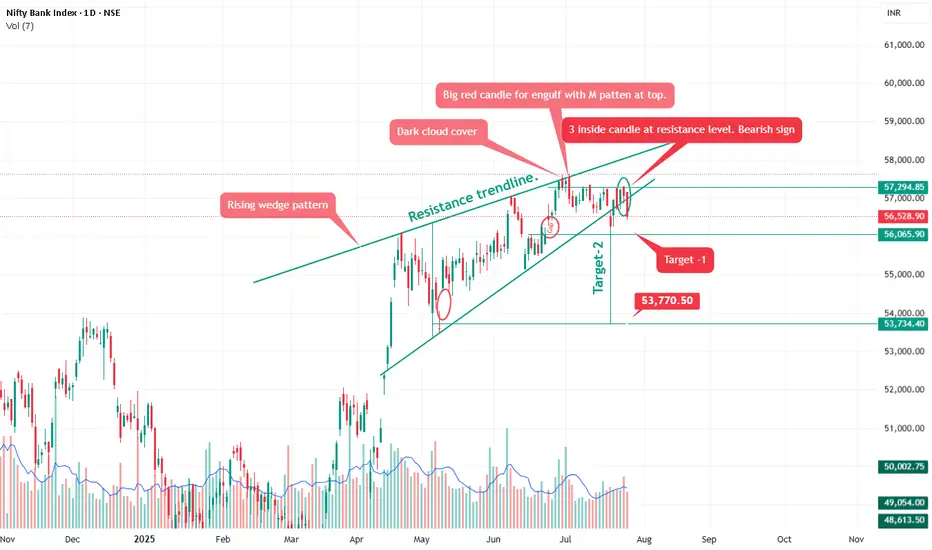
Bank nifty Rising wedge pattern.Pattern Analysis
Rising Wedge Pattern:
A bearish pattern typically seen near tops. It shows narrowing price movement with higher highs but declining momentum.
Breakdown confirmed as price has fallen below the lower wedge support trendline.
Confirms selling pressure and rejection from the top near 57,300–57,500 zone.
🕯️ Candlestick Signals
Dark Cloud Cover:
A bearish reversal pattern indicating sellers have taken control after a bullish phase.
Big Red Candle + ‘M’ Pattern:
Bearish engulfing at resistance – strong indication of a top formation.
3 Inside Down Candlestick Pattern at Resistance:
Recent red candles have higher volume, confirming institutional selling activity.
As anticipated in our previous analysis, Bank Nifty corrected from the 57,000 level to 56,056, validating the bearish setup.
It is also expected to short here 56,550 add on any rise up to 57,700-57,950 for target mentioned on chart.
Alternative Scenario: Be aware that the rising wedge could potentially break upwards. If the price breaks decisively above the resistance trendline with strong volume, the bearish outlook would be invalidated.
Part 1 Master Candlestick PatternOptions in the Indian Stock Market
In India, options trading is booming, especially in:
Nifty & Bank Nifty (Index options).
Stock Options (Reliance, TCS, HDFC Bank, etc.).
👉 Interesting fact: Over 90% of trading volume in NSE comes from options today.
Expiry days (Thursdays for weekly index options) see massive action, as traders bet on final movements.
The Power of Weekly Options
Earlier, only monthly options were available. Now NSE has weekly expiries for Nifty, Bank Nifty, and even stocks.
Weekly options = cheaper premiums.
Traders use them for intraday or short-term bets.
But time decay is very fast.

Part 2 Ride The Big MovesIntroduction to Options Trading
When people think about the stock market, they usually think about buying and selling shares. But there’s another side of the market that’s both exciting and complex—derivatives trading.
An option is one such derivative. Instead of directly buying a share, you buy a contract that gives you the right (but not the obligation) to buy or sell the share at a certain price within a certain time.
Sounds interesting? Let’s make it simple with an analogy.
👉 Imagine you’re interested in buying a car priced at ₹10 lakh. But you’re not sure if you’ll have the money or if the price will change in the future. The dealer says:
Pay me ₹10,000 now, and I’ll give you the right to buy the car at ₹10 lakh anytime in the next three months.
If car prices rise to ₹11 lakh, you can still buy at ₹10 lakh and save ₹1 lakh.
If prices fall to ₹9 lakh, you can simply let the contract expire and lose only your ₹10,000 advance.
This advance is like the option premium, and the contract is your option.
That’s the essence of options trading—buying rights, not obligations.
Basics of Options
Options are broadly of two types:
Call Option (CE) → Right to buy an asset at a fixed price before expiry.
Put Option (PE) → Right to sell an asset at a fixed price before expiry.
Example:
Call Option: You buy a Reliance 2500 CE (Call Option) at a premium of ₹50.
If Reliance rises to ₹2600, you can still buy it at ₹2500 and gain ₹100 (minus premium).
If Reliance falls to ₹2400, you won’t exercise it and lose only ₹50.
Put Option: You buy a Reliance 2500 PE at a premium of ₹40.
If Reliance falls to ₹2400, you can sell at ₹2500 (gain ₹100).
If Reliance rises to ₹2600, you won’t exercise it and lose only ₹40.
This is why options are considered insurance tools in markets.

Part 1 Ride The Big MovesKey Terminologies in Options
Before diving deeper, you need to know the “language of options.”
Strike Price → The fixed price at which you can buy/sell (like 2500 in Reliance example).
Premium → The cost you pay to buy an option.
Expiry Date → Options have a life—weekly, monthly, quarterly. After expiry, they are worthless.
Lot Size → Options are not traded in single shares. They come in fixed quantities called lots (e.g., Nifty lot size = 50).
In the Money (ITM) → Option has intrinsic value.
Out of the Money (OTM) → Option has no value (only time value).
At the Money (ATM) → Strike price = Current market price.
How Option Prices Are Decided
Option premiums are not random. They are influenced by:
Intrinsic Value (IV) → Difference between current price and strike price.
Example: Reliance at ₹2600, Call 2500 → Intrinsic value = ₹100.
Time Value → More time till expiry = higher premium.
Volatility → If a stock is volatile, options are expensive because chances of big movement are high.
Interest rates & Dividends → Minor but relevant in longer-term options.

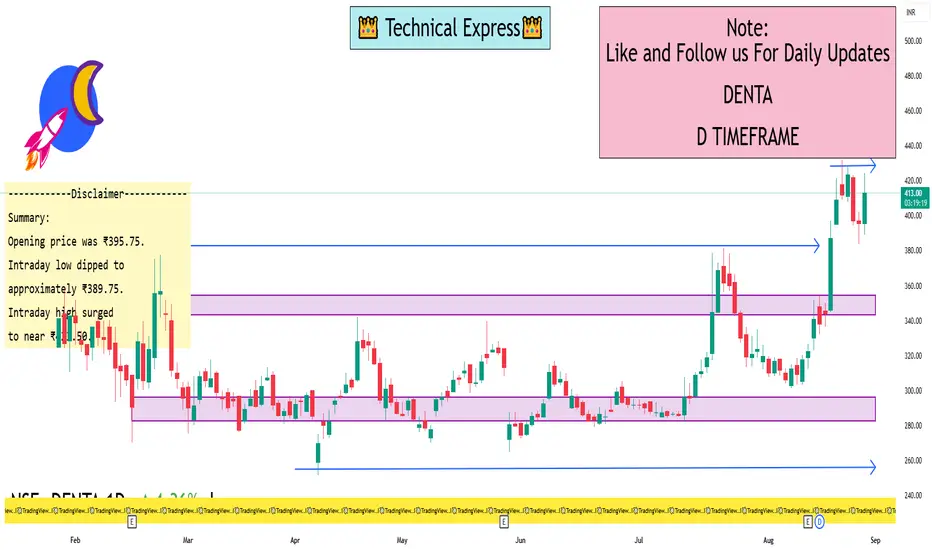
Denta Water and Infra Solutions Ltd. 1 Day ViewIntraday Snapshot (as of Aug 28, 2025)
Current/Last Traded Price: ₹416.25 to ₹417.25, up by approximately ₹20.50, or +5.2% to +5.8% from previous close of ₹395.75
Day’s Trading Range: Low ~₹389.30–389.75; High ~₹424.40–424.50
What This Tells Us
Strong Intraday Price Action: The stock saw a significant intraday move, touching a high of ₹424.40—nearing its 52-week high (₹432.40)—indicating strong buying momentum.
Bullish Momentum: The “Very Bullish” technical assessment and rising pre-open price point to robust market sentiment.
Distinct High Valuation: With P/E and P/S ratios above average, the stock may be considered richly valued, suggesting investor enthusiasm or anticipation of future growth.
Summary: 1-Day (Aug 28) Level View
Opening price was ₹395.75.
Intraday low dipped to approximately ₹389.75.
Intraday high surged to near ₹423.50.
The stock closed around ₹414.20–₹417 range, showing a robust daily gain (~5%)
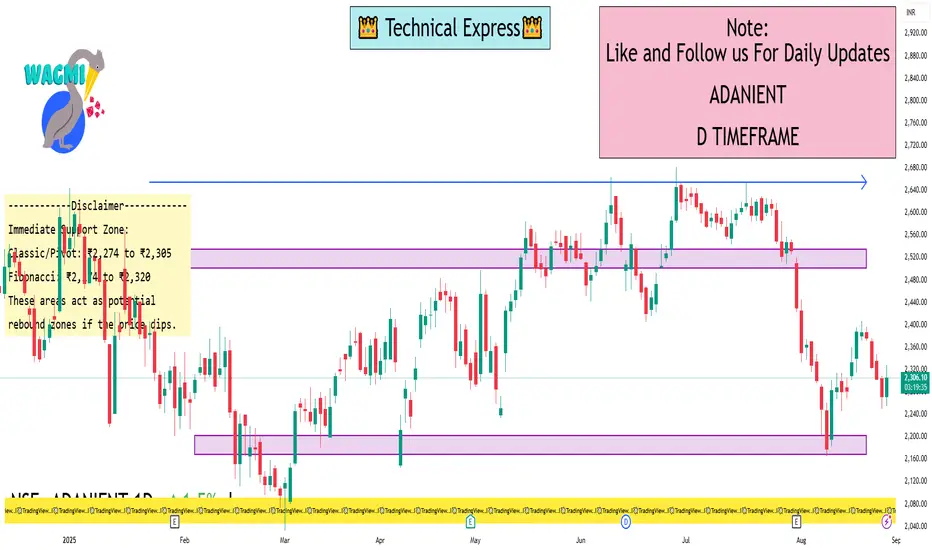
Adani Enterprises Limited 1Day ViewDaily Support & Resistance Levels
Moneycontrol (Classic Pivots):
R1: ₹2,304.40
Pivot: ₹2,276.90
S1: ₹2,244.50
S2: ₹2,217.00
R2/R3 and further levels (Fib, Camarilla) also available
StockInvest.us (Forecast & Levels):
Resistance (Fib):
R1: ₹2,299.78
R2: ₹2,313.92
R3: ₹2,336.80
Support (Fib):
S1: ₹2,254.02
S2: ₹2,239.88
S3: ₹2,217.00
Also highlights volume-based levels:
Support: ₹2,249.80
Resistance: ₹2,283.40
A breakout above these could shift sentiment
Final Take
Immediate bullish trigger: Sustained move above ₹2,283–₹2,304.
Bearish risk zone: Failing to hold ₹2,249–₹2,244 could drag the price toward ₹2,217.
GIFT Nifty & Global Market LinkageIntroduction
The Indian stock market has undergone a remarkable transformation in the past two decades. From being a largely domestic-focused equity market, India has steadily moved into the global financial arena. A very important step in this journey was the creation of GIFT City (Gujarat International Finance Tec-City) and the launch of GIFT Nifty, which has become India’s bridge to global markets.
GIFT Nifty is not just a derivative product; it is a symbolic step that integrates India’s financial markets more closely with global capital flows. At the same time, it creates a transparent and efficient platform for international investors to participate in India’s growth story.
But to fully understand its importance, one needs to see how GIFT Nifty is linked to global markets. Markets today are interconnected like never before—movements in Wall Street, European bourses, or Asian markets ripple across Indian indices. GIFT Nifty acts as a mirror and predictor of India’s domestic market sentiment while being shaped by international factors such as U.S. Fed policy, global interest rates, oil prices, and geopolitical risks.
This detailed explanation will cover:
What is GIFT Nifty?
The journey from SGX Nifty to GIFT Nifty.
The significance of GIFT City as India’s international financial hub.
GIFT Nifty’s role in India’s global financial integration.
Global market linkages – how global events influence GIFT Nifty.
Correlations with U.S., Europe, and Asia-Pacific markets.
Opportunities and challenges ahead.
The future of GIFT Nifty in shaping India’s financial markets.
1. What is GIFT Nifty?
GIFT Nifty is a derivative contract (futures and options) based on the Nifty 50 index, but traded on the NSE International Exchange (NSE IX) located in GIFT City, Gujarat.
It allows foreign investors to participate in India’s benchmark index without going through complex registration processes like FPI (Foreign Portfolio Investor) rules in the domestic market.
The contracts are USD-denominated, meaning global traders can easily buy and sell without worrying about INR conversion.
GIFT Nifty runs for almost 21 hours a day, covering Asian, European, and U.S. trading hours—making it one of the most globally accessible contracts linked to India.
In short, GIFT Nifty provides a real-time pulse of how global investors view India, almost around the clock.
2. From SGX Nifty to GIFT Nifty
Earlier, India’s Nifty futures were traded heavily on the Singapore Exchange (SGX), called SGX Nifty.
For nearly two decades, SGX Nifty was the main offshore gateway for international investors to take exposure to Indian equities.
Traders around the world would look at SGX Nifty quotes to predict the opening direction of the Indian stock market.
In fact, SGX Nifty became so popular that even Indian retail traders tracked it overnight to guess how the domestic Nifty would open.
However, in 2018, NSE and SGX had a legal tussle over licensing rights. Finally, in 2022, both parties agreed to shift all SGX Nifty contracts to GIFT City under a “Connect” model.
Now, SGX Nifty is history, and GIFT Nifty is the only official offshore Nifty derivative product. This transition brought trading volumes back under Indian jurisdiction, strengthening India’s position as a global financial hub.
3. GIFT City: India’s International Financial Hub
GIFT City is a special economic zone (SEZ) located in Gandhinagar, Gujarat. Its vision is to create a global financial and IT services hub on par with Singapore, Dubai, and London.
GIFT City offers tax incentives, world-class infrastructure, and a favorable regulatory environment.
The NSE International Exchange (NSE IX) operates here, hosting products like GIFT Nifty.
Banks, insurers, brokers, and global funds are setting up units in GIFT City to tap both Indian and global opportunities.
For India, GIFT City represents a strategic move: instead of foreign investors trading Indian products overseas, they now trade in India itself. This not only boosts financial flows but also gives regulators more oversight.
4. GIFT Nifty’s Role in Global Financial Integration
GIFT Nifty is more than just a futures contract—it symbolizes India’s growing integration with global markets.
Here’s how:
International Accessibility: Investors in New York, London, Hong Kong, or Dubai can trade GIFT Nifty almost anytime, making India’s equity market more globally visible.
Price Discovery: Since trading happens across time zones, GIFT Nifty reflects both global and domestic investor sentiment in near real time.
Hedging Tool: Foreign portfolio investors (FPIs) can hedge their India equity exposure more efficiently.
Liquidity & Volumes: Global participation in GIFT Nifty brings higher liquidity, tighter spreads, and deeper markets.
5. Global Market Linkages – How World Events Affect GIFT Nifty
The beauty (and complexity) of GIFT Nifty lies in its sensitivity to global developments. Because it trades almost continuously, it reacts instantly to global news.
Some of the most important global factors influencing GIFT Nifty are:
U.S. Federal Reserve Policy
Interest rate hikes or cuts in the U.S. directly impact global equity flows.
A hawkish Fed (raising rates) usually hurts risk assets like Indian equities.
GIFT Nifty futures often fall sharply after Fed announcements.
Global Economic Data
U.S. inflation, jobs data, GDP growth, and corporate earnings set the tone for global risk appetite.
Similarly, China’s growth numbers and Europe’s economic indicators affect global sentiment.
Oil Prices
India imports more than 80% of its crude oil needs. A rise in global oil prices usually weakens Indian equities.
GIFT Nifty reacts immediately to Brent crude movements.
Currency Fluctuations
A strong U.S. dollar and weak rupee reduce foreign investor returns.
GIFT Nifty often mirrors INR-USD volatility.
Geopolitical Risks
Wars, conflicts, sanctions, or supply-chain disruptions cause risk-off sentiment globally.
GIFT Nifty, like other emerging market indices, tends to fall under such conditions.
Global Equity Trends
If Wall Street has a strong rally, GIFT Nifty usually trades higher in the U.S. session.
If Asian markets crash early morning, GIFT Nifty shows weakness in the Asian session.
6. Correlation with Global Markets
Let us break down the interconnectedness between GIFT Nifty and major global markets.
a. Link with U.S. Markets (Wall Street)
The U.S. markets (Dow Jones, S&P 500, Nasdaq) are the most influential for GIFT Nifty.
After U.S. closing, GIFT Nifty in the U.S. time zone reacts sharply to tech earnings, Fed speeches, or macro data.
Example: If Nasdaq falls 2% overnight, GIFT Nifty usually opens lower in the Asian session.
b. Link with European Markets
During European hours, GIFT Nifty trades alongside FTSE (UK), DAX (Germany), and CAC (France).
Eurozone recession fears or ECB rate moves affect GIFT Nifty sentiment.
c. Link with Asian Markets
In the morning, GIFT Nifty trades in sync with Nikkei (Japan), Hang Seng (Hong Kong), and Shanghai Composite (China).
A sell-off in China often triggers weakness in GIFT Nifty.
Conversely, optimism in Asian markets boosts Indian sentiment.
7. Opportunities Created by GIFT Nifty
Better Price Discovery for India’s Market
Instead of relying on SGX Nifty, Indian markets now have their own offshore derivative hub.
Boost to GIFT City Ecosystem
Trading volumes, jobs, and financial services activity in GIFT City have surged.
Global Participation in India’s Growth
India is one of the fastest-growing economies. GIFT Nifty allows global funds to participate directly.
Hedging Benefits for FPIs
Foreign investors can protect themselves against Indian market volatility.
Strengthening Rupee’s Global Role
Even though contracts are in USD, India gains visibility as a financial center.
8. Challenges Ahead
Despite its success, GIFT Nifty faces challenges:
Liquidity Migration: Ensuring that volumes remain strong compared to global exchanges.
Awareness: Many global traders still see SGX Nifty as their reference, though it no longer exists.
Competition: Other financial hubs like Singapore and Dubai remain strong competitors.
Volatility Risk: High global interconnectedness means sudden shocks (like COVID-19 or geopolitical events) affect GIFT Nifty instantly.
9. The Future of GIFT Nifty
Looking forward, GIFT Nifty is set to become a cornerstone of India’s financial globalization.
Volumes are rising every month as more global institutions migrate to GIFT City.
New products (like GIFT Bank Nifty, sectoral derivatives, ETFs) may be introduced.
India’s inclusion in global bond and equity indices will further increase offshore demand.
Over the next decade, GIFT City could evolve into a mini-Singapore for Asia.
Conclusion
GIFT Nifty is more than just a trading contract—it is a symbol of India’s financial maturity. By shifting from SGX to GIFT City, India ensured that its financial products are traded on its own soil, strengthening sovereignty and transparency.
At the same time, GIFT Nifty remains deeply connected with global markets. Whether it’s the U.S. Fed, crude oil prices, China’s slowdown, or geopolitical tensions, GIFT Nifty reflects the pulse of global investor sentiment toward India in real time.
In a world where capital moves at the speed of light, GIFT Nifty serves as India’s window to the world and the world’s window to India. Its success will not only strengthen India’s equity markets but also position GIFT City as a major international financial hub in the decades to come.

Part 1 Support ans ResistancePayoff Diagrams (Understanding Profits & Losses)
Options are best understood with payoff diagrams.
Call Buyer → Loss limited to premium, profit unlimited.
Put Buyer → Loss limited to premium, profit grows as price falls.
Call Seller → Profit limited to premium, risk unlimited.
Put Seller → Profit limited to premium, risk high if price falls.
Common Option Strategies
Beginners usually just buy Calls or Puts. But professionals use strategies combining multiple options:
Covered Call → Hold stock + Sell Call to earn income.
Protective Put → Hold stock + Buy Put for protection.
Straddle → Buy Call + Buy Put (bet on big movement either way).
Strangle → Similar to Straddle but strikes are different.
Iron Condor → Sell both Call & Put spreads (profit if market stays flat).

Part 4 Trading Master ClassOptions Premium – How Price is Decided?
The premium (cost of option) depends on:
Intrinsic Value → The real value of option (difference between current price & strike price).
Time Value → More time till expiry = higher premium.
Volatility → If market is volatile, premium is high because chances of big move increase.
Interest Rates & Dividends → Minor effect.
👉 Example:
Reliance = ₹2,600.
Call Option 2,500 Strike = Intrinsic Value = ₹100.
Premium charged = ₹120 (extra ₹20 is time value).
Moneyness of Options
Options are classified as:
In the Money (ITM) → Option already has profit potential.
At the Money (ATM) → Option strike = Current price.
Out of the Money (OTM) → Option has no intrinsic value (only time value).
👉 Example (Stock at ₹500):
Call 480 = ITM.
Call 500 = ATM.
Call 520 = OTM.

Part 3 Trading Master ClassHow Options Work in Practice
Let’s take a real-life relatable scenario:
👉 Suppose you think Nifty (20,000) will rise in the next week.
You buy a Nifty Call Option 20,200 Strike at premium ₹100.
Lot size = 50, so total cost = ₹5,000.
Now:
If Nifty goes to 20,400 → Your option is worth ₹200 (profit ₹5,000).
If Nifty stays at 20,000 → Option expires worthless (loss = ₹5,000).
So, with only ₹5,000, you controlled exposure worth ₹10 lakhs. That’s leverage.
Participants in Options Market
There are four main categories of traders:
Call Buyer → Expects price to go UP.
Call Seller (Writer) → Expects price to stay flat or go DOWN.
Put Buyer → Expects price to go DOWN.
Put Seller (Writer) → Expects price to stay flat or go UP.
