HDFC Short :)I hope you can now see how HDFC represents an excellent low risk profit entry setup allowing you to trade in the market.Take positions so that the risk/reward is in your favor.
Knowing why, where & when a strong reversal signal is being generated will be the only way to capitalize on your technical analysis .
Disclaimer: It should not be assumed that the methods, techniques, or indicators presented in these chart will be profitable or that they will not result in losses. There is no assurance that the strategies and methods presented will be successful for you. Past results are not necessarily indicative of future results. You should not trade with money that you cannot afford to lose. Examples presented in these products are for educational purposes only and it should not be assumed that these are indicative of ordinary trades. These setups are not solicitations of any order to buy or sell. The publisher assume no responsibility for your trading results. There is a high degree of risk in trading.
Hdfcshort

HDFC- short for intraday arnd 1825HDFC - Short around 1825
SL: 10 Points
TGT 20 Points+
On the previous idea i had shared if closing below 1822 - then HDFC will be weaker - SO i have shorted in HDFC
Disclaimer: These are just my views, I am only SHARING my views - kindly do NOT trade blindly with these levels, please do your own research before entering/ or as per advice from your own financial adviser.

HDFC is set for a downfall , sell futures for better resultsTarget : 2%
Risk : 1%
Please comment for any doubts!

WILL HDFC CHANGE ITS BUY MODE TO SELL SEE YOURSELF !Hi traders,
last week I mentioned in this stock is quoting for your consideration " As soon as trend progress, my analysis moves with sentiments.
2. A dotted red color zone if not taken out in 2 hr time frame then this will become buy zone. on the contrary, if taken out then the trend will change to down.
3. If next session trading takes out last candle high in 2 hrs time frame then price can move to the white dotted line." . You can see price moved to the white dotted line target achieved. The red dotted zone remained intact and priced moved up. When this movement started I informed by highlighting the white circle pattern that is bullish harami. What a move Hdfc gave to traders in the last ten days. Every bit of movement was covered in two analyses in a week. you can see fig below of the previous update and compare it with today's figure.
Trading plan of next week
1. I made one red dotted zone till this is not taken out in 4 hr time frame positional long will validate with the target of red channel upper band.
2. On the contrary if red dotted zone is taken out then short with the target of the yellow dotted zone. This zone might act as a halt for consolidation and the trend might resume to a red solid line down.
3. Upside if the price breaks the red channel band then the blue dotted line will act as tough resistance. So try to see a short set up. Positional long shorts use red and yellow dotted lines as a stop-loss point.
4. Taken out condition is as follows:-
Taken out condition works in the two-time frame combination for daily( 4 hr + 1 day) analysis. Similarly, work for lower time frames is also a two-time frame combination. For intraday trades 1 hr with 15 min. For taken out condition price has to complete in both time frames. Aggressive traders can take that side position in a lower time frame with the stop loss of breached candle low. In both the time frames given line is breached by a candle that candle high is to be breached by next candle and close should be above the previously breached candle. This is how taken out condition is being implemented.
The rest market will decide.
YOGESH VATS
Disclaimer:- All positions should be taken with the consultation with your adviser. This all is for educational purposes.

INTRADAY TRADE IN HDFCINTRADAY TRADE IN HDFC
SHORT@1766
STOP@17780
TARGET@1750
!!please note trade with caution!!
!!manage your risk!!
!!trade-wise!!
!!please adjust for future rates!!

HDFC - Is new Pricing channel emerging? HDFC price has twice breached previous price channel. Once, it has recorded high of 1920. Second time, price has recorded lower high at 1836. An existing price channel is between 1500 to 1760. Let us now blend key announcement with technical analysis. HDFC has announced 20 bps cut in the lending rate to its existing retail loanholders. This will have some impact on revenue and margins as retail loans constitute close to 85% of loan portfolio. Thus, we expect correctiob below 1760.

CONDITIONAL INTRADAY TRADE IN HDFC CONDITIONAL INTRADAY TRADE IN HDFC
SHORT@1820(BELOW)
STOP@1845
TARGET-1@1800
TARGET-2@1793
TARGET-3@1775
!!please note trade with caution!!
!!manage your risk!!
!!trade-wise!!
!!please adjust for future rates!!


INTRADAY IN HDFCINTRADAY IN HDFC
SHORT@1505
STOP@1515
TARGET@1485
QTY=1500
!!please note trade with caution!!
!!manage your risk!!
!!trade-wise!!
!!please adjust for future rates!!

GREAT POSITIONAL SHORT ON HDFC(NSE)This analysis is only for educational purposes, Invest at your own risk!
HDFC broke its support level at price 1635 INR (approx) with a strong volume hence explaining a strong downtrend
The Volume indicates that the price may even drop to its next support level at price 1200 INR just like in the case of SBIN .
The On BALANCE VOLUME indicator also shows a steep downtrend and hence opens a great shorting opportunity for traders.
I would suggest traders to sell when the price heads down even low hence confirming our down trend.
Traders should use a trailing stop-loss to get out with profit as soon as the trend reverses.
Any kind of criticism is highly appreciated !
CHEERS!

INTRADAY TRADE IN HDFC FUTINTRADAY TRADE IN HDFC FUT
SHORT@1626
STOP@1640
TARGET@1600
QTY=750
!!please note trade with caution!!
!!manage your risk!!
!!trade-wise!!
!!please adjust for future rates!!
!!intra-day ideas series everday at between 9:30 to 10:30!!


HOUSING DEVELOPMENT AND FINANCE CORP. HDFC REVIEWIT IS RESPECTING CHANNEL LINE WITH STOP LOSS OF UPPER LINE CAN GO SHORT TARGETS ARE GIVEN BUT LET DEMAND ZONE BE BROKEN ON CLOSING BASIS WITH GOOD CANDLE NOT HAMMERS IF HAMMERS ARE MADE IN DEMAND ZONE CONSIDER IT A WARNING OF TREND REVERSAL GOOD LUCK
NOTE: TRADE AT YOUR OWN RISK

HDFCBANK: THE TOP IS HEREI think HDFCBANK has topped in a medium term. There are many things aligning up and all say that HDFCBANK's top is in.
The RSI has divergence, There is a long term trendline acting as a resistance. Also in the shorter term there is resistance as well.
The chart is very clear and speaks for itself.
CMP: 1296.7
Stop loss: 1318
DATE: DECEMBER 22, 2019
Your trades are your own sound decision. I'm not responsible for them.
DATE: DECEMBER 22, 2019

SHORT TRADE IN HDFC !!(DEC FUT)!!SHORT TRADE IN HDFC !!(DEC FUT)!!
VIEW
-BEARISH ENGULFING ON DAILY CHART
-RSI REVERSAL (-VE)
TRADE VIEW
DEC FUT
SHORT@2325
STOP@2290
TARGET@2355
LOT:250
QTY:2

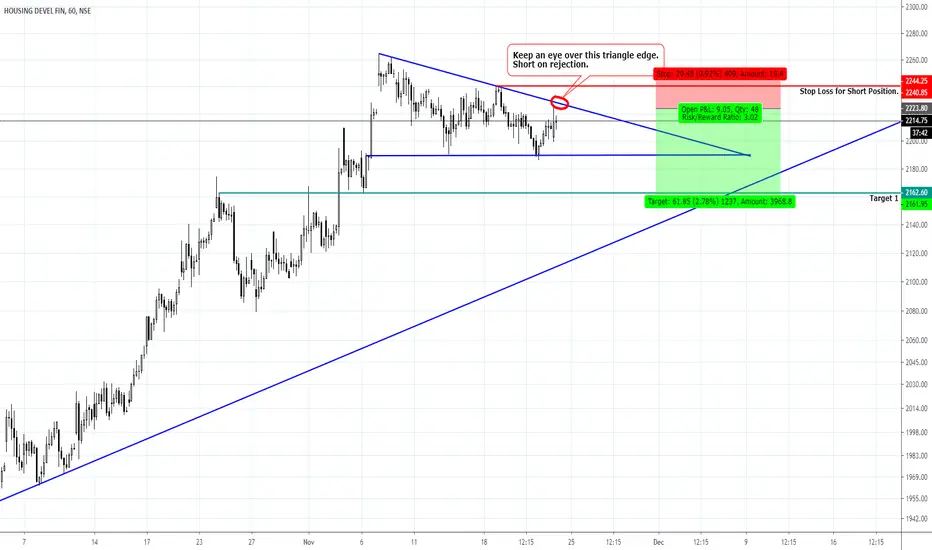
"HDFC" - Short/Sell Trade Setup.1. HDFC is forming an triangle on the top.
2. Triangles are 50-50 they can breakout and breakdown and keep the direction continue.
3. Taking a short trade on the edge of triangle provides you better Risk:Reward Ratio.
4. Mentioned target is small because of a support trendline is coming up there, if it breaks down that trendline in upcoming week than it can go more down.
Follow our telegram channel for Updates over the charts.
t.me