Head-and-shoulder

Godrej Ind Break outGodrej Ind has given a breakout of H&S pattern, Probable Target 1070, Time Period about 2 months

PROZONE REALTY: POSSIBILITIES FOR MULTIPLE PATTERN B/OUTPROZONE : After consolidation from 40-20/25 range has started showing momentum.In weekly chart shows possibilities for Inv Head &Shoulder/Cup&Saucer break out.
Going by the pattern,If sustains at above 41 likely to test 50+(For educational purpose only)

Sell Cromton - as H&S breakdown on Weekly time frame.. Cromton Grews look like go downside because Head & shoulder pattern breakdown on Weekly Timeframe!
target 183 & 138 as per chart & Price action

Sunflag Iron & Steel Company Ltd - Long callSunflag Iron & Steel Company Ltd Analysis report.
Stock has broken 10 years trend line with gapup indicating strong momentum.
also forming inverted head and shoulder.
Safe to enter near neck line - sock may retest the neck line.
entry 153
SP - Trendline - 143
Target 190 :)

HEAD AND SHOULDER BREAKOUT (AWL)Head And Shoulder Breakout
CMP: 435
Targets for Downside: 591 and 551
SL: 671 Above Previous Swing High
AWL Broke this years major support retested the support area and now heading to downside.
Disclaimer: This is for educational purposes only, not any recommendations to buy or sell.

Natural gas farming too many head & shoulders patterns 20 Dec 22There are multiples Head and Shoulder pattern seen in Natural gas in Daily and Weekly timeframe make us feel bearish below 436

head and shoulder in the makingstock is about to give a breakdown after forming a head and shoulder pattern on weekly time frame


Auto Sector turned into Corrective WaveM&M is biggest weitage stock in NiftyAuto. It has broken Daily Trend. Could be sign of reversal with supply demand balance resolving with strong down move.

PVR chart studyHead & shoulder pattern forming in PVR Daily chart
Trendline is broken on 16th Sept
Looks like possible candidate for short term downtrend
Correct me if im wrong
For Educational purpose only

VIJAYA - Retest + Reversal - Big Potential - Swing TradeThe analysis is done on daily TF hence price may take few days to few weeks in order to reach the targets.
Trade setup is explained in image itself.
The above analysis is purely for educational purpose. Traders must do their own study & follow risk management before entering into any trade
Checkout my other ideas to understand how one can earn from stock markets with simple trade setups. Feel Free to comment below this or connect with me for any query or suggestion regarding this stock or Price Action Analysis.

HFCL Ltd - Inverse Head & shoulderHFCL Ltd has made a Inverse Head and shoulder pattern in D1 Time frame. It also give a breakout with good volume. One can buy 50% above today high and wait for retest to buy remaining 50% with recent low as stoploss. Recent swing high's are taken as Target.
Trail your stop-loss.
Disclaimer :- I'm not a SEBI registered analyst. This is my personal view. Given information is for educational purpose only. Do your own analysis before investing

Nifty Head & Shoulder Pattern Breakdown1hour Chart Frame - Nifty can down for gap feeling. Short time bearish.
Gap Range : 16380-16500
For bullish - must be Retested last breakover levels within weekend.

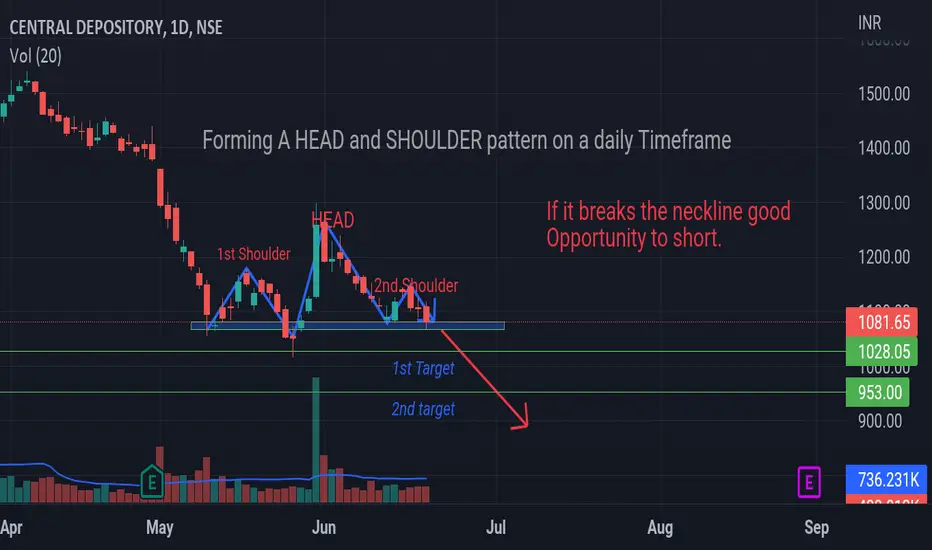
CDSL --- A PERFECT TIME TO SHORTThis is the daily chart of CDSL i.e Central Depository.
Currently it has made a price action pattern i.e HEAD AND SHOULDER
If it breaks it's neckline, it will be a perfect entry with a small stoploss and a target of roughly ₹50.
*NOTICE*
I AM NOT SEBI REGISTERED.
I WILL NOT BE RESPONSIBLE FOR YOUR LOSSES
TCS 1D HEAD AND SHOULDERSIn this chart, 1Day time frame we can see the triple top Pattern
Currently the price is in neckline and retesting. After Retesting there will be a good chance of fall.

Head & Shoulder Pattern forming in Crypto World !?!Am i the only one, or do I see a Head & Shoulder Pattern, being formed in the crypto world..An example being ETHUSDT or MaticUSDT - Is more pain ahead...!?!

Cholahldng - Cholamandal Finance Inverted head and shoulderNSE:CHOLAHLDNG
Cholahldng - Daily Chart
Pattern : Inverted Head and Shoulder (Incomplete)
View: Bullish for long term
Neckline : 710.00
CMP : 690.40
Buy: 701 (50%) - 711 (50%)
Stop loss: 663
Short term Target : 740 - 760
Long term Target : 760 - 860 - 1000 - 1200

UPL ltd. bead and shoulder pattern formationUPL ltd. Formed a head and shoulder pattern and it can achieve the possible target of 790.

Head and Shoulder break down in Indiamart IntermeshHi,
I am new to charting, but I noticed that Head and Shoulder pattern in Indiamart Intermesh. Levels on the Chart.
Please comment, if the analysis is right or wrong by giving reasoning so that I can also learn.
This post is not any recommendation. I am just posting to learn myself.

Is this the End of Bearish Trend ?Let's wait for the breakout of level 1.26351. inverted Head and shoulder pattern is formed.

Inverse head and shoulder HINDPETRO long IntradayBeautiful Inverse head and shoulder pattern gave neckline breakout and now testing it from above. It offers a good entry at this level for intraday trade
