Konkan Railway contract and many moreInverted Head and Shoulders Pattern
Overall looking +ve
Long term Target can be: ₹1200+
Head and Shoulders

DEEDEV |Inverted Head & Shoulders | Daily🚀 BO from Inverted Head & Shoulders near ₹308 neckline
📷 Volumes are missing.
📷 Watch for price sustaining above 308
#DEEDEV #InvertedHeadAndShoulders #Breakout #ChartPatterns #NSE #PriceAction

TEXRAIL: Breakout FocusTEXRAIL has recently exhibited a notable technical development on the daily chart. On Friday, 16 May , the stock completed a breakout from an inverted head and shoulders pattern, a formation often associated with potential trend reversals. The breakout occurred with a decisive close above the neckline, which had previously acted as a key level of resistance and had been tested multiple times, reinforcing its technical significance.
Following the breakout, the price action has respected the neckline as a new support level, with multiple successful retests and rebounds observed. As of today’s session, TEXRAIL has once again rebounded from a brief consolidation phase, accompanied by a substantial increase in trading volume—approximately 18M shares , significantly above its recent average. This surge in volume may indicate renewed interest and participation from market participants.
Momentum indicators are also aligning with the bullish structure. The Relative Strength Index (RSI) is currently approaching the 70 level , suggesting strong upward momentum, though it is nearing overbought territory. Additionally, the MACD histogram is showing signs of potential short-term consolidation or profit-taking, particularly as the price approaches a previously identified supply zone.
Looking ahead, the chart outlines three potential resistance levels that may act as intermediate targets or areas of interest for traders monitoring the trend. These levels are derived from historical price action and volume profile analysis.
📊 Please refer to the accompanying chart for a visual breakdown of the pattern, volume dynamics, and resistance zones.
Disclaimer:
The information provided in this analysis is intended solely for educational and informational purposes. It does not constitute investment advice, a recommendation, or an offer to buy or sell any securities. Always conduct your own research or consult with a qualified financial advisor before making any investment decisions.

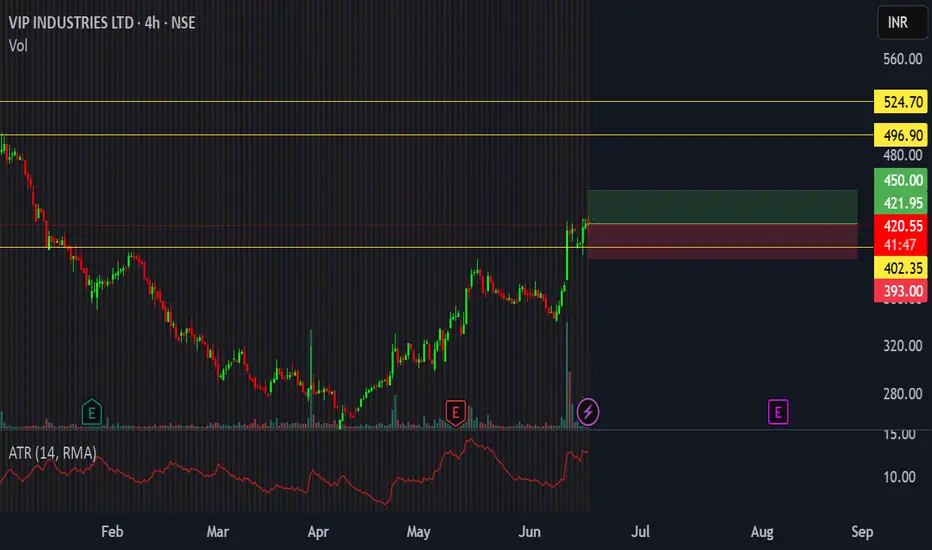
VIP Ind Short Term TradeA head and shoulders pattern is visible on the charts
The breakout is supported with high volume, and after the breakout resistance has turned into support
Thus, for a short term trade,
tgt 450 , sl 393
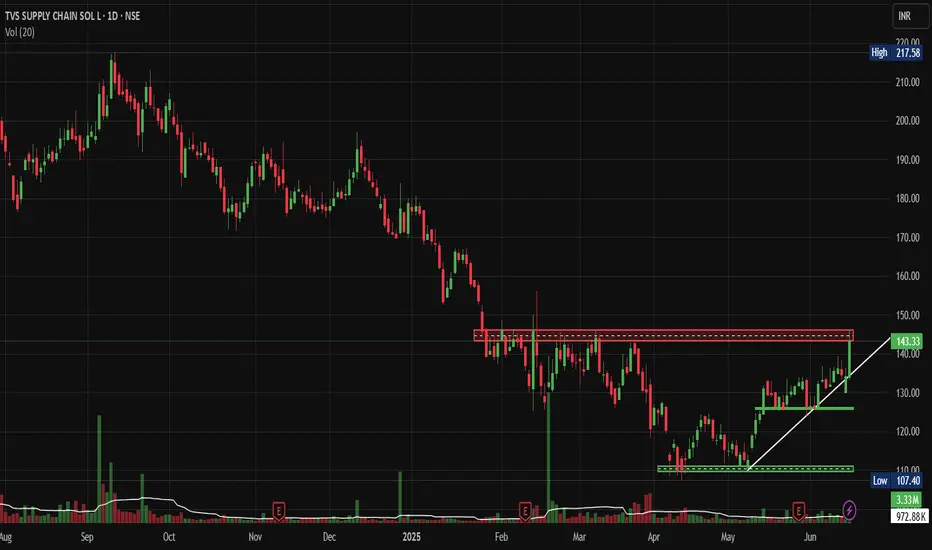
TVS Supply Chain: BO attempt after 6 Month Consolidation.This Supply Chain Giant is attempting to break out. After 6 Months of Consolidation - Is it Time to Load Up? Let's analyse today's Idea.
Price Action Analysis:
Current Market Structure:
• Stock is currently trading at ₹143.33, showing a strong +6.83% gain
• Price has broken above a key resistance zone around the ₹140 level
• Clear uptrend formation with a higher highs and higher lows pattern emerging
• Recent breakout attempt from a prolonged consolidation phase
Historical Price Movement:
• Stock witnessed a sharp decline from highs of ₹217+ in late 2024 to lows around ₹107
• Extended consolidation phase from February to May 2025 between ₹110-145 levels
• Current breakout attempt suggests potential trend reversal from bearish to bullish
Volume Spread Analysis:
Volume Characteristics:
• Significant volume spike visible during the recent breakout session
• Volume of 3.33M is substantially higher than the 20-day average of 972.88K
• Volume confirmation supporting the price breakout attempt above resistance
• Previous volume spikes coincided with major price movements
Volume Price Relationship:
• Healthy volume-price relationship during the current upward move
• Relatively lower volumes accompanied earlier decline phases
• Current breakout attempt volume suggests institutional participation
Key Technical Levels:
Support Levels:
• Primary Support: ₹130-132 (previous resistance turned support)
• Secondary Support: ₹120-125 (consolidation zone low)
• Major Support: ₹110-115 (multi-month consolidation bottom)
Resistance Levels:
• Immediate Resistance: ₹150-155 (psychological level)
• Medium-term Resistance: ₹165-170 (previous swing high)
• Major Resistance: ₹185-190 (Fibonacci retracement level)
Base Formation:
• Rectangle consolidation pattern formed between ₹110-145 levels
• Base duration: Approximately 4-5 months (February to May 2025)
• Breakout from this base suggests potential for sustained upward movement
Technical Patterns:
Primary Patterns:
• Rectangle/Box pattern completion with upward breakout attempt
• Potential inverse head and shoulders pattern on a longer timeframe
• Ascending triangle formation in recent weeks before the breakout
Trend Analysis:
• Short-term trend: Bullish (breakout confirmed)
• Medium-term trend: Transitioning from bearish to bullish
• Long-term trend: Still in recovery phase from major decline
Trade Setup and Strategy:
Entry Strategy:
• Aggressive Entry: ₹143-145 (current levels on any minor pullback)
• Conservative Entry: ₹135-138 (on retest of breakout level)
• Volume confirmation is required for any entry
Position Sizing:
• Risk 1-2% of portfolio capital on this trade
• Position size calculation: Portfolio Value × Risk % ÷ Stop Loss Distance
• Example: For ₹1,00,000 portfolio with 2% risk = ₹2,000 risk capital
Risk-Reward Calculation:
• Risk-Reward Ratio: Minimum 1:2 preferred
• Expected risk per share: ₹15-20 based on stop loss placement
• Potential reward: ₹30-40 per share to the first target
Exit Strategy:
Profit Targets:
• Target 1: ₹165-170 (15-20% upside) - Book 40% position
• Target 2: ₹185-190 (30-35% upside) - Book 40% position
• Target 3: ₹200+ (40 %+ upside) - Trail remaining 20% position
Stop Loss Levels:
• Initial Stop Loss: ₹125-128 (below consolidation support)
• Trailing Stop: Move to breakeven once Target 1 is achieved
• Final Trail: Use 10-day EMA or ₹10-15 trailing stop
Risk Management Framework:
Risk Control Measures:
• Maximum loss per trade: 2% of total capital
• Position sizing based on stop loss distance
• No averaging down if the trade goes against the initial thesis
• Exit if the technical structure breaks down
Portfolio Allocation:
• Maximum exposure to single stock: 5-8% of portfolio
• Sector allocation limit: 15-20% to logistics/supply chain
• Maintain diversification across market caps and sectors
Sectoral Analysis:
Logistics and Supply Chain Sector:
• The sector has shown resilience post-pandemic disruptions
• Growing e-commerce and digitalization are driving demand
• Government infrastructure push benefiting logistics companies
• Increasing focus on supply chain optimization across industries
Sector Positioning:
• NSE:TVSSCS is positioned in the growing third-party logistics market
• Beneficiary of Make in India and manufacturing growth
• Automotive sector recovery supporting the company's core business
Fundamental Backdrop:
Business Overview:
• Leading third-party logistics and supply chain solutions provider
• Strong presence in automotive, consumer goods, and industrial sectors
• Integrated service offerings including warehousing, transportation, and value-added services
Growth Drivers:
• Expansion in new geographies and service offerings
• Technology-driven efficiency improvements
• Growing outsourcing trend in supply chain management
• Recovery in the automotive sector supporting traditional business
Market Outlook and Catalysts:
Positive Catalysts:
• New client acquisitions and contract wins
• Capacity expansion announcements
• Favourable government policies for the logistics sector
Risk Factors:
• Economic slowdown affecting industrial demand
• Fuel price volatility is impacting transportation costs
• Competitive pricing pressure in the logistics industry
• Global supply chain disruptions
My Take:
TVS Supply Chain Solutions presents a compelling technical setup with the recent breakout attempt from a multi-month consolidation. The combination of strong volume confirmation, supportive sectoral trends, and improving fundamental backdrop makes this an attractive opportunity for Short to medium-term investors. However, proper risk management and position sizing remain crucial for the successful execution of this trade setup.
Keep in the Watchlist.
NO RECO. For Buy/Sell.
📌Thank you for exploring my idea! I hope you found it valuable.
🙏FOLLOW for more
👍BOOST if you found it useful.
✍️COMMENT below with your views.
Meanwhile, check out my other stock ideas on the right side until this trade is activated. I would love your feedback.
Disclaimer: "I am not a SEBI REGISTERED RESEARCH ANALYST AND INVESTMENT ADVISER."
This analysis is intended solely for informational and educational purposes and should not be interpreted as financial advice. It is advisable to consult a qualified financial advisor or conduct thorough research before making investment decisions.
Wockhardt-Bad fundamentals, Strong technicals!Wockhardt is an age old Indian pharma company which has been in loss since few years.
Stock has bounced from strong support and also gave inverted head & shoulders breakout.
Stock is consolidating post breakout.Not my usual technofunda pick but a very attractive technical breakout. Please know that risk is more with such ideas.

MAXHEALTH | Inverted Head and Shoulder | Breakout | ATH
## 🩺 **MAXHEALTH – Inverted Head and Shoulder Breakout Analysis**
### 📊 **Pattern**:
✅ **Inverted Head and Shoulder** formation confirmed
* Base support near: ₹936
* Breakout zone: ₹1,200
* Current price: ₹1,232.80
* **Volume spike** on breakout = bullish confirmation
---
### 📐 **Breakout Target Calculation**
* Depth of Cup: **₹255.20**
* Target = ₹1,200 + ₹255.20 = **₹1,455.20**
📌 **Target Area marked** on chart near ₹1,455
---
### 🔍 **Key Technical Insights**
* **Resistance turned support**: ₹1,200 zone
* Strong **volume breakout** above resistance
* Handle was short & tight, indicating bullish strength
* RSI likely above 60 (momentum favoring bulls – though not shown here)
---
### 🎯 **Levels to Watch**
* **Support**: ₹1,200 (neckline), then ₹1,120
* **Resistance**: ₹1,300 minor, **₹1,455** is the measured move target
---
### 📈 **Bias**: **Bullish**
* Price + Volume + Pattern = Valid **Breakout**
* Position traders can aim for **₹1,455** with SL ₹1,200
---

Usoil trade setup Very bullishUSOIL harmonic chart pattern
Head & Shoulder Pattern for few days.
Levels marked on the chart.
#bullish
#harmonic
#USOIL

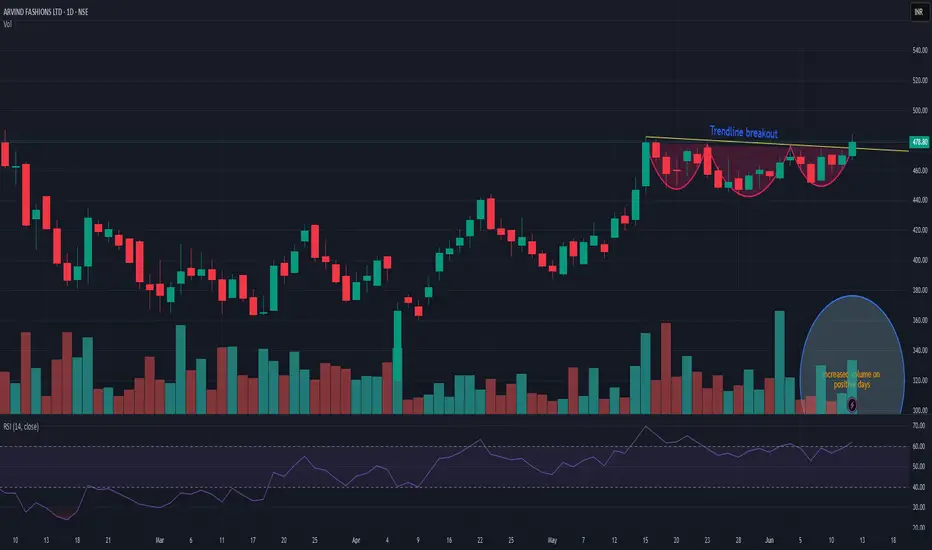
ARVINDFASNARVINDFASN showing very good strength on this negative days as well and currently trying to coming out of consolidation. As long as it is closing above 440 then dips are good to accumulate. Positive momentum may fetch the stock up to 600 in near term. And next trigger level can b above 485. Wait for the perfect entry point.
PAYTM KARO PAYTM CMP - 975. If it cross and closs above 1050, chances of 1350 to 1700++ 900 strong support - Making inverse head and shoulder pattern so upside chances are higher...
One 97 Communications Ltd
About
Incorporated in 2000, One 97 Communications Ltd is India's leading digital ecosystem for consumers as well as merchants. As of March 31, 2021, the company has a 333 million+ client base and 21 million+ registered merchants to whom it offers payment services, financial services, and commerce and cloud services.
Key Points
India’s Leading Digital Ecosystem Platform
The company owns and operates India’s leading mobile payments and financial services distribution brand Paytm. It has built the largest payment ecosystem with a registered merchant base of 4.2 Cr, and 112 lakh payment devices facilitating over 1,100 transactions as of Q2 FY25.
Business Segments
1) Payment Services (59% in H1 FY25 vs 69% in FY22): The segment includes:
a) Payment Processing: Consumers can use cards, net banking, UPI, and UPI Lite to make online payments on the Paytm app including in-store payments through QR codes and devices.
b) Merchant Subscription: The company allows merchants to accept payments via QR codes, POS devices, payment gateway products, Soundbox devices, etc.
Operational Metrics:
Avg Monthly Transacting Users (Cr): 7.1 in Q2 FY25 vs 9.6 in FY24 vs 6.1 in FY22
Total Merchant Subscriptions (Lakhs): 112 in Q2 FY25 vs 107 in FY24 vs 29 in FY22
Gross Merchandise Value (Rs. Lakh Cr): 4.5 in Q2 FY25 vs 18.3 in FY24 vs 8.5 in FY22
2) Financial Services (21% in H1 FY25 vs 9% in FY22): The company offers mobile credit, insurance, and wealth management for consumers and merchants. It is also engaged in the loan distribution business, with capabilities across the entire loan lifecycle including origination, loan management, and collection. In Q2 FY25, the company disbursed loans totaling Rs. 5,280 Cr vs Rs. 52,390 Cr in FY24 and Rs. 7,623 Cr in FY22. 47% of the loans disbursed in FY24 were postpaid loans, suspended since May 2024, due to a decline in asset quality across the industry.
3) Marketing Services (20% in H1 FY25 vs 22): The company offers marketing services including ticketing, deals, gift vouchers, advertising, and loyalty services. It also distributes co-branded credit cards. The Gross Merchandise Value (GMV) for ticketing, deals & gift vouchers, etc., was Rs. 2,383 Cr in Q2 FY25. It has 13.8 Lakh activated credit cards as of Q2 FY25 vs 8.7 Lakh in Q2 FY24.
New Launches
In Nov 2024, the company launched UPI LITE Auto Top-up for recurring daily payments under Rs. 500. In H1 FY25, it added ticket booking services to Samsung Wallet, introduced Paytm Health Saathi for merchant partners, and unveiled India’s first NFC Card Soundbox.
Partnerships
In H1 FY25, the company partnered with FlixBus, to offer intercity bus travel tickets directly through the Paytm app and collaborated with Axis Bank to provide POS solutions and EDC devices (card machines) to the Bank & its merchant network.
Reduction of Marketing Expenses
In FY24, the company invested 9% of its total revenues on marketing and promotional expenses vs 17% in FY22.
Divestments
1) In Aug 2024, the company sold its movie ticketing business and events business to Zomato Ltd, for Rs. 2,048 Cr.
2) In Dec 2024, the company’s WOS Paytm Singapore sold its Stock Acquisition Rights in Japanese Payments Firm PayPay for Rs. 2,364 Cr.
Transfer of Business
In Sept 2021, the company transferred its Online Payment Aggregation Business to its WOS, Paytm Payments Services Ltd (PPSL). PPSL is pursuing a Payment Aggregator license from the RBI. After initial rejection in 2022 due to FDI compliance issues, PPSL secured government approval for past investments in Aug 2024 and has resubmitted its application. As of Jan 2025, PPSL is awaiting the RBI's decision on its resubmitted PA license application.
RBI Restrictions
In Jan 2024, the RBI restricted all services of Paytm Payments Bank Ltd (PPBL), a 39% associate of the company, permitting only the withdrawal of the existing customer balances however in Oct 2024, NPCI approved the company to onboard new UPI users In Oct 2023, RBI also imposed a monetary penalty of Rs. 5.39 Cr on PPBL.
This is just to boost my confidence. No Suggestions for buying. I will keep checking and updating my mistake if last post gone wrong...
Disclosure: I am not SEBI registered. The information provided here is for educational purposes only. I will not be responsible for any of your profit/loss with these suggestions. Consult your financial Adviser before making any decisions.

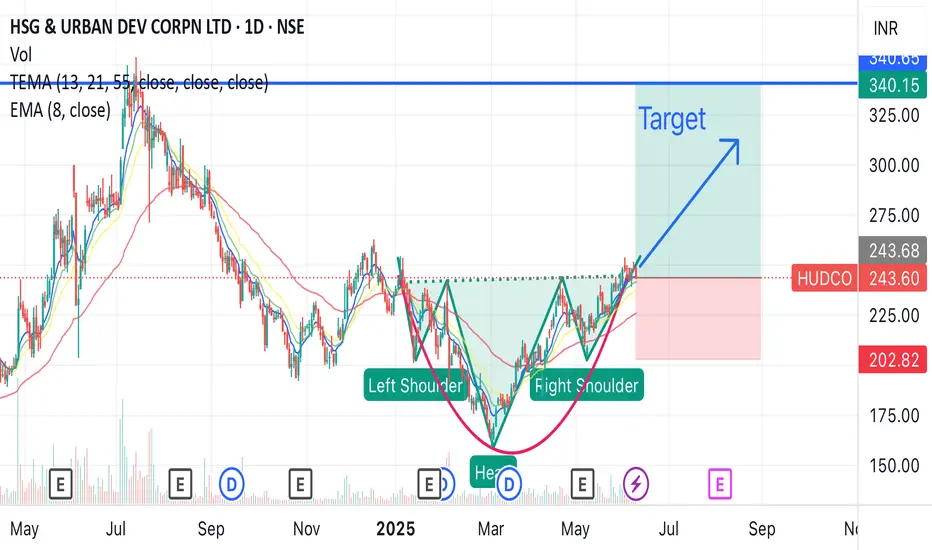
HUDCO head and shoulder breakoutHUDCO is great stock with good fundamentals, giving head and shoulder breakout soon in short term with 35% upside
Buy at - 243
Target - 340
Hold duration - 1 to 2 months
Inverse Head & Shoulders Breakout – SHAREIND Poised for a 22% RaAfter a sustained downtrend, SHAREIND (SESHIND) has formed a clear Inverse Head & Shoulders on the daily chart:
Left Shoulder around ₹180
Head around ₹138
Right Shoulder around ₹180
Neckline near ₹190
With the neckline successfully cleared, the measured move (~42 points or 22%) projects targets of:
1️⃣ Target 1: ₹217
2️⃣ Target 2: ₹232
Risk Management:
Entry: On daily close above ₹190 (neckline)
Stop Loss: ₹169.50 (just below the neckline swing low)
Risk–Reward: ≈1 : 2.2 (SL ~₹20 vs. upside ~₹42)

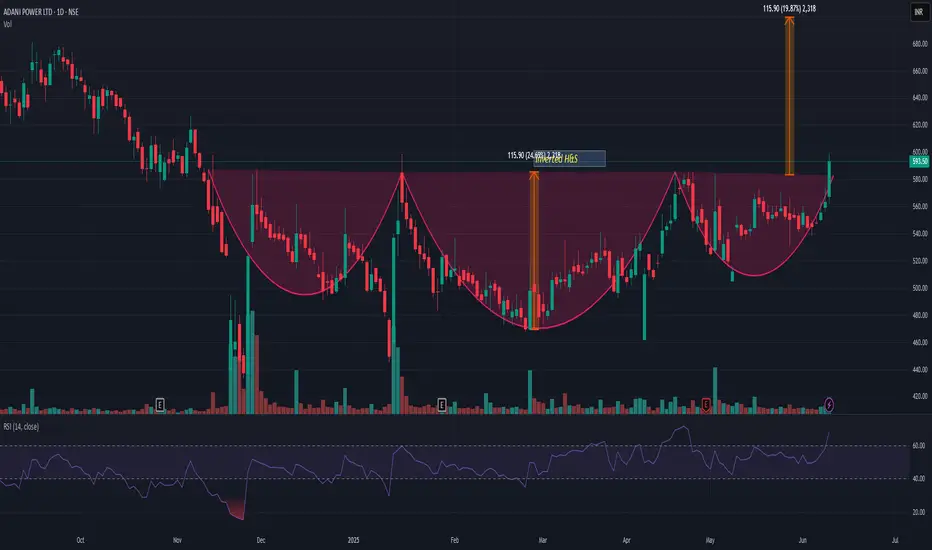
ADANIPOWERADANIPOWER has given inverted H&S breakout with very good volume. All ADANI stocks showing a strength. If we look at the pattern then it may add more 18-20% from here. My view may change we it closes below 540.
MAXHEALTH | Inv HEAD AND SHOULDER | WACHLISTChart patterns shown for MAX Healthcare (NSE: MAXHEALTH):
---
🔍 **Pattern Observed:**
The chart showcases an INV HEAD AND SHOULDER pattern in progress, which is a bullish continuation pattern.
---
🔹 **Key Levels:**
* **resistance (neckline breakout)**: \~₹1,195–₹1,227 zone
* **Current price:** \~₹1,194.60

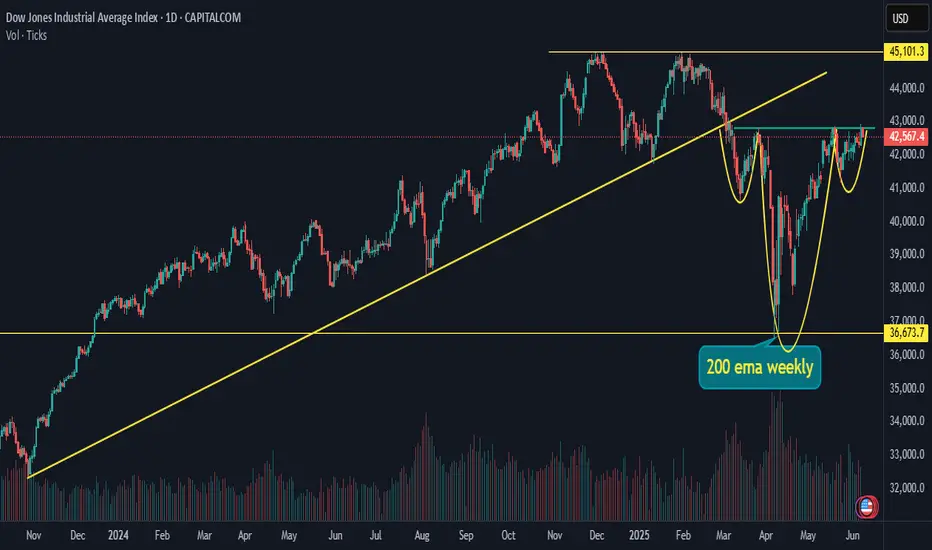
US 30 / Dow Jones / DJI forming bullish patternLooking at US30 US market is forming a bullish pattern called inverted Head and shoulder breakout can lead to a target of all time high.
BANKINDIABANKINDIA is currently trading above resistance breakout and also recently has shown Inverted H&S breakout as well. Volume in recent session has been increased. If we check pattern target then it has a potential to go up to 160-70 level. I may change my view if it closes below 120. In recent time I have observed traction in all PSU banking stock. Is it something that we don't know!! Chart is indicating something to be watched very closely. Keep it on radar.

GODREJIND: Supply zone breakout4. GODREJIND
-big breakout through the supply zone
-strong parent company
-the pattern can be interpreted as an inverted head and shoulders pattern

CNXITThe CNX IT index is currently forming an inverse Head & Shoulders pattern, a bullish reversal formation. The index made a bottom at 30918 on 7th April 2024, which aligns with a prior support zone tested on 4th June 2024, followed by a strong upward move. This double test of support indicates a solid base formation.
If the pattern plays out, a breakout above the neckline could open the way toward the supply zone of 41600–43430, where previous selling pressure was observed.

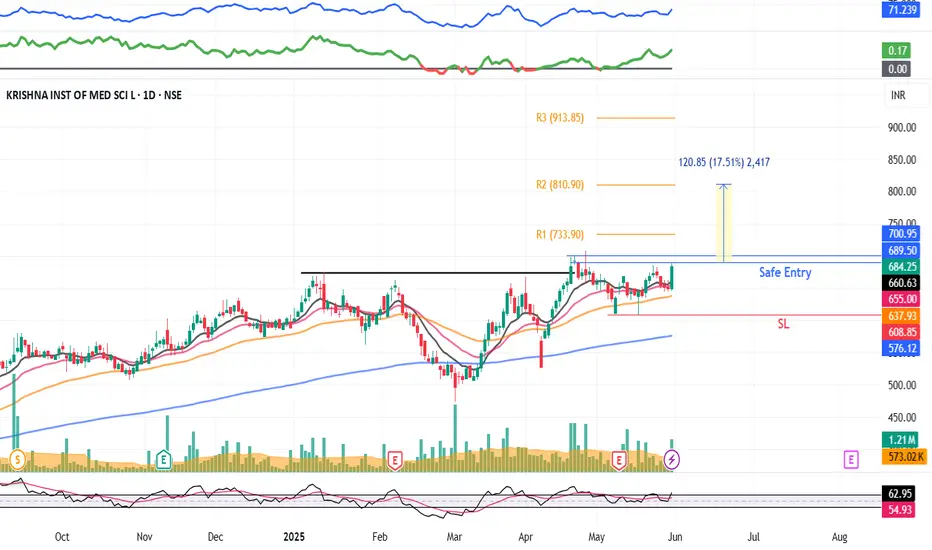
KIMS : Swing pick#KIMS #Swingtrade #trendingstock #breakoutstock
KIMS : Swing Pick
>> Breakout Stock
>> Trending setup
>> Good Strength in Stock
>> Good Volumes Buildup
>> Good Upside Potential
Swing Traders can lock profit at 10% and keep trailing
Disc : Stock charts shared are for Learning purpose not a Trade recommendation.
Consult a SEBI Registered Advisor before taking position in it.
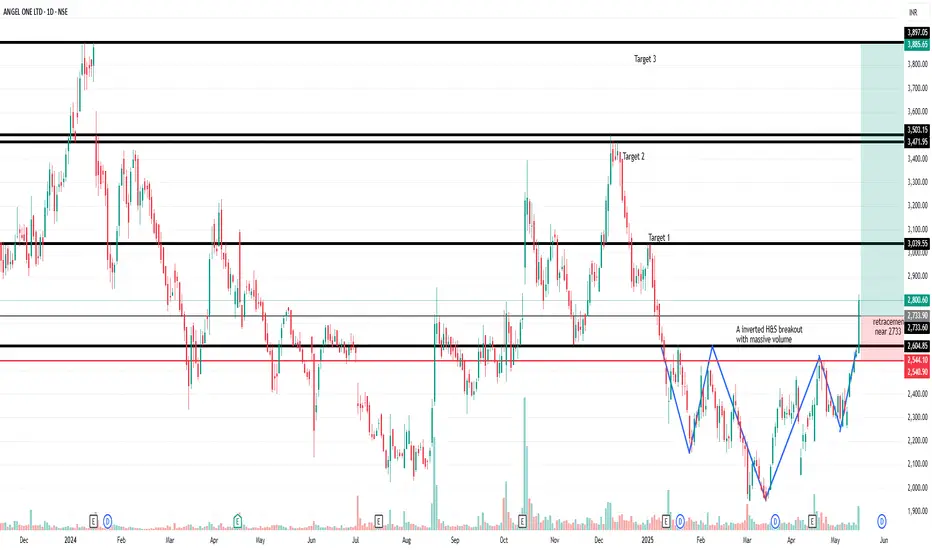
ANGEL ONE: AN INVERTED H&S BREAKOUT WITH MASSIVE VOLUMN16th May 2025 / 10.00 PM
BUY ANGEL ONE with Target 3885 and SL 2544
1. Stock made clear inverted H & S pattern
2. Massive volume is observed on break out
3. Wait for a retracement at 2735 level for a retracement buy
4. Entry can be made on EAM 20 retracement on daily chart.
Expected Targets and SL are mentioned in Chart
Note: It's a swing trade. Risk Reward is excellent in this trade.
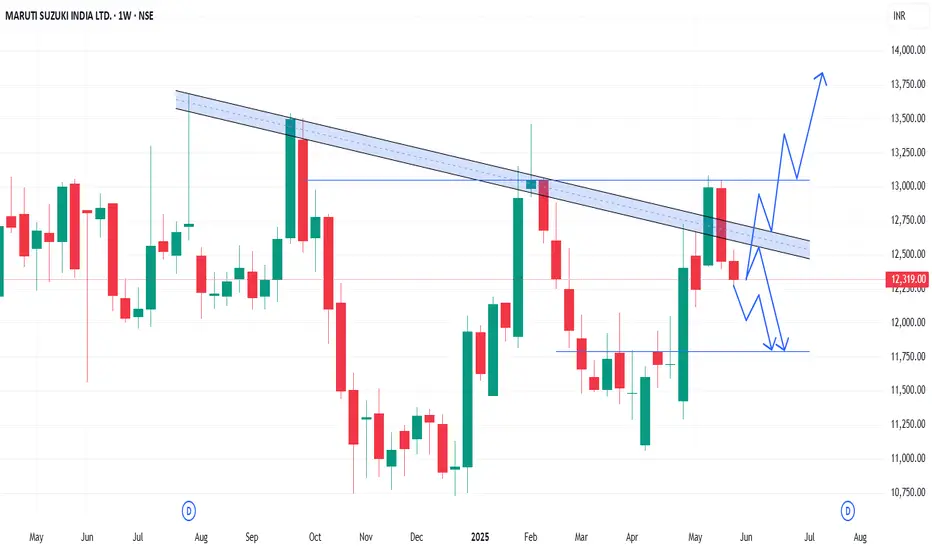
MARUTI - Weekly AnalysisIn the Weekly Chart of MARUTI ,
we can see that; it has shown rejection of Inverted H&S and Cup & Handle at the same time.
Even after rejection, selling is not that strong as it should be.
Possible momentums are shown in chart.
Lets see what direction it takes in next few weeks.
Anant Raj: Triple Bottom Reversal Pattern, Trendline BO.NSE:ANANTRAJ Made a Beautiful Chart Structure of a Triple Bottom reversal pattern, Sort of Inverse H&S confirmation and Trendline BO. Post Excellent Q4 Results, with Good Price and Volume action.
Price Action:
- It experienced a sharp decline in January 2025, falling from ₹950 to the ₹550 level.
- Further correction took it to lows near ₹420 in March-May 2025
- Currently showing signs of recovery at ₹514.10, up ₹40.50 (+8.55%) in today's session.
- Breaking above the descending trendline (white diagonal).
- Multiple tests of the ₹420-430 support zone created a solid base
Volume Analysis:
- Today's volume at 7.79M shares vs. average of 2.93M (over 2.5x normal volume)
- Previous support bounces (green arrows) also saw increased volume
- Strong volume accompanying the breakout indicates conviction behind the move
- Volume expansion during upward movements signals the accumulation phase
Key Support and Resistance:
- Strong support established at ₹420-430 zone (green horizontal line)
- Intermediate resistance at ₹550 level (lower red horizontal line)
- Major resistance at ₹630-640 zone (upper red horizontal line)
- Multiple rejection points at these resistance levels (red arrows)
- Historical resistance at ₹935-950 from December-January (top red line)
Technical Patterns:
1. Triple Bottom- Formed at ₹420-430 level (March, April, May - green arrows)
2. Descending Trendline Breakout- Price breaking above the multi-month downtrend line
3. Somewhat Inverse Head & Shoulders- Potentially forming with:
- Left shoulder (February-March)
- Head (April)
- Right shoulder (May)
- Neckline around ₹520-530
4. Sort of Range Breakout- Escaping from the ₹420-500 trading range
Trade Setup:
- Pattern: Trendline breakout + potential inverse H&S completion
- Confirmation: Strong price action above ₹500 with volume expansion
- Context: Reversal setup after extended downtrend and base formation
Entry Points:
1. Aggressive Entry: Current price (₹514.10) with partial position
2. Pullback Entry: On retest of breakout level ₹490-500
3. Confirmation Entry: On close above ₹550 (previous resistance level)
Exit Strategy
- Target 1: ₹550 (immediate resistance)
- Target 2: ₹630-640 (major resistance zone)
- Target 3: ₹750 (intermediate target based on pattern projection)
- Ultimate Target: ₹935-950 (previous ATH high)
- Trailing Stop: Implement a 5% trailing stop after Target 1 is achieved
Stop Loss Placement:
- Aggressive Stop: ₹480 (below recent swing low)
- Conservative Stop: ₹450 (midpoint of recent range)
- Pattern-Based Stop: ₹420 (below the triple bottom support)
Risk Management:
- Position sizing: Limit risk to 1-2% of trading capital
- Risk-reward ratio: Minimum 1:1.5 (with aggressive stop)
- Consider the pyramiding approach: add to the position as each resistance level is cleared
- Scale out: 30% at Target 1, 30% at Target 2, hold remainder with trailing stop
The stock shows a compelling technical setup with its triple bottom pattern, trendline breakout, and high-volume surge. The inverse head and shoulders pattern, if completed with a move above ₹550, would further confirm the reversal thesis. Multiple tests of support with increasing volume on the recovery suggest institutional interest is building in the stock.
Keep in the Watchlist.
NO RECO. For Buy/Sell.
📌Thank you for exploring my idea! I hope you found it valuable.
🙏FOLLOW for more
👍BOOST if you found it useful.
✍️COMMENT below with your views.
Meanwhile, check out my other stock ideas on the right side until this trade is activated. I would love your feedback.
Disclaimer: "I am not SEBI REGISTERED RESEARCH ANALYST AND INVESTMENT ADVISER."
This analysis is intended solely for informational and educational purposes and should not be interpreted as financial advice. It is advisable to consult a qualified financial advisor or conduct thorough research before making investment decisions.

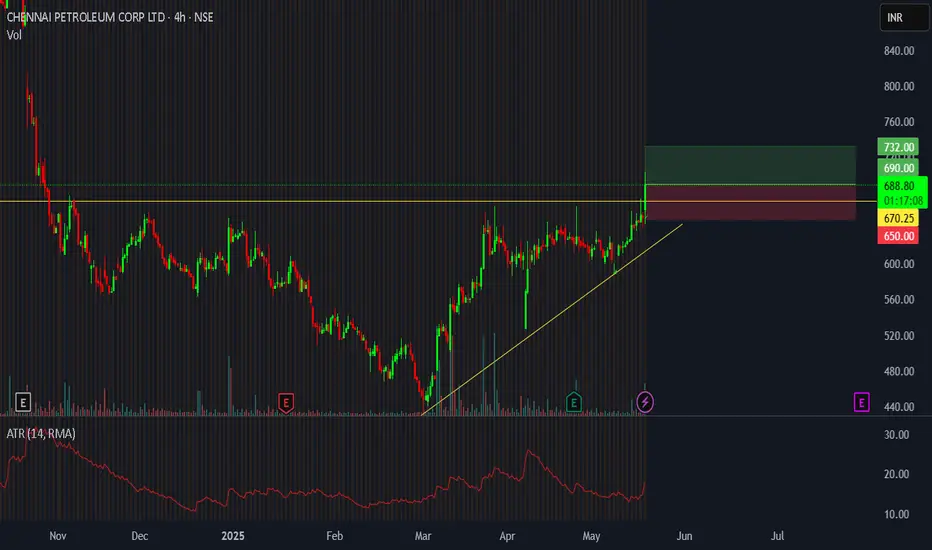
Chennai Petro Short Term TradeLevel of 670 has been a strong resistance since more than six months,
A head and shoulder pattern is visible, and the neckline coincides with this 670 level,
In the last three months, there are visible higher lows , forming a triangle like pattern,
Currently, there is a probable breakout, conformed with high volume, rise in atr, and overall bullish strength
Thus, there is a short term trade,
tgt 732, sl 650