Hidden Signal Professional Traders Use to Spot ReversalsRSI divergence is a technical analysis tool used to identify potential reversals or weakening momentum in price trends.
Here's how it works:
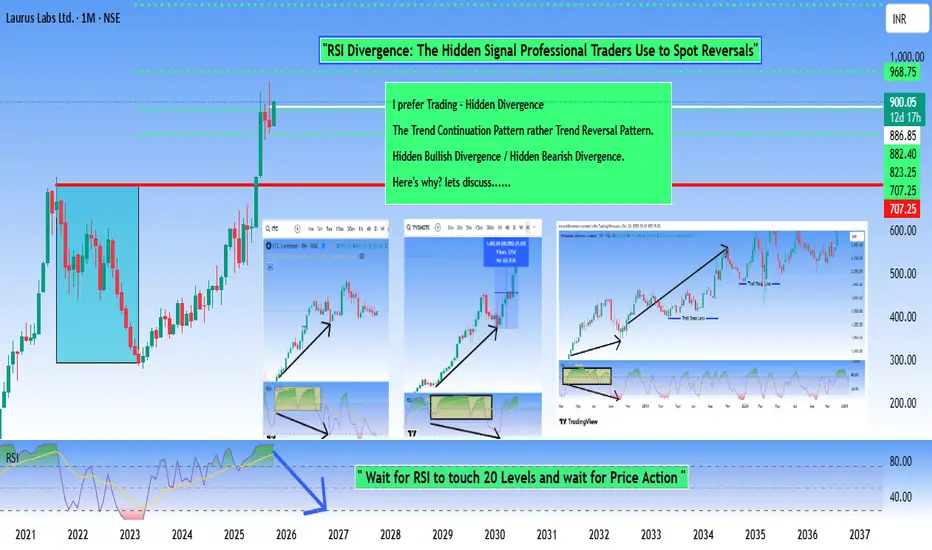
RSI (Relative Strength Index) Divergence occurs when the price of an asset moves in one direction while the RSI indicator moves in the opposite direction.
This disconnect between Price action and Momentum is what traders find significant.
Bullish / Bearish Divergence - This Divergence occurs at the end of a trend, be it Bullish or Bearish Trend.
RSI Hidden Divergence is a more subtle and advanced form of divergence that occurs within trending markets. It's different from regular divergence because it suggests the trend will continue rather than reverse.
Why It's Called "Hidden" ?
Regular divergence is more "obvious" because Price and RSI move in completely opposite directions . Hidden divergence is subtler— It appears within the flow of an existing trend and is easy to miss, hence the name.
Reasons to Prefer Hidden Divergence Rather then Classic Divergence !!!
When we follow Classic Divergence, the possible results are....
False Signals
The biggest issue is that divergences frequently fail to produce reversals. A price may form a lower low while RSI forms a higher low, suggesting a reversal is coming, but the price continues in the original direction anyway. This can lead traders into losing trades if they act on divergence signals prematurely.
Lagging Nature
RSI divergence is a lagging indicator—by the time you spot it clearly, a significant portion of the move may already be complete. You're often trading what's already happened rather than predicting what's about to happen. The reversal might be weeks away, making it difficult for short-term traders.
Subjectivity in Identification
Identifying divergence requires drawing trend lines and choosing which highs and lows to compare. Different traders might draw these lines differently, leading to inconsistent identification of the same divergence. This subjectivity makes it harder to create reliable, mechanical trading rules.
Hiddendivergence
Zomato is showing weakness it may test 170 soon.Zomato is weak on monthly and weakly chart. It forms Fake breakout with double top pattern on monthly chart.
As per chart showing weakness on daily chart also as RSI drag below 40. It can short on any rise or here for target 170 soon.
ZShort

CPRX Long TradeFirst time trading this strategy on Stocks. Price recently reached the bottom of a Channel. I spotted a possible Hidden Divergence on the MACD. Price also recently rejected off the LuxAlgo False Breakout Zone (Highlighted Blue). 3 signs of a possible reversal, Momentum is also headed upward on the MACD. Stop Loss is set at 13.10. I plan on holding this until it reaches the top of the channel.

EUR/AUD SHORT I waited patiently for Price to Reach the Top of the Trend Line Channel. Once it reached the top i realized the Highs on the MACD were higher than the Last Swing High (Hidden Divergence). Momentum started pushing towards the Down Side. I placed a Sell Stop at 1.65074 and set the Stop Loss at the bottom of the last Demand Zone.

Divergence Cheat Sheet / Types of DivergenceWhat is divergence?
Divergence is a method used in technical analysis when the direction of a technical indicator, usually some form of oscillator ‘diverges’ from the overall price trend. In other words, the indicator starts moving in the opposite direction to the price and the trading oscillator signals a possible trend reversal.
Once divergence appears, there is a higher chance of a reversal, especially if divergence appears on a higher time frame.
Oscillator indicator for divergence patterns is Weis Wave Volume, macd, the RSI, CCI, or stochastic OBV.
Types of divergences
There are 4 types of divergence, which are broadly classified into two categories:
1) Regular or Classic Divergence
2) Hidden Divergence
With each of these two categories, you have a bullish or a bearish divergence. Therefore, the four types of divergences are summarized as:
1) Regular Bullish Divergence
2) Regular Bearish Divergence
3) Hidden Bullish Divergence
4) Hidden Bearish Divergence
Divergence patterns indicate that a reversal is coming soon and becoming more likely but this is not an instant change. The more divergence there is visible, the more likely a reversal does become. Here are some guidelines:
The entry can not be taken on the basis of divergence indicator alone.
It’s best if a trader mixes the divergence indicator pattern with their strategy.
Use Higher time Frames.

HDFC- Cracks from The Top of 2507/ Hidden Divergence (Y-Wave)Hidden Bearish Divergence
This occurs when price makes a lower high (LH), but the oscillator is making a higher high (HH).
When you see hidden bearish divergence, chances are that the pair will continue to shoot lower and continue the downtrend.
What we expect next?
As suggested earlier on 17th Aug 2022 video idea that the correction could be deep towards 2000 levels & has to be reviewed at certain intervals as markets are too volatile.
The last related idea can be checked below
Thank you
Related Idea for HDFC
Bank Nifty - Will if follow in the footseps of HDFC?
HShort

ASTERDM case studyAster dm spot cmp 193
inverted head and should pattern breakout and retest
hidden bullish divergence on rsi
falling trendline breakout in rsi
major elliotwave impulse wave in formation
let see whats in store,, have mentioned roadmad will keep tracking

TCS - Wedge formation + Hidden bullish divergenceTCS - Wedge formation + Hidden bullish divergence
StopLoss below trendline 1 as shown in the chart
Target on trendline 2 as shown in the chart

SAIL - Pennant pattern breakout + Hidden Bullish DivergenceSteel Authority of India Limited - Pennant pattern breakout + Hidden Bullish Divergence
Stoploss below the upper trendline
Target 1 @ 152, which is a key level
Target 2 @ 170, which is a key level
Target 3 @ 190, which is the price projection
Target 4 @ 205 which is a key level
Note: It has made a breakout last day and the price came back to the trendline resulting in a retrace, Trade based on tomorrow's price action.

#TATACOFFEE .. 10-20% move is coming .. 2.43R Check the chart...strong price consolidation and hidden bullish divergence... RR on the trade is 2.43
TLong

Crypto Marketcap bounce nicely from support, what next?Technical Analysis: Total MarketCap (Update)
In Daily timeframe Chart, Crypto Total Market Cap is Moving Above the Strong Support (1.32T) and did not want go further down
If Crucial Support Broken Down then Next STOP Could be 832bln (So We Could see Crash in Coming Days)
In Bullish Case, If MarketCap Remains Above the Support, Expecting Bounce Back towards the 1.72( 50 DMA)
RSI made bullish hidden divergence and slowly slowly increasing thats means bull seams strong now, it could probably break daily down
trend which is minor resistance as well as 21 DMA (1.50 T).
❤️ If you find this helpful and want more FREE forecasts in Tradingview.
. . . . . Please show your support back,
. . . . . . . . Hit the 👍 LIKE button,
. . . . . . . . . . Drop some feedback below in the comment!
❤️ Your Support is very much 🙏 appreciated!❤️
💎 Want me to help you become a better Crypto trader?
Now, It's your turn!
Be sure to leave a comment; let me know how you see this opportunity and forecast.
Trade well, ❤️
#totalmarketcap #crypto #nextmove #bullmarket #sideways #bitcoin

RELIANCE | Small swing opportunity - RSI making Lower highRELIANCE | Small swing opportunity - RSI making Lower high - Shall we can consider it as hidden divergence.
CMP : 1976
SL : 1940
Target : 2120
Simple 1:3 risk reward setup

Hidden RSI Divergence in AMARAJABAT for Target of 877+We can see the price making a higher low, whereas at the same time the RSI is making a lower low. This is a bullish continuation pattern where the divergence indicates the end of a temporary retracement in an overall uptrend. This could be a great moment to buy AMARAJABAT for an immediate target of 852 and next to 877+.
Possible Trade:
Buy AMARAJABAT above 835
Stop loss - 825
Target 852 877+
ALong

Hidden bullish divergence: Positional Buy Apollo Tyres @ 129.453-Bar pattern & Hidden bullish divergence
Positional Buy @ 129.50, Target - 144 & above, SL - 114.5
Hidden divergence are strong patterns in direction of trend. Apollo Tyres had formed 3-Bar bullish pattern & hidden bullish divergence on daily charts.

Exide - Hidden Divergence + Hanging ManHidden Divergences indicate the uptrend in price should continue.
The price action candle pattern supports the hypothesis.
So unless, its a super Bearish Market tomorrow, it should be a good trade!
Go Long above 154.5 for 156, 157, 160 (if it sustains above 157.3 - 50 DMA) with SL at 153

HINDUNILVR - Morning Star + Hidden divergenceGo long above 2236 for 2260, 2280, 2300, 2320 & 2350 with SL at 2220

SBI - Price Action + Hidden Bearish DivergenceSBI is in a doji zone right now.
The Price Action levels have been marked on chart.
The stock is bullish above 188 for targets of 194, 197 and beyond.
The stock is bearish below 184 for falling to the levels of 178 if not beyond.
The 184 - 188 region is open for scalping.
There is a hidden bearish divergence as can be seen on the graph.
A lot will also depend on how BANK NIFTY behaves which broke a support of 21950 levels.
Keep an eye out for BANK NIFTY levels on Monday. There are several posts on BANK Nifty S&R for reference.
I have been bullish on SBI for 200 levels.
However the divergence has me re-thinking the position.
In case of gap-up opening on Monday: Short for 184 and watch the movement after that.
In case of gap-down: Follow ORB on 15 min candle

Auropharma hidden bearish divergence and stochastic overbouhtAuropharma formed clear hidden bearish divergence which indicates continuation of downfall to its support and stochastic also overbought zone, acts as add on confirmation.


Start of the next IMPULSE!!!!Hello everyone,
I've been looking for short move since 2nd week of the September. As shown in chart price is showing sell sign by divergence On RSI and MACD both.
When price move forward in our forecasting direction then Move SL past the entry. If it's not the move down then we again look for the sell opportunities.

ONGC - Rounding Bottom, Flag, Hidden DivergenceONGC has formed a rounding bottom with a flag.
Notice the hidden divergence.
Seems to be a good medium term buy.
