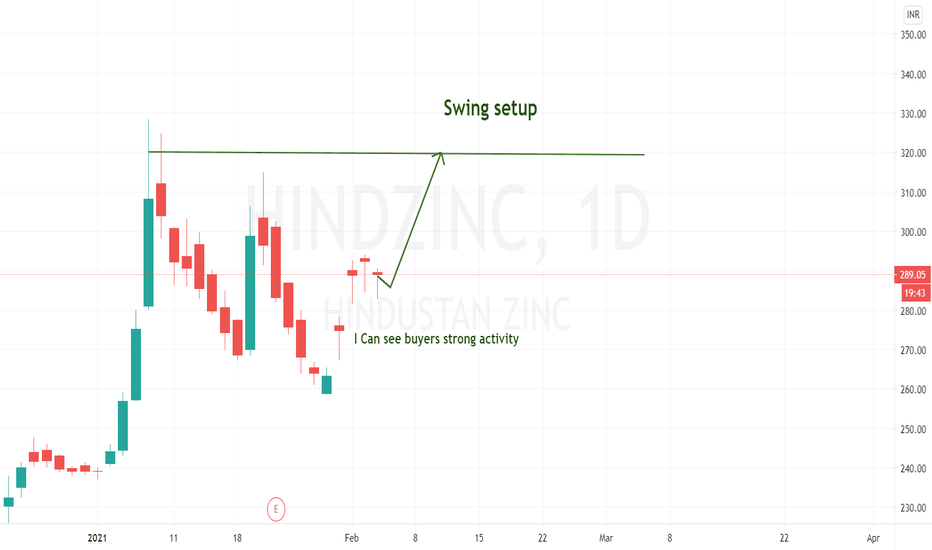
Hindzincbullish
HIND ZINC 🐥🐥Tested crucial level.
Will take a good move from here.
Take trade as per the values given in Fibonacci. always trail the stop loss. do your own analysis before taking trade
Check these Upcoming ideas - STILL ACTIVE
Check these successful trades & approach on HUL , BAJAJ FINSV , DABUR , TATACHEM , VOLTAS, BAJAJ AUTO , WIPRO , DR REDDY , CUMMINS , HDFC , M&M
If you like my analysis do like & follow me as a token of appreciation. If you have any queries on any stock let me know.
Leave a comment that is helpful or encouraging. Let's master the markets together
Hindustan ZincHIND ZINC (NSE CASH)
CHART ANALYSIS
LTP: 309.85
SUPPORT: 305.25 (309.01 ACCORDING TO 20 DEMA)
RESISTANCE: 321.90 / 329.30
RISK TO REWARD RATIO IS APT
RSI IN DAILY CHART IS IN A STRONG UPTREND AND IS ABOVE THE 50 MARK IN OTHER PERIODICALS
329.30 LOOKS LIKE A BREAKOUT LEVEL WHICH MEANS THAT THE CHARTS WILL MAKE NEW HIGH ONCE IT CROSSES AND TRADES ABOVE 330
CHART IS IN AN UPTREND (15M) SINCE 6th MAY AND LOOKS LIKE THE UPTREND WILL CONTINUE
OI NA AS THIS SCRIPT IS NOT PRESENT IN NFO
MARKET CAP: 1.253T (ABOVE 200B / VERY GOOD)
VOL: 7.838M (ABOVE 500K / VERY GOOD)
REL VOL: 2.16 (ABOVE 2 / VERY GOOD)
AVG VOL: 2.153M (ABOVE 100K / VERY GOOD)
FLOAT: 222.945M (BELOW 2B / VERY GOOD)
***BUY FOR MEDIUM TERM TARGETS OF 329+ AND CAN ALSO BE A LONG TERM PART OF YOUR PORTFOLIO
Hindustan ZincHindustan Zinc
Market cap: 1.267T
Vol: 5.347M
Rel vol: 2.90
Avg vol: 1.866M
Float: 222.945M
LTP: 317
Support: 313.10
Resistance: 323.50 / 334.40
Daily charts (long term)
the candles are following the higher top and higher bottom bull pattern.
20 and 100 DEMA look good.
Volume looks good.
MACD has crossed over and has entered the bull zone.
RSI is in an uptrend above 50 mark.
***Investors can add Hind Zinc to their portfolios and accumulate at lower levels.
Hourly charts (medium term)
The first impression is that RSI is very close to the overbought level.
MACD has reduced volumes.
The runaway candle has all the magic. We will watch for a confirmation candle and enter for a short term trade.
***334.40 is a breakout level. We can expect a rally above it.
15m charts (short term)
As indicated in the hourly chart, RSI is correcting itself.
MACD looks strong.
20 and 100 DEMA look fine.
The chart is on a clear uptrend.
***buy on dips for short term targets of 335+


