Part9 Trading Master Class Why Traders Use Options
Options aren’t just for speculation — they have multiple uses:
Speculation – Betting on price moves.
Hedging – Protecting an existing investment from loss.
Income Generation – Selling options for premium income.
Risk Management – Limiting losses through defined-risk trades.
Basic Options Strategies (Beginner Level)
Buying Calls
When to Use: You expect the price to go up.
How It Works: You buy a call option to lock in a lower purchase price.
Risk: Limited to the premium paid.
Reward: Unlimited upside.
Example: Stock at ₹100, buy a call at ₹105 strike for ₹3 premium. If stock rises to ₹120, your profit = ₹12 – ₹3 = ₹9 per share.
ICICIBANK

Psychology & Risk Management in Trading 1. Introduction
Trading is often thought of as a purely numbers-driven game — charts, technical indicators, fundamental analysis, and economic data. But in reality, the true battlefield is inside your head. Two traders can have access to the exact same market data, yet end up with completely different results. The difference lies in psychology and risk management.
Psychology determines how you make decisions under pressure.
Risk management determines whether you survive long enough to benefit from good decisions.
Think of trading as a three-legged stool:
Strategy – Your technical/fundamental system for entering and exiting trades.
Psychology – Your ability to stick to the plan under real conditions.
Risk Management – Your safeguard against catastrophic loss.
If one leg is missing, the stool collapses. A profitable strategy without psychological discipline becomes useless. A strong mindset without proper risk controls eventually faces ruin. And perfect risk management without skill or discipline simply results in slow losses.
Our goal here is to align mindset with money management for long-term success.
2. Understanding Trading Psychology
2.1. Why Psychology Matters More Than You Think
When you’re trading, money is not just numbers — it represents:
Security (fear of losing it)
Freedom (desire to win more)
Ego (feeling smart or dumb based on market outcomes)
This emotional attachment creates mental biases that cloud judgment. Unlike a chessboard, the market is an uncertain game — the same move can lead to a win or loss depending on external forces beyond your control.
The primary enemy is not “the market,” but you:
Closing winning trades too early out of fear.
Holding onto losing trades hoping they’ll recover.
Overtrading to “make back” losses.
Avoiding valid setups after a losing streak.
2.2. The Main Psychological Biases in Trading
1. Loss Aversion
Humans hate losing more than they like winning. Research shows losing $100 feels twice as bad as gaining $100 feels good.
In trading, this causes:
Refusing to take stop losses.
Adding to losing positions to “average down.”
2. Overconfidence Bias
After a streak of wins, traders often overestimate their skill.
Example: Turning a $1,000 account into $2,000 in a week might lead to doubling trade size without a valid reason.
3. Confirmation Bias
Seeking only information that supports your existing view. If you’re bullish on gold, you might only read bullish news and ignore bearish signals.
4. Recency Bias
Giving too much weight to recent events. A trader who just experienced a big rally might expect it to continue, ignoring long-term resistance levels.
5. Fear of Missing Out (FOMO)
Jumping into trades without proper analysis because you see the market moving.
6. Revenge Trading
Trying to “get back” at the market after a loss by taking impulsive trades.
2.3. Emotional States and Their Effects
Fear – Leads to hesitation, missed opportunities, and premature exits.
Greed – Leads to over-leveraging and chasing setups.
Hope – Keeps traders in losing trades far longer than necessary.
Regret – Causes paralysis, stopping you from entering new opportunities.
Euphoria – False sense of invincibility, leading to reckless trades.
3. Mastering the Trader’s Mindset
3.1. Accepting Uncertainty
Markets are probabilistic, not certain. The best trade setups still lose sometimes. The key is to think in terms of probabilities, not certainties.
Mental shift:
Bad trade ≠ losing trade.
Good trade ≠ winning trade.
A “good trade” is one where you followed your plan and managed risk — regardless of the outcome.
3.2. Developing Discipline
Discipline means doing what your trading plan says every time, even when you feel like doing otherwise.
Practical ways to build discipline:
Pre-market checklist (entry/exit rules, risk per trade, market conditions).
Post-trade review to identify emotional decisions.
Simulated trading to practice following rules without monetary pressure.
3.3. Managing Emotional Cycles
Traders often go through repeated emotional phases:
Excitement – New strategy, first wins.
Euphoria – Overconfidence and overtrading.
Fear/Panic – Sharp drawdown after reckless trades.
Desperation – Trying to recover losses quickly.
Resignation – Stepping back, reevaluating.
Rebuilding – Adopting better discipline.
Your goal is to flatten the cycle, reducing extreme highs and lows.
4. Risk Management: The Survival Mechanism
4.1. The Goal of Risk Management
Trading is not about avoiding losses — losses are inevitable. The aim is to control the size of your losses so they don’t destroy your capital or confidence.
4.2. The Three Pillars of Risk Management
1. Position Sizing
Determine how much capital to risk per trade. Common rules:
Risk only 1–2% of total capital on any single trade.
Example: If you have ₹1,00,000 and risk 1% per trade, your max loss is ₹1,000.
2. Stop Losses
Predetermined exit points to limit losses.
Hard stops – Fixed at a price level.
Trailing stops – Move with the trade to lock in profits.
3. Risk-Reward Ratio
A measure of potential reward vs. risk.
Example:
Risk: ₹500
Potential Reward: ₹1,500
R:R = 1:3 (good)
4.3. The Power of Capital Preservation
Here’s why big losses are dangerous:
Lose 10% → Need 11% gain to recover.
Lose 50% → Need 100% gain to recover.
The bigger the loss, the harder the comeback. Capital preservation should be your #1 priority.
4.4. Avoiding Overleveraging
Leverage magnifies both gains and losses. Many traders blow accounts not because their strategy was bad, but because they used excessive leverage.
5. Integrating Psychology with Risk Management
5.1. The Feedback Loop
Poor psychology → Poor risk decisions → Bigger losses → Worse psychology.
You must break the loop by locking in good risk rules before trading.
5.2. The Risk Management Mindset
Treat each trade as just one of thousands you’ll make.
Focus on execution quality, not daily P/L.
Celebrate following your plan, not just winning.
5.3. Journaling
A trading journal should include:
Entry/exit points and reasons.
Risk per trade.
Emotional state before/during/after.
Lessons learned.
Over time, patterns emerge that reveal weaknesses in both mindset and risk control.
6. Practical Tips for Building Psychological Strength
Meditation & Mindfulness – Keeps emotions in check.
Physical Health – A healthy body supports a calm mind.
Sleep – Fatigue increases impulsive decisions.
Routine – Structured trading hours reduce stress.
Detach from P/L – Judge performance over months, not days.
7. Case Studies: When Psychology Meets Risk
Case Study 1 – The Overconfident Scalper
Wins 10 trades in a row, doubles position size.
One loss wipes out previous gains.
Lesson: Stick to fixed risk % per trade regardless of winning streaks.
Case Study 2 – The Hopeful Investor
Holds losing position for months.
Avoids taking stop loss because “it’ll recover.”
Lesson: Hope is not a strategy; use predefined exits.
8. Conclusion
Trading success is 20% strategy and 80% mindset + risk control. The market will always test your patience, discipline, and emotional control. By mastering your psychology and implementing rock-solid risk management, you give yourself the best chance not just to make money — but to stay in the game long enough to grow it.

SME & IPO Trading Opportunities 1. Introduction
The stock market is a living, breathing organism — constantly evolving with trends, cycles, and opportunities. Two of the most exciting and profitable niches for traders and investors are Initial Public Offerings (IPOs) and Small & Medium Enterprise (SME) IPOs.
These areas often combine market hype, information asymmetry, liquidity surges, and price volatility — all of which can create significant profit opportunities for those who understand how to navigate them.
While IPOs of large companies grab headlines, SME IPOs are quietly becoming one of the fastest-growing segments in markets like India, offering massive potential for early movers. However, both IPOs and SME IPOs require sharp analysis, disciplined execution, and awareness of risks — because for every success story, there’s a cautionary tale.
2. Understanding IPOs and SME IPOs
2.1 What is an IPO?
An Initial Public Offering (IPO) is when a private company issues shares to the public for the first time to raise capital.
It’s like opening the gates for the public to invest in a business that was previously limited to private investors and founders.
Key purposes of an IPO:
Raise capital for expansion, debt repayment, or new projects.
Increase public visibility and brand credibility.
Provide an exit or partial liquidity to existing investors (VCs, PE funds, promoters).
2.2 What is an SME IPO?
An SME IPO is similar to a normal IPO, but it’s specifically for Small and Medium Enterprises — companies with smaller scale, market cap, and turnover.
They list on dedicated SME platforms such as:
NSE Emerge (National Stock Exchange)
BSE SME (Bombay Stock Exchange)
Differences from mainboard IPOs:
Feature Mainboard IPO SME IPO
Minimum Post-Issue Capital ₹10 crore ₹1 crore
Issue Size Large (hundreds/thousands of crores) Smaller (few crores to ~50 crore)
Lot Size Smaller (say ₹15,000) Larger (₹1-2 lakh minimum)
Investor Base Retail + QIB + HNI Primarily HNI + Limited Retail
Listing Main Exchange SME Platform
2.3 The Growing Popularity of SME IPOs in India
SME IPOs in India are booming because:
Huge wealth creation in the past few years (several SME IPOs have given 100%-500% returns post-listing).
Lower competition compared to mainboard IPOs.
Increasing investor participation via HNIs and informed retail investors.
Supportive regulations from SEBI for SMEs.
3. Why IPOs and SME IPOs Offer Trading Opportunities
3.1 The Hype Cycle
IPOs are heavily marketed through roadshows, advertisements, and media coverage. This creates a buzz and often leads to:
Oversubscription → Strong listing potential.
Emotional buying on Day 1 due to FOMO (Fear of Missing Out).
SME IPOs, though less advertised, also create strong niche hype within small-cap investor communities.
3.2 Information Asymmetry
Large institutional players often have detailed financial data and business insights — but in IPOs and SME IPOs, even retail investors get access to a prospectus (DRHP/RHP). Those who know how to read and interpret it can identify hidden gems before the crowd.
3.3 Volatility and Liquidity
Mainboard IPOs: Usually see high trading volumes on listing day → intraday traders love it.
SME IPOs: Lower liquidity but can see massive price jumps due to small free-float shares.
3.4 First-Mover Advantage
For fundamentally strong IPOs, getting in at the IPO price can mean riding a long-term growth story from the very beginning. Example: Infosys, TCS, Avenue Supermarts (DMart) IPO investors made multifold returns over years.
4. Types of Opportunities in IPO & SME IPO Trading
4.1 Listing Gains
Buy in IPO → Sell on listing day for profit.
Works best for oversubscribed IPOs with strong demand.
Example:
Nykaa IPO (2021) listed at ~78% premium.
Some SME IPOs list with 100%-300% premium.
4.2 Short-Term Swing Trades Post Listing
After listing, many IPOs see price discovery phases:
Some shoot up further due to momentum buying.
Others fall sharply after hype fades.
Traders can capture these 2–10 day swings.
4.3 Long-Term Investing
Identify fundamentally strong IPOs and SMEs that can grow significantly over 3–5 years.
Example: IRCTC IPO at ₹320 in 2019 → over ₹5,500 in 2021 (17x in 2 years).
4.4 SME Platform Migration
Some SME-listed companies eventually migrate to the mainboard exchange after meeting eligibility criteria — which can cause valuation re-rating and price jumps.
4.5 Pre-IPO Investments
For advanced traders/investors, investing in companies before they announce IPO plans can yield extraordinary gains when the IPO finally happens.
5. How to Identify High-Potential IPOs & SME IPOs
5.1 Key Financial Metrics
Revenue Growth Rate (Consistent >15–20%)
Profit Margins (Improving over time)
Return on Equity (ROE) (>15% is good)
Debt-to-Equity Ratio (Lower is better)
Cash Flow Consistency
5.2 Qualitative Factors
Industry growth potential.
Competitive advantage (Moat).
Strong management track record.
Promoter holding and their skin in the game.
5.3 Subscription Data
For IPOs, tracking subscription numbers daily:
High QIB (Qualified Institutional Buyer) subscription → good sign.
SME IPOs with oversubscription in HNI and retail often see strong listing.
5.4 Grey Market Premium (GMP)
The Grey Market is an unofficial market where IPO shares are traded before listing. GMP gives a rough idea of market expectations, but it’s not always reliable.
6. Risk Factors in SME & IPO Trading
6.1 Listing Day Disappointments
Not all IPOs list at a premium — some open below issue price (listing loss).
6.2 Hype vs Reality
Companies might look attractive in marketing materials but have weak fundamentals.
6.3 Low Liquidity in SME IPOs
Getting out quickly in SME IPOs can be tough — spreads can be huge.
6.4 Regulatory & Compliance Risks
SMEs sometimes face corporate governance issues or delayed disclosures.
7. Trading Strategies for IPOs & SME IPOs
7.1 For Listing Gains
Focus on IPOs with >20x oversubscription in QIB category.
Track GMP trends — consistent rise before listing is a bullish signal.
Avoid low-demand IPOs.
7.2 Post-Listing Momentum Trading
Use 5-min/15-min charts to catch intraday breakouts.
Set tight stop-loss (2–3%) due to volatility.
Volume analysis is critical.
7.3 Swing Trading SME IPOs
Wait for first 5–7 trading days after listing.
Buy on dips when price consolidates above listing price.
7.4 Long-Term Positioning
Enter strong companies post-listing dip (common after initial hype).
Monitor quarterly results for sustained growth.
7.5 Pre-IPO Placement Investing
Requires large capital and network access.
Higher risk but can yield 2x–5x returns at IPO.
8. Tools & Resources for IPO & SME IPO Trading
Stock exchange websites (NSE/BSE) for official IPO details.
SEBI filings for DRHP/RHP.
IPO subscription trackers (e.g., Chittorgarh, IPOWatch).
Financial news platforms for sentiment analysis.
Charting tools like TradingView for technical setups.
9. Case Studies
Case Study 1: Mainboard IPO Success
Avenue Supermarts (DMart)
IPO Price: ₹299 (2017)
Listing Price: ₹604 (+102%)
5-Year Return: 7x
Key Takeaway: Strong fundamentals + brand recall = multi-year wealth creation.
Case Study 2: SME IPO Multi-bagger
Essen Speciality Films (Listed on NSE Emerge)
Issue Price: ₹101 (2022)
1-Year Price: ₹400+ (4x)
Key Takeaway: Low float + strong earnings growth can lead to explosive returns.
Case Study 3: Listing Loss
Paytm
IPO Price: ₹2,150 (2021)
Listing Price: ₹1,950 (−9%)
Fell to ₹540 in 1 year.
Key Takeaway: High valuations without profitability can lead to severe post-listing crashes.
10. Future Outlook for SME & IPO Trading
Digital revolution → More SMEs tapping capital markets.
Retail investor growth → Higher demand for IPOs.
Regulatory support → Easier SME listings.
Sectoral trends like EV, renewable energy, fintech, and AI are likely to dominate IPO pipelines.
Conclusion
IPOs and SME IPOs present some of the most exciting and potentially profitable opportunities in the stock market — but they’re not for blind speculation.
Success requires:
Understanding the business and its valuation.
Reading market sentiment via subscription data, GMP, and news flow.
Executing trades with discipline (entry/exit plans).
Managing risk, especially in volatile SME IPOs.
For traders, these segments offer short bursts of high liquidity and volatility, perfect for intraday and swing plays. For long-term investors, they provide a chance to get in early on the next market leader.
In the coming years, SME IPOs are likely to become the new hotspot for aggressive wealth creation — but only for those who master the art of filtering hype from genuine opportunity.

AI-Powered Algorithmic Trading 1. Introduction: The Fusion of AI and Algorithmic Trading
Algorithmic trading (or algo trading) refers to the use of computer programs to execute trading orders based on pre-defined rules. These rules can be based on timing, price, quantity, or any mathematical model.
Traditionally, algorithms were static—they executed strategies exactly as they were coded, without adapting to market changes in real time.
AI-powered algorithmic trading is different.
It integrates machine learning (ML) and artificial intelligence (AI) into trading systems, making them dynamic, adaptive, and self-improving.
Instead of blindly following a fixed script, an AI algorithm can:
Learn from historical market data
Identify evolving patterns
Adjust strategies based on changing conditions
Predict potential price movements
Manage risk dynamically
The result?
Trading systems that behave more like experienced human traders—except they operate at lightning speed and can process massive datasets in real time.
2. Why AI is Revolutionizing Algorithmic Trading
Before AI, algorithmic trading was powerful but rigid. If market conditions changed drastically—say, during a financial crisis or a geopolitical shock—the system might fail, simply because it was designed for "normal" conditions.
AI changes that by:
Pattern recognition: Detecting non-obvious market correlations.
Natural language processing (NLP): Interpreting news, earnings reports, and even social media sentiment in real-time.
Reinforcement learning: Learning from past trades and improving performance over time.
Adaptability: Shifting strategies instantly when volatility spikes or liquidity dries up.
In essence, AI empowers trading algorithms to think, not just follow orders.
3. Core Components of AI-Powered Algorithmic Trading Systems
To understand how these systems work, let’s break down the core building blocks:
3.1 Data Collection and Preprocessing
AI thrives on data—without quality data, even the most advanced AI model will fail.
Sources include:
Historical price data (open, high, low, close, volume)
Order book data (bid/ask depth)
News headlines & articles
Social media (Twitter, Reddit, StockTwits sentiment)
Macroeconomic indicators (interest rates, GDP growth, inflation)
Alternative data (satellite images, credit card transactions, shipping data)
Data preprocessing involves:
Cleaning: Removing errors or irrelevant information
Normalization: Scaling data for AI models
Feature engineering: Creating meaningful variables from raw data (e.g., moving averages, RSI, volatility)
3.2 Machine Learning Models
The heart of AI trading lies in ML models. Some popular ones include:
Supervised learning: Models like linear regression, random forests, or neural networks that predict future prices based on labeled historical data.
Unsupervised learning: Clustering methods to find patterns in unlabeled data (e.g., grouping similar trading days).
Reinforcement learning (RL): The AI learns optimal strategies through trial and error, receiving rewards for profitable trades.
Deep learning: Advanced neural networks (CNNs, LSTMs, Transformers) to handle complex time-series data and sentiment analysis.
3.3 Trading Strategy Generation
AI models help generate or refine strategies such as:
Trend-following (moving average crossovers)
Mean reversion (buying dips, selling rallies)
Statistical arbitrage (pairs trading, cointegration strategies)
Market making (providing liquidity and profiting from the bid-ask spread)
Event-driven (earnings surprises, mergers, economic announcements)
AI adds a twist—it can:
Adjust parameters dynamically
Identify optimal holding periods
Combine multiple strategies for diversification
3.4 Execution Algorithms
Once a trading signal is generated, execution algorithms ensure it’s carried out efficiently:
VWAP (Volume-Weighted Average Price) – Executes to match market volume patterns
TWAP (Time-Weighted Average Price) – Executes evenly over time
Implementation Shortfall – Balances execution cost vs. risk
Sniper/Stealth Orders – Hide large orders to avoid moving the market
AI improves execution by:
Predicting short-term order book dynamics
Avoiding periods of low liquidity
Detecting spoofing or manipulation
3.5 Risk Management
Risk is the biggest enemy in trading. AI systems incorporate:
Dynamic position sizing – Adjusting trade size based on volatility
Stop-loss adaptation – Moving stops based on changing conditions
Portfolio optimization – Balancing risk across multiple assets
Stress testing – Simulating extreme scenarios
AI models can predict drawdowns before they happen and adjust exposure accordingly.
4. Advantages of AI-Powered Algorithmic Trading
Speed: Executes trades in milliseconds.
Scalability: Can trade hundreds of assets simultaneously.
Objectivity: Removes human emotions like fear and greed.
Complex analysis: Processes terabytes of data that humans cannot.
Adaptability: Learns and evolves in real-time.
5. Challenges and Risks
AI isn’t a magic bullet—it comes with challenges:
Overfitting: AI may perform well on historical data but fail in real markets.
Black box problem: Deep learning models can be hard to interpret.
Data quality risk: Garbage in = garbage out.
Market regime shifts: AI models may fail in unprecedented situations.
Regulatory concerns: AI-driven trading must comply with strict financial regulations.
6. AI in Action – Real-World Use Cases
6.1 Hedge Funds
Firms like Renaissance Technologies and Two Sigma leverage AI for predictive modeling, order execution, and portfolio optimization.
6.2 High-Frequency Trading (HFT)
Firms deploy AI to detect microsecond price inefficiencies and exploit them before competitors.
6.3 Retail Trading Platforms
AI bots now help retail traders (e.g., Trade Ideas, TrendSpider) identify high-probability setups.
6.4 Sentiment-Driven Trading
AI scans Twitter, news feeds, and even Reddit forums to detect shifts in sentiment and trade accordingly.
7. Future Trends in AI-Powered Algorithmic Trading
Explainable AI (XAI): Making AI decisions transparent for regulators and traders.
Quantum computing integration: For lightning-fast optimization.
AI + Blockchain: Decentralized trading strategies and data verification.
Autonomous trading ecosystems: Fully self-managing portfolios with zero human intervention.
Cross-market intelligence: AI detecting correlations between equities, forex, commodities, and crypto in real-time.
8. Building Your Own AI-Powered Trading System – Step-by-Step
For traders who want to experiment:
Data sourcing: Choose reliable APIs (e.g., Alpha Vantage, Polygon.io, Quandl).
Choose a framework: Python (TensorFlow, PyTorch, scikit-learn) or R.
Feature engineering: Create technical and sentiment-based indicators.
Model training: Use supervised learning for prediction or reinforcement learning for strategy optimization.
Backtesting: Test strategies on historical data with realistic transaction costs.
Paper trading: Simulate live markets without risking real money.
Live deployment: Start with small capital and scale gradually.
Continuous learning: Update models with new data frequently.
9. Ethical & Regulatory Considerations
AI can cause market disruptions if misused:
Flash crashes: Rapid, AI-triggered selling can collapse prices.
Market manipulation: AI could unintentionally engage in manipulative patterns.
Bias in models: If training data is biased, trading decisions could be skewed.
Regulatory oversight: Authorities like SEBI (India), SEC (USA), and ESMA (Europe) monitor algorithmic trading closely.
10. Final Thoughts
AI-powered algorithmic trading is not just a technological leap—it’s a paradigm shift in how markets operate.
The combination of speed, intelligence, and adaptability makes AI an indispensable tool for modern traders and institutions.
However, successful deployment requires:
Robust data pipelines
Sound risk management
Ongoing monitoring and adaptation
In the right hands, AI can be a consistent alpha generator. In the wrong hands, it can be a high-speed path to losses.
The future will likely see more human-AI collaboration, where AI handles data-driven decisions and humans provide oversight, creativity, and strategic vision.

Part9 Trading MasterclassRisk Management in Strategies
Never sell naked calls unless fully hedged.
Position size to avoid overexposure.
Use stop-loss or delta hedging.
Monitor implied volatility — don’t sell cheap, don’t buy expensive.
Strategy Selection Framework
Market View: Bullish, Bearish, Neutral, Volatile?
Volatility Level: High IV (sell premium), Low IV (buy premium).
Capital & Risk Tolerance: Large capital allows complex spreads.
Time Frame: Short-term events vs. long-term trends.
Common Mistakes to Avoid
Trading without an exit plan.
Ignoring liquidity (wide bid-ask spreads hurt).
Selling options without understanding margin.
Overtrading during high emotions.
Not adjusting when market changes.

ICICI bank : Go long 1390-85Keep adding this bank giant with long term investment view - enter with small quantity @ 1400, 1370 holding sl 1250
We may expect it 2000, 2200 in around a year.
Accumulation strategy might workin such a big stocks.

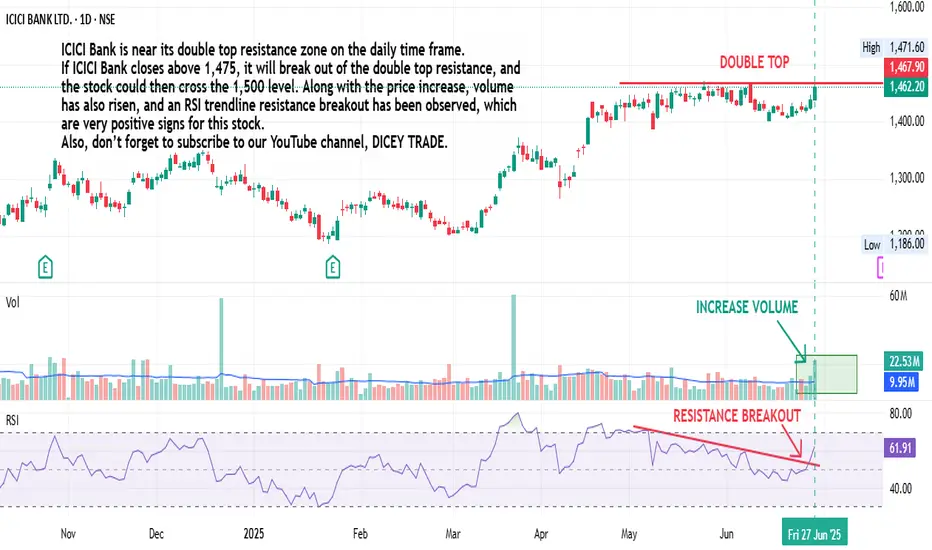
ICICI BANK Double Top Breakout: Is a Major Price Surge Ahead? ICICI Bank is near its double top resistance zone on the daily time frame. If ICICI Bank closes above 1,475, it will break out of the double top resistance, and the stock could then cross the 1,500 level. Along with the price increase, volume has also risen, and an RSI trendline resistance breakout has been observed, which are very positive signs for this stock. Also, don’t forget to subscribe to our YouTube channel, DICEY TRADE.
ICICI Bank Cup and Handle breakout DailyICICI Bank (NSE) Technical Analysis
Pattern Observed:
A Cup and Handle breakout pattern is visible.
The cup formation is well-rounded, and the handle was a shallow correction before the breakout.
Key Levels:
Breakout Zone: ₹1,364 (handle resistance breakout).
Current Price: Around ₹1,428.
Resistance Levels:
₹1,436 (recent high, minor resistance).
Major Target: ₹1,538 based on the measured move of the cup depth.
Support Levels:
₹1,364 (previous breakout zone — now support).
₹1,190 (major historical support).
Volume Confirmation:
Breakout above the handle accompanied by a good surge in volume, confirming the strength of the breakout.
Target Projection:
Height of Cup = ~173 points.
Projected Target = Breakout Point + Height
₹1,364 + 173 ≈ ₹1,538 (matches with your chart).
Strength Indicator:
Strong bullish momentum post-breakout.
Volume increasing on up-days — a healthy sign for continuation.

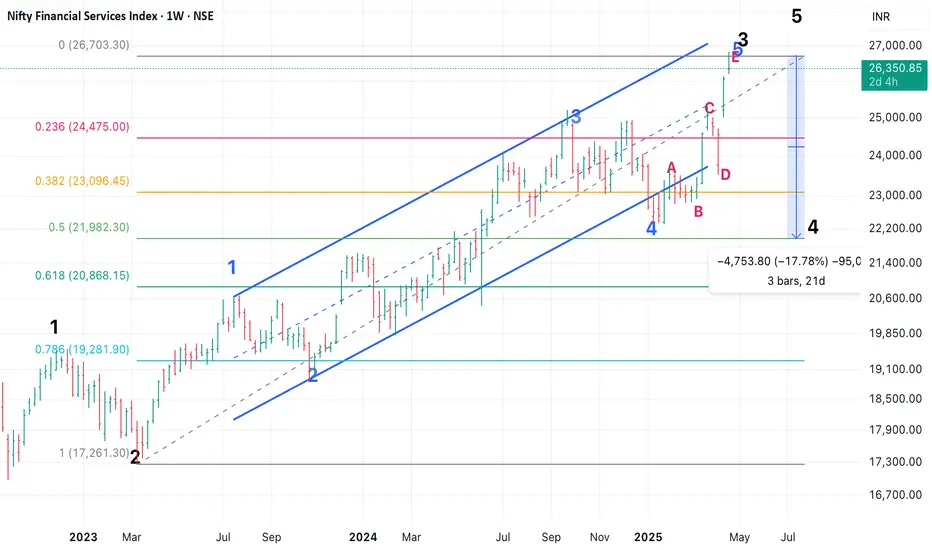
Nifty Financial Services - EW Analysis - Good RR ShortNifty Financial Services showed resilience in the entire fall and led the way up in recovery as it had a 5 of 3 up (from March 23 lows) pending, which got done in Nifty and most other indices in Dec 2023.
Now it has completed that 4 and should lead on the way down. Expecting at least a 14% correction in index till 23150 (38.2% retracement). Next target will be 22020 (50% retracement).
My bet is on 50% retracement, as Bajaj Twins and HDFC Bank and ICICI Bank have completed a corrective bounce and should test/ break recent lows.
Bajaj Twins have much larger correction possibility. Will share in other posts.
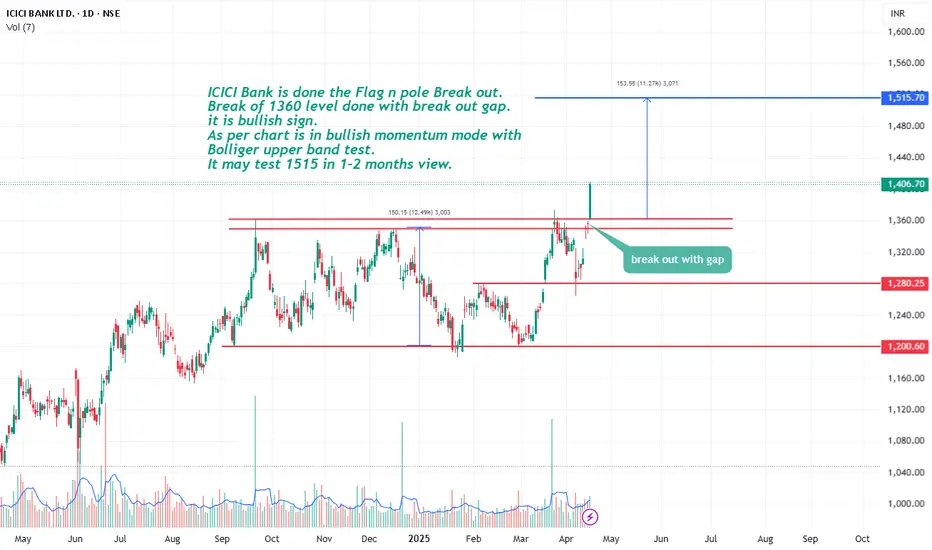
ICICI Bank on flag n pole breakout ICICI Bank is done the Flag n pole Break out. Break of 1360 level done with break out gap.
it is bullish sign. As per chart is in bullish momentum mode with Bolliger upper band test.
It may test 1515 in 1-2 months view.
ICICIBANK RANGE BREAKOUT WEEKLYICICIBank breaking a range weekly basis
with good volume building last few weeks
trading at new ATH,RSI bullish
trading above all key ema
sizzling q4 result
#niftybank trading at ATH
NEAR #target 1470
EDUCATIONAL IDEA

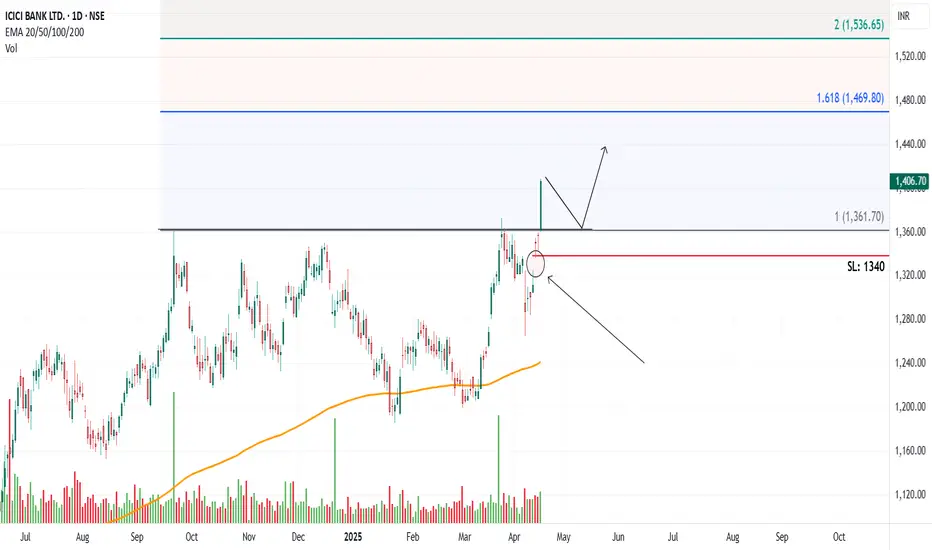
Banks in focus, chart: 3 ICICIChart -> ICICI Daily
All time high breakout with run-away gap.
CMP: 1406
Good Range to Buy: 1360 to 1400
Targets: 1470, 1536
SL: 1340 Daily Close
Disclaimer: This is for educational purposes only, not any recommendations to buy or sell. As I am not SEBI registered, please consult your financial advisor before taking any action.
ICICI Bank A New Life Time HighICICI has made a new life time high.
It's now 1406
Its target could be 1500
But who ever wants to enter the rally should wait for it to retrace till 1350 and then check the price action.
If it gives bullish view enter with SL 1300 Target 1400 and Trail till 1500
If it gives bearish view then wait till 1200
Nifty Finance Fuels Market Recovery with 5% Weekly Leap◉ Nifty Finance Sector Outlook NSE:CNXFINANCE
● The finance sector is exhibiting a bullish trend, with the Nifty Financial Services Index gaining over 5% in the past week.
● The index is currently moving within a rising parallel channel, having rebounded strongly from its trendline support.
● It is now approaching a key resistance zone, and a decisive breakout above this level could signal further upward momentum.
● For the uptrend to sustain, the index must breach and hold above this resistance.
Here’s a look at some promising stocks from the sector that could see potential upside:
◉ ICICI Bank NSE:ICICIBANK
● The stock has mirrored the index's pattern, displaying strong bullish momentum.
● It is currently trading just below its all-time high, with the potential to break through and set new records.
● Increasing trading volumes further reinforce the bullish sentiment, indicating strong buyer interest.
◉ Kotak Mahindra Bank NSE:KOTAKBANK
● After a prolonged consolidation phase, the stock has broken out of a downward-trending parallel channel.
● This breakout positions the stock for further upside movement, marking a potential shift in its trend.
◉ Bajaj Finance NSE:BAJFINANCE
● The stock has been in an extended consolidation phase, forming an Ascending Triangle pattern.
● Following a successful breakout from this pattern, the stock has shown resilience and is now poised for an upward move.

ICICI BANK: Good Area to Accumulate1. Respecting the EMAs.
2. Holding higher levels despite the overall market pressure.
3. Outperforming the major Indices
4. Following the channel since 2020.

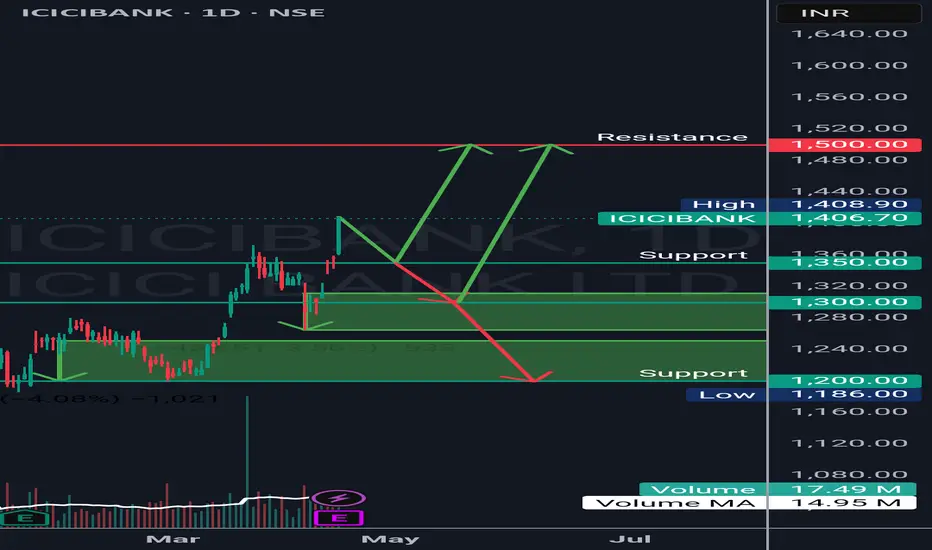
#ICICIBANKICICIBANK is possibly headed for a correction, weekly charts suggest that it has taken resistance with a kind of double top formation near the channel top with RSI divergence.
It has corrected from top and has recently done a pullback near to 50% level, from there it is again facing resistance and there is possibility that it eventually corrects upto channel bottom.
If my market profile reading is correct, then slowly it may eventually test 1180 POC
and based on #GannFan analysis it is probably facing resistance as per this chart, with a very important time Cyle of 99B & 144D from its recent ATH already completed. Such confluence of Time cycles does give some violent moves once price breaches High or Low of confluence
This post is not a buy or sell reco but just for my own records and learning purpose. Before taking any trade, do your own research and consult your Financial advisor

Selling Dominates Nifty Bank: Technical Outlook for Key Stocks◉ Nifty Bank Technical Outlook NSE:BANKNIFTY
● The index has broken below its trendline support and is currently testing its immediate support zone between 48,300 and 48,600.
● If selling pressure persists, the index may plummet another 5% to find support around the 46,000 level.
◉ Key Constituents' Technical Standings
Let's dive into the technical analysis of the top Bank Nifty constituents to gauge their current standings and potential future movements.
1. HDFC Bank (Weightage - 28.11%) NSE:HDFCBANK
● As the leading component, HDFC Bank is poised to exert downward pressure on the overall index.
● The stock has broken below its trendline support and has been falling continuously for the last 6 trading sessions.
● Support level is expected somewhere between 1,600 - 1,610 level which is around 3.4% below from the current level.
2. ICICI Bank (Weightage - 24.98%) NSE:ICICIBANK
● The stock has also fallen below its trendline support and is currently hovering just above its immediate support zone.
● If this support is breached, a significant correction could drive the price down to around 1,150.
3. Kotak Mahindra Bank (Weightage - 8.80%) NSE:KOTAKBANK
● The stock has been consolidating within a range for almost 4 years.
● Recent chart patterns suggest the price may test its support zone again, around 7.7% below the current level.
4. Axis Bank (Weightage - 8.54%) NSE:AXISBANK
● Axis Bank's chart shows a bearish pattern, similar to HDFC Bank's, and is likely to experience a fall of around 6%.
5. State Bank of India (Weightage - 8.45%) NSE:SBIN
● The stock is currently positioned just above its immediate support level, suggesting a strong potential for a rebound from this point.

ICICI bank to test Pivot Levels , Selling may Continue till 1280After two Consecutive Selling sessions , it may or may not be a bearish moment in immediate session but to test pivot levels at 1280 and may bounce back to Higher Prices ,
Forming Lower lows consecutively , but didn't step into oversold zone still as per RSI ,
the 3 month trendline and Moving averages on daily chart shows it may test the pivot levels sooner ,
FII net buyer today but still prices were lower , if trend continues the FII may become selllers too , before going up , the prices may see some correction till 1280 in near future .
May hold buying or go short for short term .

ICICIBANK Support & Resistance for the dayHere are the current support and resistance levels for ICICI Bank (as of December 2024):
Daily Levels (Intraday)
Support Levels:
S1: ₹1,320.95
S2: ₹1,312.65
S3: ₹1,303.75
Resistance Levels:
R1: ₹1,338.15
R2: ₹1,347.05
R3: ₹1,355.35
Weekly Levels
Support Levels:
S1: ₹1,301.03
S2: ₹1,273.07
S3: ₹1,250.03
Resistance Levels:
R1: ₹1,352.03
R2: ₹1,375.07
R3: ₹1,403.03

ICICI Bank is likely to stay in its channel, No breakouts!ICICI bank has had a really good year, outperforming its rivals with 31.1% Returns in last 1 year while its main competitor HDFC sits at 13.9%. ICICI Bank is already trading slightly above its 3 Year Median PE.
All this points that a breakout from ICICI's current parallel channel is very less likely, and the bank is going to continue to stay in this channel only.
The lows will be formed either at bottom line of the channel or center line. This will create technical BUY signals for this stock.

Double Rounding Bottom | HDFC BANK1️⃣ News on HDFC Bank
📍IPO Launch: ₹12,500 crore IPO for its subsidiary, HDB Financial Services
📍Profit Growth: 5.3% increase in net profit for the last quarter
📍Stock Surge: HDFC Bank shares have risen nearly 20% in three months
📍Market Position: High market cap and favorable investor sentiment
2️⃣Technical Analysis
⭕️Support around ₹1,500; important for maintaining upward momentum.
⭕️Breakout above ₹1,700 for potential buy signals.
⭕️Moving averages indicate bullish momentum.
⭕️Overbought territory suggests potential short-term corrections.
⚠️Conclusion
Strong fundamentals, including solid revenue growth The merger with HDFC Ltd. enhances its market presence, but it faces some margin pressures. Overall, it’s a good time to buy HDFC Bank stocks for long-term stability and growth, while keeping an eye on potential short-term volatility.
✅Check out my TradingView profile to see how we analyze charts and execute trades.
🙋♀️🙋♂️If you have any questions about this stock, feel free to reach out to me.
📍📌Thank you for exploring our idea! We hope you found it valuable.
🙏FLLOW for more !
👍LIKE if useful !
✍️COMMENT Below your view !

ICICI Bank cmp 1269.30 by Daily Chart viewsICICI Bank cmp 1269.30 by Daily Chart views
- Support Zone 1242 to 1257 Price band
- Support at 1231 > 1193 > 1155 with Resistance at 1299 > 1331 > ATH 1362.35
- Stock Price trailing along Rising Support Trendline with attempts to Test Retest Support Zone
- Volumes are steady and stable but need to increase for upside momentum continuity else breakdown is probable

ICICIBANK - In the ZoneLike market even ICICI bank is now appears to be stuck in the zone
With 2 strong supports on the downside as 1240 & 1265-90-10
Also 2 strong resistance on the upside as 1290 & 1310
It seems stock may not come out of this zone anytime soon
Good opportunity for strangle straddle players
An extended zone of 20 points is stop loss on the both sides
