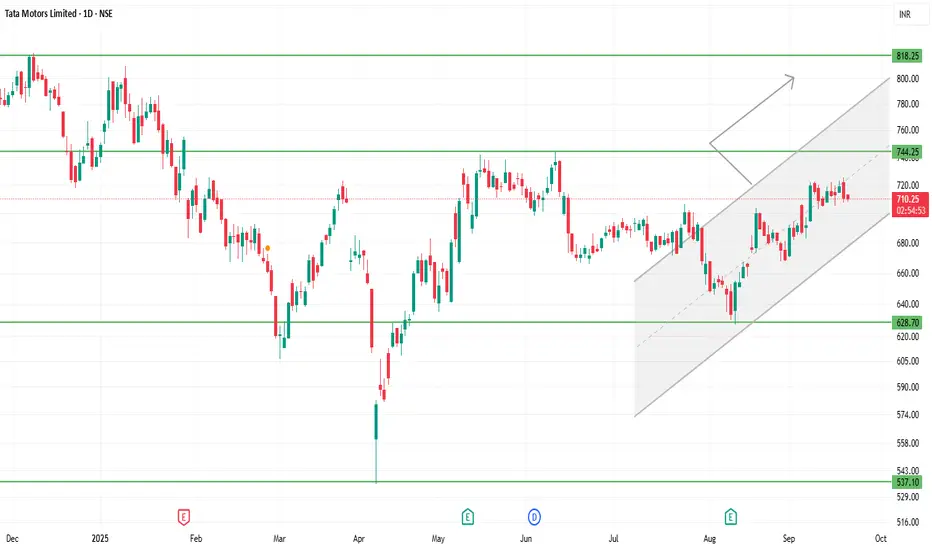
TATAMOTORS 1D Time frameTata Motors is trading around ₹710-₹720 (give or take).
The 52-week high is roughly ₹1,000+, and the 52-week low is approx ₹535-₹550.
There is visible investor concern: production halts (especially in JLR, its luxury arm) and demand pressures are weighing.
Recent performance is mixed; some short-term strength, but many indicators suggest resistance and caution.
⚙️ Technical / Trend Insights
The trend shows a mildly bullish bias in the short-term: price action is forming higher lows (e.g. holding above ₹700-705) which suggests buyers are defending downside.
Resistance zones are limiting gains: repeated attempts to push above ~₹720-725 have met selling.
Momentum indicators (RSI, MACD etc.) are positive but not deeply overbought — there’s room, but risk of pullbacks if resistance holds.
There are hints of bullish chart patterns (for example, ascending structures or potential reversal formations) if price manages to cross certain resistance levels.
⚠️ Risks / Things That Could Go Wrong
If it breaks down below ₹700-705, risk increases toward lower support in the ₹686-₹700 band.
Failure to break above ₹720-₹725 with decent volume could lead to sideways trading or minor corrections.
Macro / sectoral headwinds — demand issues, international business (JLR), cost pressures — could press down on fundamentals.
ICICIBANK
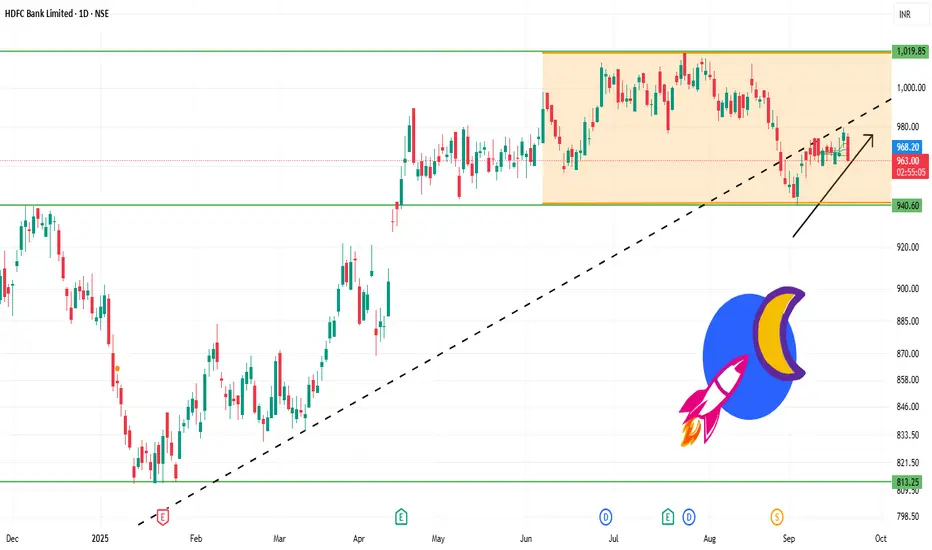
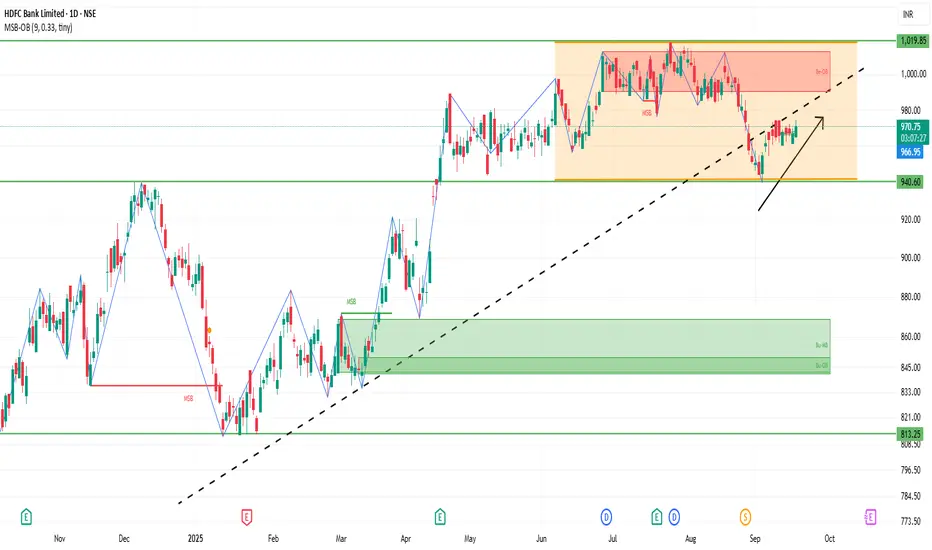
HDFCBANK 1D Time frameTrend
Trading around ₹967 – ₹970.
Stock is in a consolidation phase for the past few months.
Long-term trend is intact since it is above the 200-day moving average.
Support Levels
₹960 – ₹965 → immediate support zone.
₹945 – ₹950 → stronger support; if this breaks, stock may weaken further.
Resistance Levels
₹970 – ₹975 → immediate resistance; stock is struggling to cross this area.
₹980 – ₹992 → next major resistance; breakout above this could open path to ₹1,020.
Indicators
RSI near 55 → neutral to mildly bullish, not overbought.
MACD positive, showing some upward momentum.
Short-term moving averages are mixed, but long-term support remains strong.
Price Action
Range-bound between ₹960 – ₹975.
Breakout or breakdown from this range will decide the next trend.
✅ Facts & Insights
Fact 1: Above ₹975, HDFC Bank can rally towards ₹980 – ₹992 and possibly ₹1,020.
Fact 2: Below ₹960, stock may slip to ₹945 – ₹950, and deeper to ₹920 – ₹900 if weakness continues.
Fact 3: Long-term outlook remains positive, but short-term is sideways until a breakout.
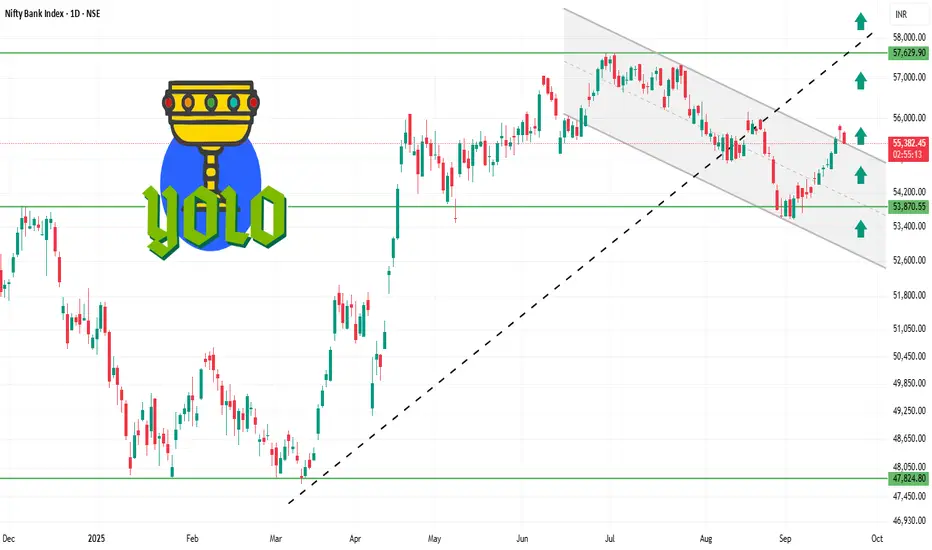
BANKNIFTY 1D Time frame✅ Current Facts
Current Level: ~ 55,400 – 55,480
Trend: Mildly bullish; trading above short-term moving averages (20-day & 50-day EMA).
Momentum Indicators:
RSI (14-day): ~61 → bullish but not overbought.
MACD: Positive → supporting the upward trend.
Price Action: Daily candles show small upper wicks → minor profit-taking near resistance.
⚙️ Outlook
Bullish Scenario:
Holding above 55,350 → retest 55,550–55,600 and possibly 55,700–55,750.
Range / Consolidation:
Price oscillates between 55,350 – 55,550 → sideways trading likely.
Bearish Scenario:
Close below 55,350 → downside risk toward 55,150–55,200 or lower.
⚠️ Key Facts
55,400 – 55,500 is acting as a short-term pivot: above it favors bulls, below it favors bears.
Resistance at 55,550–55,600 is the first hurdle; breakout here can lead to further upside.
Support at 55,300–55,350 is critical; failing to hold may lead to short-term correction.
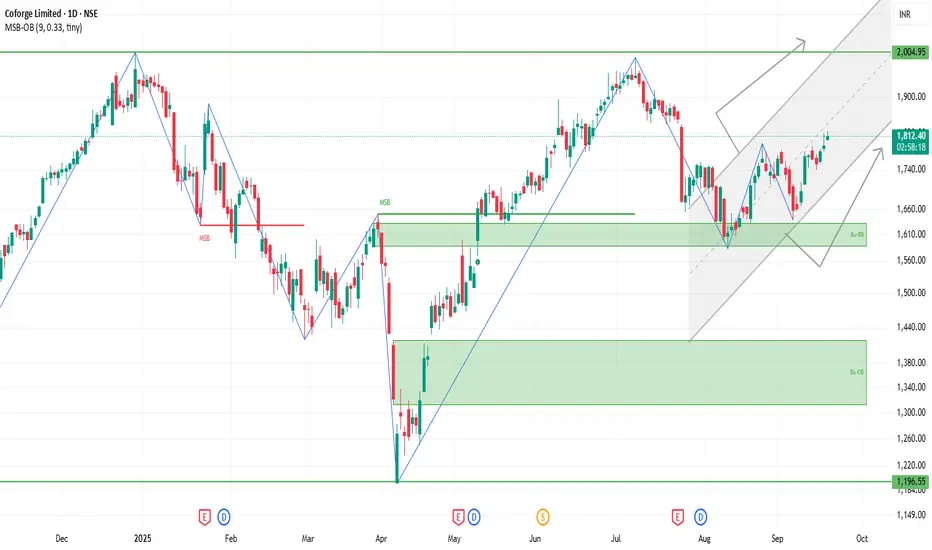
COFORGE 1D Time frameCurrent Snapshot
Price is trading near ₹1,812.
Stock is showing good strength above short-term and long-term moving averages.
Volatility is moderate, so sharp intraday swings are possible.
⚙️ Indicators / Momentum
Moving Averages: All key averages (short, medium, long) are bullish.
MACD / Momentum: Positive, supporting upside.
RSI: Slightly high, showing strength but near overbought zone → chances of small pullback.
📌 Key Levels
Immediate Resistance: ₹1,820 – ₹1,835.
Immediate Support: ₹1,790 – ₹1,800.
Stronger Support: ₹1,750 – ₹1,760 if weakness extends.
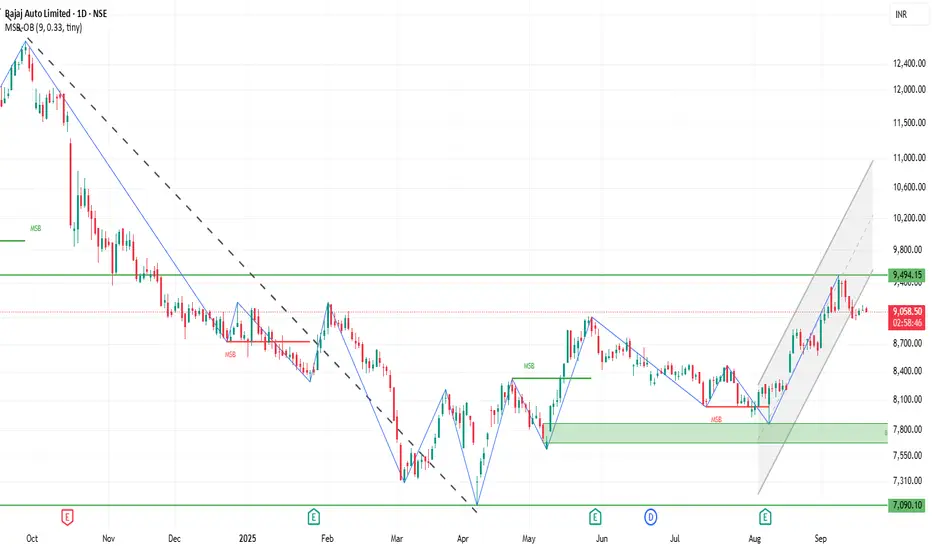
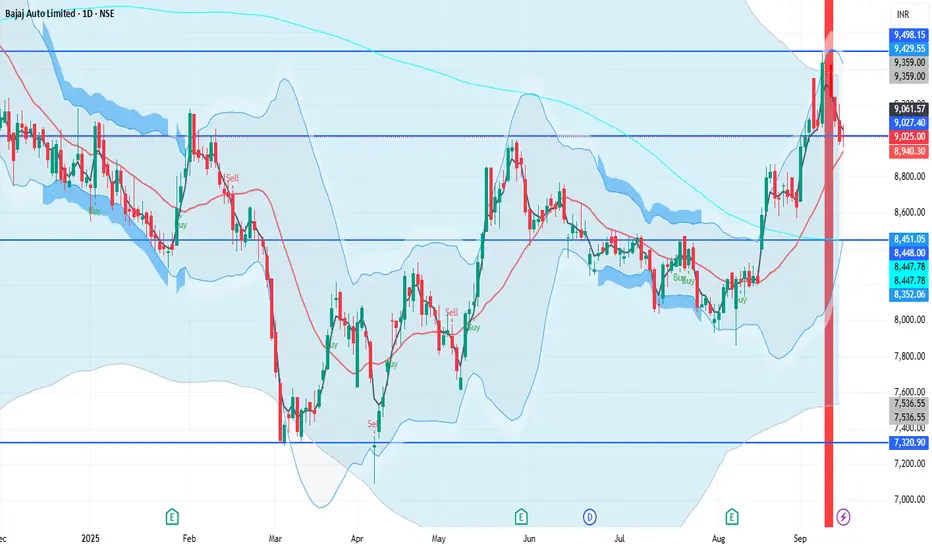
BAJAJ_AUTO 1D Time frameCurrent Snapshot
Price is trading around ₹9,080 – ₹9,100.
Stock is moving above both 50-day and 200-day moving averages, showing a steady uptrend.
It is still below its all-time high, so recovery space remains.
⚙️ Indicators / Momentum
RSI: Neutral, neither overbought nor oversold.
MFI (Money Flow Index): Balanced, showing moderate buying pressure.
Momentum: Stable with a slightly bullish bias.
📌 Key Levels
Immediate Resistance: ₹9,300 – ₹9,400.
Immediate Support: ₹8,800 – ₹9,000.
Stronger Support: Near ₹7,500 on longer-term charts.
✅ Outlook
Trend remains mildly bullish as long as price stays above ₹9,000.
Break above ₹9,400 could push price toward new highs.
Fall below ₹8,800 may lead to deeper correction.
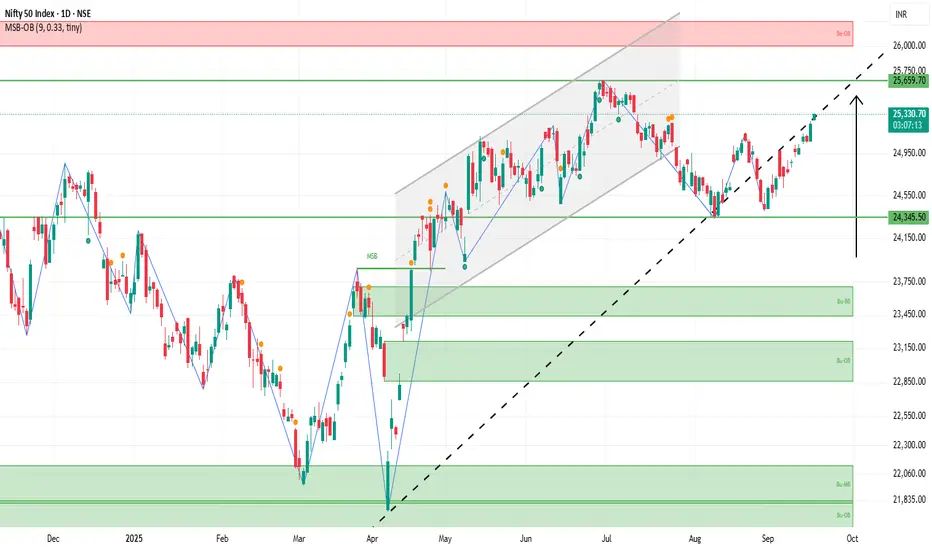
NIFTY 1D Time frame Today’s Nifty
Nifty is around 25,326.
It started higher than yesterday, so buyers are slightly stronger.
The trend is mildly bullish, not too strong.
Support (Where Nifty may stop falling)
25,229 → first safety net.
25,200 → key round number support.
25,000 → strong support; big drop if broken.
Resistance (Where Nifty may stop rising)
25,261 → small ceiling.
25,316 → bigger hurdle; breaking means bulls are strong.
25,350–25,360 → tough ceiling; breakout may continue uptrend.
Trend & Simple View
Mildly bullish now.
If Nifty breaks resistance, it may go higher.
If it falls below support, it may drop more.
Easy analogy: Nifty is like a ball bouncing between floor (support) and ceiling (resistance).
HDFCBANK 1D Time frameCurrent Stock Price
Current Price: ₹966.85
Day’s Range: ₹965.15 – ₹974.40
52-Week Range: ₹806.50 – ₹1,018.85
Market Cap: ₹14.88 lakh crore
P/E Ratio: 21.03
EPS (TTM): ₹45.97
Dividend Yield: 1.13%
Book Value: ₹339.84
📈 Trend & Outlook
Short-Term Trend: Mildly bullish; stock showing positive movement in recent sessions.
Resistance Levels: ₹974.40 (day’s high), ₹1,018.85 (52-week high).
Support Levels: ₹965.15 (day’s low), ₹950.00 (recent low).
Investor Sentiment: Positive, supported by institutional buying and favorable outlook.
🧭 Key Notes
Stock has room to move higher if it breaks near-term resistance.
If it falls below support, downside may extend to ₹950 or lower.
Overall, bulls are slightly stronger, but watch resistance for profit booking.
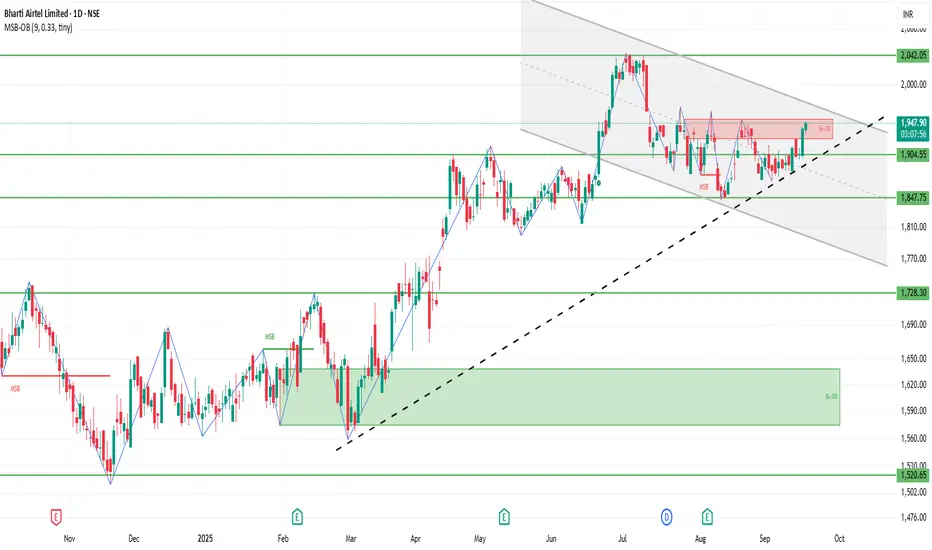
BHARTIARTL 1D Time frameCurrent Stock Price
Current Price: ₹1,944.50
Day’s Range: ₹1,933.25 – ₹1,944.85
52-Week Range: ₹1,510.80 – ₹2,045.80
Market Cap: ₹11.63 lakh crore
P/E Ratio (TTM): 31.89
EPS (TTM): ₹60.94
Dividend Yield: 0.82%
Book Value: ₹150.17
📈 Trend & Outlook
Short-Term Trend: Bullish; the stock is trading near its 52-week high, indicating strong investor confidence.
Resistance Levels: ₹1,944.85 (day’s high), ₹2,045.80 (52-week high).
Support Levels: ₹1,933.25 (day’s low), ₹1,910.00 (psychological support).
Investor Sentiment: Positive, with strong institutional interest and favorable analyst outlooks.
🧭 Analyst Insights
Valuation: The stock
Volume Profile & Market Structure AnalysisPart 1: Understanding Market Structure
1.1 What is Market Structure?
Market structure is the framework of price movement. It’s the natural rhythm of the market, made up of highs, lows, trends, ranges, breakouts, and consolidations. Think of it as the skeleton of price action, which reveals how institutions and retail traders interact.
In simple terms, market structure helps us answer:
Is the market trending up, trending down, or consolidating?
Where are liquidity pools likely located?
Which price levels matter most to big players (banks, hedge funds, market makers)?
1.2 The Building Blocks of Market Structure
Swing Highs and Swing Lows
Swing High: A peak where price fails to continue higher.
Swing Low: A valley where price fails to continue lower.
These levels often act as liquidity pools where stop losses gather.
Trends
Uptrend: Higher highs (HH) and higher lows (HL).
Downtrend: Lower lows (LL) and lower highs (LH).
Sideways/Range: Price oscillates between support and resistance with no clear direction.
Break of Structure (BoS)
When price violates the previous high or low, signaling a shift in trend. Example: if price makes a new higher high after a downtrend, that could signal a bullish shift.
Change of Character (ChoCh)
A sudden break in the short-term market rhythm, often the first clue of a potential trend reversal.
Liquidity
Stop orders, pending orders, and clusters of positions sitting around obvious levels (support, resistance, round numbers).
Market makers often push price toward these liquidity zones to fill large institutional orders.
1.3 Institutional vs. Retail Market Structure
Retail traders often focus on patterns (double tops, triangles, flags).
Institutions care about liquidity and order flow. They engineer moves to trap retail positions and accumulate their own.
This is why understanding structure at an institutional level (smart money concepts) is crucial. It explains phenomena like false breakouts, liquidity sweeps, and stop hunts.
Part 2: Understanding Volume Profile
2.1 What is Volume Profile?
Volume Profile is a charting tool that shows how much trading volume occurred at each price level during a given period. Instead of just telling you “when” trades occurred (time-based volume), it tells you “where” trades occurred in price.
The Volume Profile is plotted as a horizontal histogram along the price axis. This makes it easier to see which price zones attracted the most participation from traders and institutions.
2.2 Key Components of Volume Profile
Point of Control (POC)
The price level with the highest traded volume.
Acts as a magnet for price because it represents “fair value.”
Value Area (VA)
The range where about 70% of trading volume occurred.
Split into:
Value Area High (VAH)
Value Area Low (VAL)
High-Volume Nodes (HVN)
Areas of heavy participation (accumulation zones).
Price often consolidates here.
Low-Volume Nodes (LVN)
Areas where price quickly passed through with little trading.
Often act as support/resistance.
2.3 Why Volume Profile Matters
Shows institutional footprints: Institutions need liquidity to fill big orders, so they often transact heavily around POC and HVNs.
Highlights imbalances: When price rejects LVNs, it suggests aggressive buying/selling dominance.
Helps with trade entries & exits: Knowing where fair value is (POC) vs. imbalance zones helps traders time reversals or continuations.
Part 3: Combining Market Structure & Volume Profile
Market Structure tells you the direction of the market, while Volume Profile shows you where the heavy battles occur. Used together, they create a powerful framework.
3.1 Example: Trend Continuation Setup
Step 1: Identify the trend using Market Structure (higher highs, higher lows).
Step 2: Look at Volume Profile to find the POC or Value Area Low (support).
Step 3: If price retraces to VAL while maintaining bullish structure, it’s often a high-probability continuation zone.
3.2 Example: Reversal Setup
Step 1: Notice a Change of Character (ChoCh) in structure.
Step 2: Check if price swept liquidity near an HVN or POC.
Step 3: If Volume Profile shows rejection of that value area, it signals strong reversal potential.
3.3 Liquidity & Volume Synergy
Liquidity pools (stop-loss clusters) often sit near low-volume nodes because price moves fast through those zones.
Institutions push price into these LVNs to trigger stops and then absorb liquidity.
Once filled, price usually returns to HVNs (fair value).
Part 4: Practical Strategies with Volume Profile & Market Structure
4.1 The Volume Profile Rejection Strategy
Identify LVNs.
Wait for price to test and sharply reject.
Enter with trend confirmation from market structure.
4.2 Breakout + Volume Profile Confirmation
If price breaks a structural level (BoS), check if it’s supported by high volume near POC.
Strong volume = genuine breakout.
Weak volume = likely false breakout.
4.3 Value Area Rotations
Price often oscillates between VAH and VAL.
Strategy: Buy near VAL, sell near VAH, exit at POC.
Works best in ranging conditions.
Part 5: Psychological & Institutional Insights
Retail Traps: Market structure fakeouts occur around LVNs, engineered by institutions.
Smart Money Accumulation: Seen in HVNs—where large players accumulate before big moves.
Auction Theory: Markets function as auctions—Volume Profile is essentially a visualization of that auction process.
Conclusion
Volume Profile and Market Structure Analysis are not “magic bullets,” but together they form one of the most institutionally aligned trading frameworks available to retail traders.
Market Structure explains where price wants to go.
Volume Profile explains where participants are most active.
By combining them, traders can anticipate moves with higher probability, avoid traps, and align themselves closer to the behavior of professional market participants.
Ultimately, the goal is to stop thinking like a retail trader chasing indicators and start thinking like a liquidity hunter—someone who understands where the market is auctioning, who’s trapped, and where the next wave of orders is likely to hit.
BAJAJ_AUTO 1D Time frameCurrent Price: ₹9,000 – ₹9,025
Day’s Range: ₹8,964 – ₹9,091.50
Previous Close: ₹8,999.50
🔹 Support & Resistance
Support 1: ₹8,950 – ₹8,900
Support 2: ₹8,800 – ₹8,750
Resistance 1: ₹9,050 – ₹9,100
Resistance 2: ₹9,200 – ₹9,250
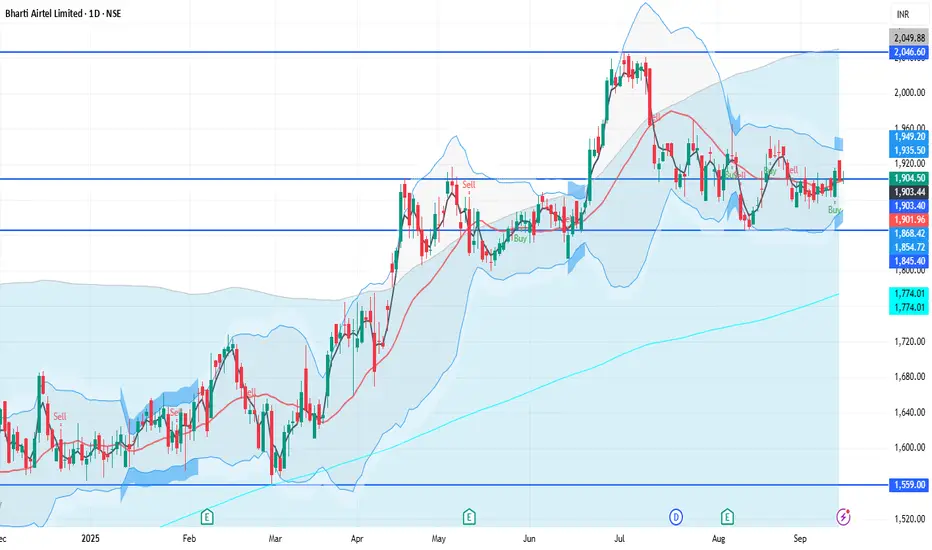
BHARTIARTL 1D Time frameUpdated Snapshot
Current Price: ₹1,903 – ₹1,906
Day’s Range: ₹1,901.60 – ₹1,925
Previous Close: ₹1,902.60
🔹 Support & Resistance
Support 1: ₹1,900 – ₹1,895
Support 2: ₹1,880 – ₹1,870
Resistance 1: ₹1,920 – ₹1,925
Resistance 2: ₹1,950 – ₹1,960
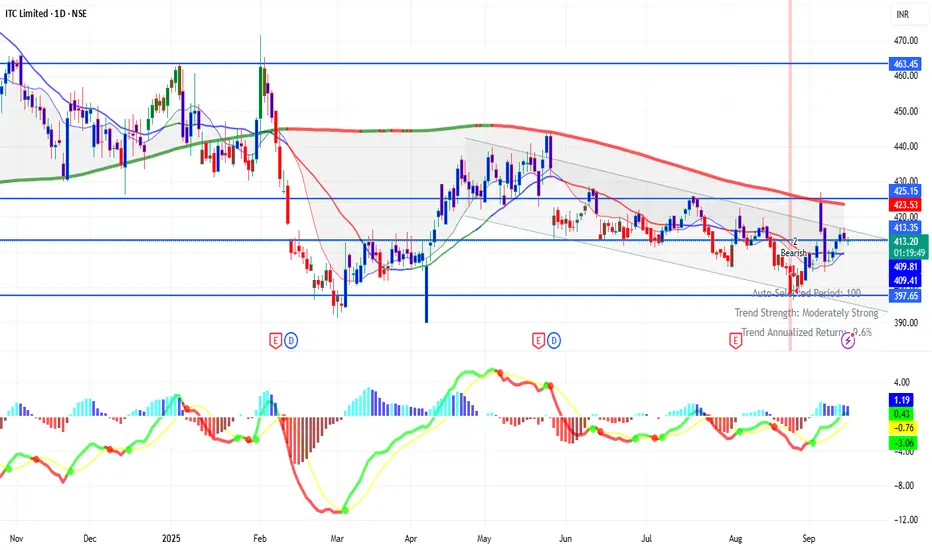
ITC 1D Time framePrice Action
Current Price: ₹413.75 (approx)
Day’s Range: ₹413.05 – ₹414.30
52-Week Range: ₹390.15 – ₹528.50
🔹 Support & Resistance
Immediate Support: ₹410 – ₹408
Next Support: ₹402 – ₹397
Immediate Resistance: ₹416 – ₹420
Next Resistance: ₹422 – ₹428
INFY 1D Time frameCurrent Price: ₹1507 (approx)
Day’s Range: ₹1507 – ₹1543
Previous Close: ₹1509.10
🔹 Support & Resistance
Support 1: ₹1500
Support 2: ₹1490 – ₹1470
Resistance 1: ₹1539 – ₹1552
Resistance 2: ₹1560 – ₹1570
KOTAKBANK 1D Time frameCurrent Price: ₹1970.40 (approx)
Day Range: ₹1968 – ₹1981.60
Previous Close: ₹1972.30
🔹 Support & Resistance
Pivot: ₹1975.70
Resistance 1: ₹1983.40
Resistance 2: ₹1989.30
Resistance 3: ₹2002.90
Support 1: ₹1969.80
Support 2: ₹1962.10
Support 3: ₹1948.50

LT 1D Time frameCurrent Price
₹3,600.70
🔹 Market Snapshot
Day’s Range: ₹3,575.50 – ₹3,607.00
Previous Close: ₹3,579.80
52-Week Range: ₹2,965.30 – ₹3,963.50
Market Cap: ₹4.95 lakh crore
P/E Ratio (TTM): 31.91
P/B Ratio: 5.68
Dividend Yield: 0.94%
EPS (TTM): ₹112.82
Book Value per Share: ₹634.43

ANGELONE 1D Time frameCurrent Price: ₹2,238 – ₹2,240
Day’s Range: ₹2,212.60 – ₹2,274
Previous Close: ₹2,222.30
🔹 Support & Resistance
Support 1: ₹2,220 – ₹2,215
Support 2: ₹2,200 – ₹2,180
Resistance 1: ₹2,250 – ₹2,260
Resistance 2: ₹2,270 – ₹2,280

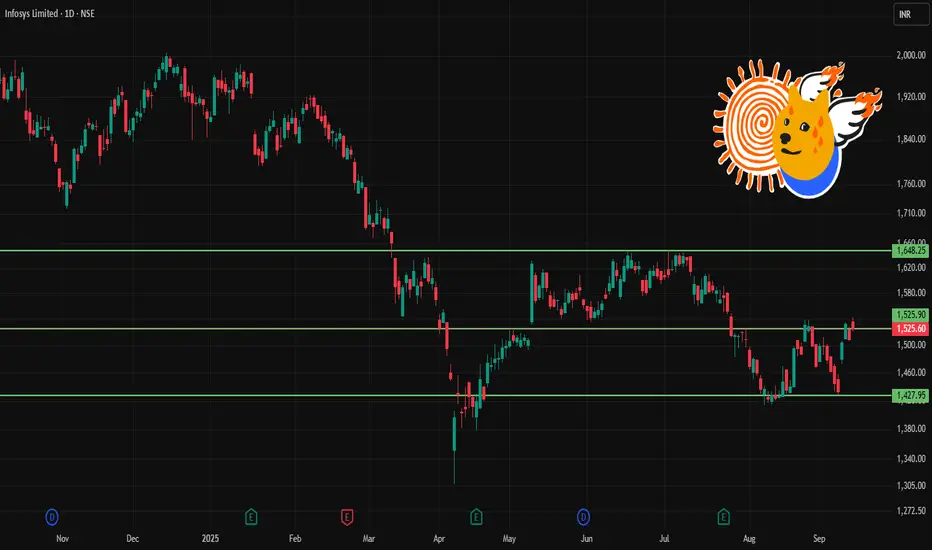
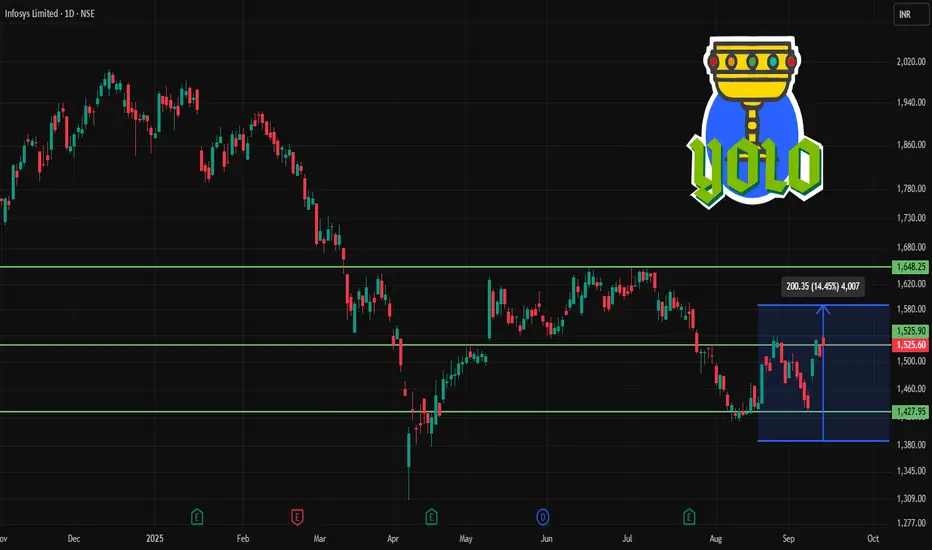
INFY 1D Time frameCurrent Price & Trend
Current Level: ~₹1,525
Trend: Neutral to bullish → stock is slowly recovering from recent lows.
Momentum: Buying support is visible near ₹1,500 zone.
Indicators
RSI: Around 59 → healthy, not yet overbought.
MACD: Positive crossover → signals upward momentum.
Moving Averages: Price is above short-term averages, but medium-term trend is still consolidating.
Bullish Scenario
If INFY sustains above 1,540, it can move toward 1,560 – 1,600.
A breakout above 1,600 could trigger further rally toward 1,650.
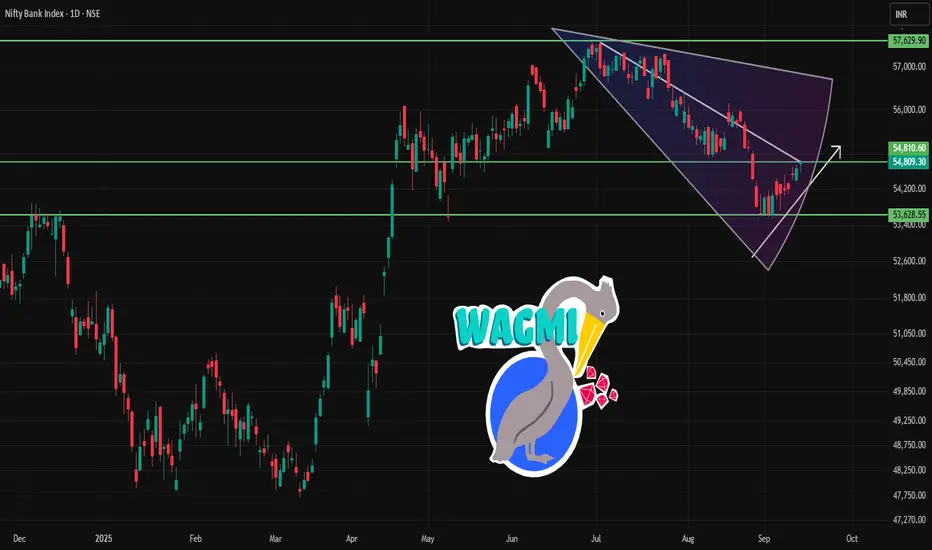
BANKNIFTY 1D Time frameCurrent Price & Trend
Current Level: 54,809
Trend: Neutral to mildly bullish
Range Context: Close to resistance zone, so movement here is crucial
Bullish Case
If Bank Nifty closes above 55,000–55,200, it can rally toward 55,500–55,700.
Sustained buying could push further toward 57,000 in coming sessions.
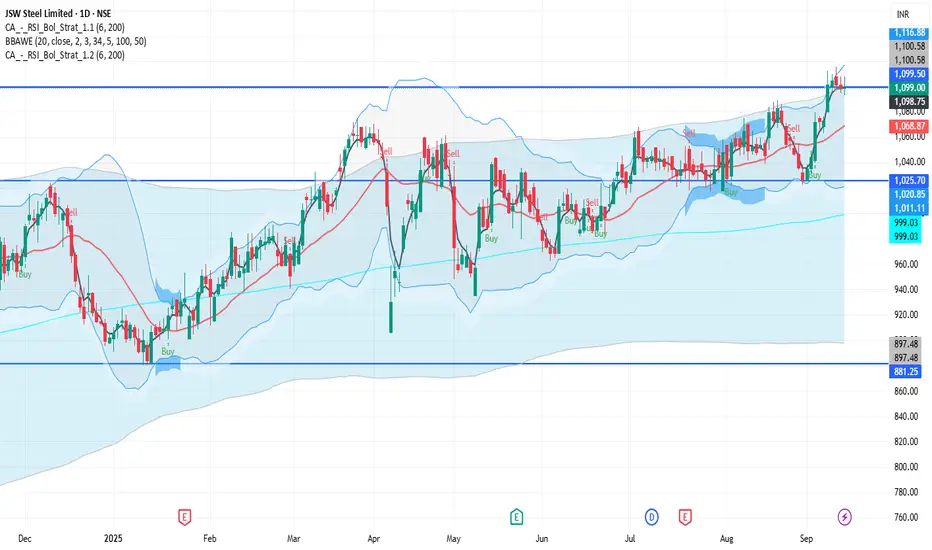
JSWSTEEL 1D Time frameCurrent Price & Trend
Price: ₹1,099.00
Trend: Neutral to mildly bullish; trading near the upper end of its 52-week range (₹880.00 – ₹1,115.50).
Momentum: Indicators suggest a neutral to slightly bullish outlook.
Bullish Scenario
Breakout Above ₹1,115: A sustained move above ₹1,115 could target ₹1,130 – ₹1,135 in the short term.
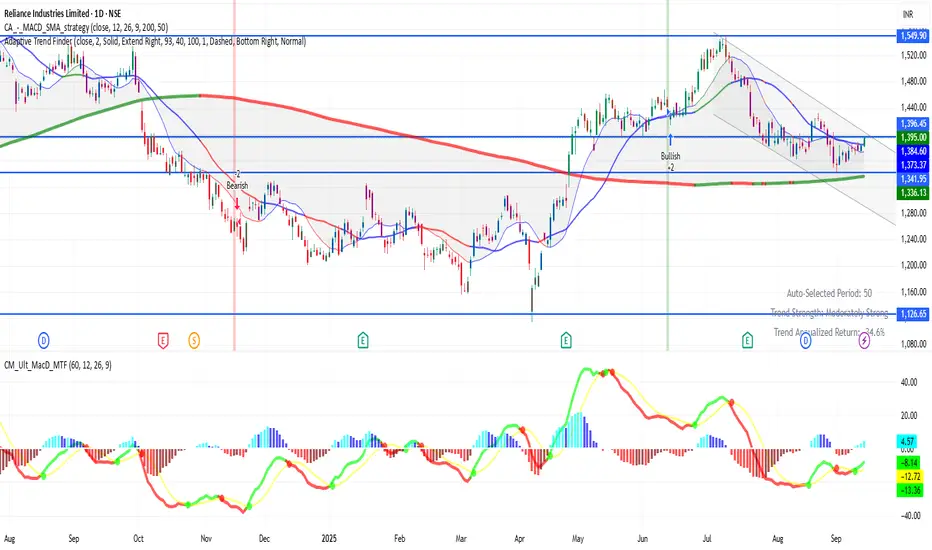
RELIANCE 1D Time frameCurrent Status
Price is around ₹715
The stock has been showing strength recently, with many of its moving averages (short- to long-term) supporting the rise.
Technical indicators like RSI, MACD, ADX etc. lean positive — buyers seem to have the upper hand.
There’s an inverted Head & Shoulders pattern forming, which is a bullish reversal signal if confirmed. Support zones are holding up so far.
Bullish Scenario
If Tata Motors stays above ₹700–705 support and breaks past ~₹720–725 with volume:
Possible upside to ~₹730-₹740
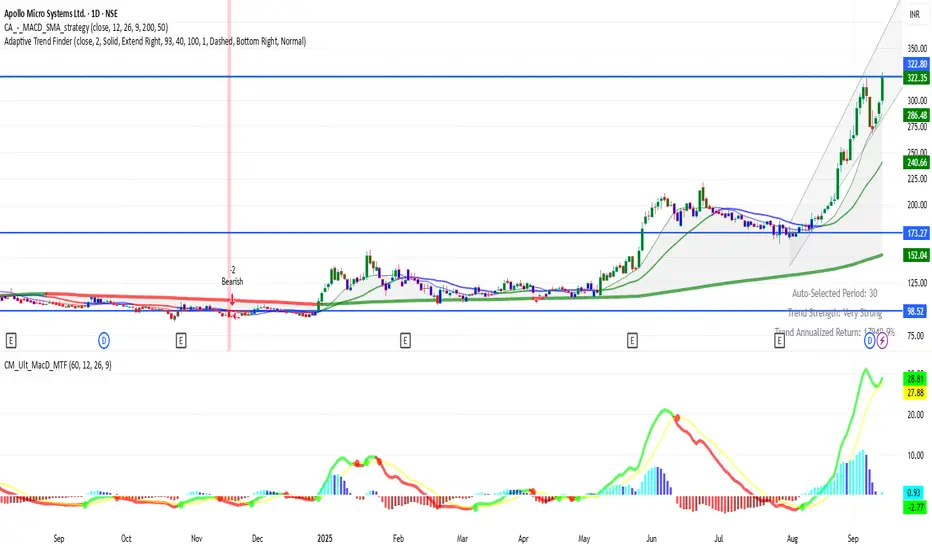
APOLLO 1D Time frame Current Status
Price: ₹322
Trend: Strong uptrend, stock recently made fresh highs.
Momentum: Very strong, but slightly overbought in daily indicators.
Key Levels
Immediate Resistance: ₹326 – ₹330 (recent high zone)
Next Resistance: ₹340 – ₹345 (if breakout continues)
Immediate Support: ₹300 – ₹305
Stronger Support: ₹280 – ₹285
SBIN 1D Time frame📉 Current Market Snapshot
Closing Price: ₹823.55
Day's Range: ₹819.80 – ₹825.80
52-Week High: ₹875.45
52-Week Low: ₹680.00
Market Cap: ₹7,60,188 crore
P/E Ratio (TTM): 9.57
P/B Ratio: 1.47
Dividend Yield: 1.93%
EPS (TTM): ₹86.06
Book Value: ₹527.66
Face Value: ₹1.00
Volume: 5,078,018 shares
VWAP: ₹822.84

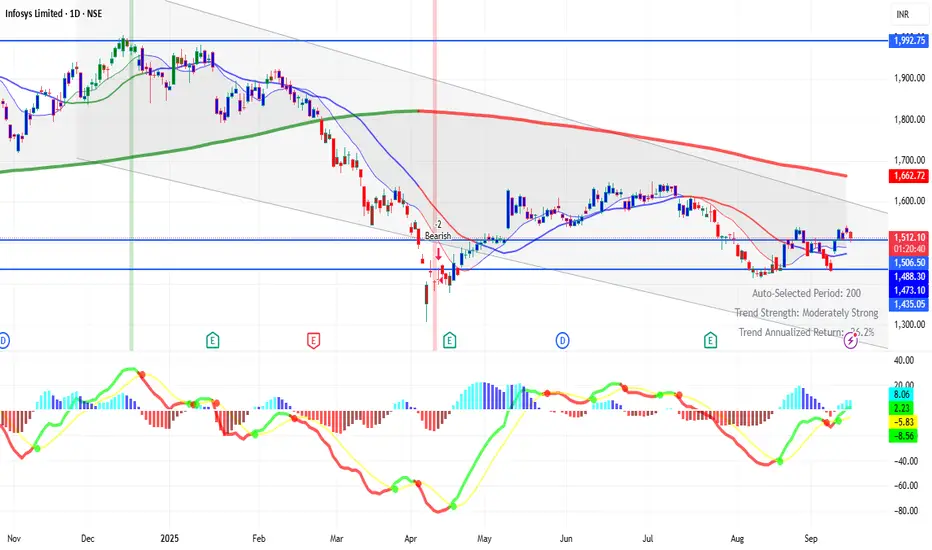
INFY 1D Time frame📉 Current Market Snapshot
Current Price: ₹1,525.60
Previous Close: ₹1,509.70
Day's Range: ₹1,521.10 – ₹1,542.90
52-Week High: ₹2,006.45
52-Week Low: ₹1,307.00
Market Cap: ₹6,33,794 crore
P/E Ratio: 23.0
Dividend Yield: 2.82%
ROE: 28.72%
Debt-to-Equity Ratio: 0.09
Beta: 1.11
EPS (TTM): ₹65.63
Face Value: ₹5.00
VWAP: ₹1,529.86
Volume: 12,856,963 shares
ATR (14): ₹5.72
MFI: 71.75